A Surface Plasmon Resonance (SPR) and Water Quality Monitoring: A System for Detecting Harmful Algal Bloom
Volume 6, Issue 1, Page No 770-775, 2021
Author’s Name: Walvies Mc. Alcos1, Mirador G. Labrador2,a)
View Affiliations
1College of Engineering, Samar State University, Catbalogan City, 6700, Philippines
2Center for Engineering, Science and Technology Innovation, Samar State University, Catbalogan City, 6700, Philippines
a)Author to whom correspondence should be addressed. E-mail: inegara@binus.edu
Adv. Sci. Technol. Eng. Syst. J. 6(1), 770-775 (2021); ![]() DOI: 10.25046/aj060185
DOI: 10.25046/aj060185
Keywords: Harmful Algal Bloom, Surface Plasmon Resonance, Red Tide, Water Quality Monitoring

Export Citations
Harmful algal blooms (HAB) or “Red tides” are organisms which produce toxins which are harmful to humans, fish, and other marine mammals. The said toxins come from dinoflagellates of genus Pyrodinium Bahamense var Compressum that cause Paralytic Shellfish Poisoning (PSP) and Dinophysis Caudata and Prorocentrum lima which results to Diarrhetic Shellfish Poisoning (DSP). In the coast of Western Samar, Philippines, there are reported occurrences of red tide toxins based on the laboratory result conducted by the Bureau of Fisheries and Aquatic Resources (BFAR) and the Local Government Unit (LGUs). HAB or Red tide has an impact on economy in terms of the loss of livelihood, sales, and exports, and also in terms of human life. This study developed a system that automatically detects the presence of red tide toxins and water quality parameters. Red Tide toxins and water quality parameters are determinant factors in detecting and forecasting the occurrence of HAB. In particular, the system utilizes a Surface Plasmon Resonance (SPR) and Water Quality parameter sensors used in detecting red-tide toxins and water quality. Data or information collected and generated by the system can be used for a faster, effective and efficient way of detecting and predicting the possible occurrence of HAB. Results positively indicate that the system performance can indeed be used as a Method in the detection and prediction of Harmful Algal Bloom. Specifically, for a time period of 80 minutes, 16 different sets of water parameters are captured and transmitted to the centralize system – making the system to be 100% functional as it is being set to operate in 5 minutes interval. Likewise, SPR bio toxin detection has a deviation rate of (+/-) 20%. Operational performance of the system is found to be 100%.
Received: 07 October 2020, Accepted: 16 January 2021, Published Online: 05 February 2021
1.Introduction
Harmful algal blooms or HABs are organisms that produce toxins which are harmful to humans, fish, and other marine mammals. The said toxins come from Dinoflagellates of the genus Pyrodinium bahamense var compressum that is accountable for causing Paralytic Shellfish Poisoning (PSP) when ingested by mussels or oysters and also taken in by humans and for Diarrhetic Shellfish Poisoning (DSP) caused by the presence of Dinophysis caudata and Prorocentrum lima. In addition, this phenomenon has an enormous impact when it comes to economy since the production of supply of sea products, especially shellfish industry, is greatly affected.
There are over 4000 species algae (phytoplankton) and 2% (60 – 78 species) are known to produce toxins, and most of which are dinoflagellates. A proportion of these toxic dinoflagellates has a red-brown pigmentation-giving rise to the naming of algal blooms as ‘red-tides’, however, not all toxic algae are colored and incidents of poisoning have occurred in the absence of red blooms. Visible red tides may contain from 20,000 to 50,000 algal cells per l ml of seawater; however, concentrations as low as 200 cells per l ml may produce toxic shellfish [1].
In the coast of Western Samar, Philippines, there are reported occurrences of red tide toxins based on the laboratory result conducted by the Bureau of Fisheries and Aquatic Resources (BFAR) and the Local Government Unit (LGUs) from 2012 up to present. Based on their data, the most occurrence of red-tide was in Irong-irong Bay, located in one of the costs of Samar Island, Philippines. It was followed by by Cambatutay Bay, Maqueda Bay, Villareal Bay of the same Island. The occurrence of this problem lasts for an average of 3 months with a longest recorded occurrence of 5 months for the past 5 years as indicated in 2016 Report of Bureau of Fishery and Aquatic Resources (BFAR).
On the contrary, various technologies were developed which are used in detecting HAB. One of these is the technology that utilizes fiber optic sensor in the detection of neurotoxin that causes harmful algal bloom. The technology makes use of the combination of absorption and reflection spectroscopy and the Principle Component Analysis (PCA) signal processing [2]. The process of sampling of the said technology starts with the gathering of contaminated water and put that sample on the device for analysis. But, there is no continuous monitoring mechanism on this part since there will be only testing of the sampled water if the user or researcher is on the site.
With this, the proposed system made use of ICT in achieving a real-time and low-cost monitoring of the different triggering factors of the occurrence of HAB. Specifically, a surface plasmon resonance multiplexer sensor and water quality parameter sensor was used coupled with that of the server-based monitoring software. Data gathered by the sensors were sent to a server-based program application. The same information are being stored in a cloud based services. Data captured and stored in a server based and cloud based application program will serve as a prime basis in the analysis and detection and prediction of HABs.
In particular, the study aims to develop an automated system that will capture the dynamics of the different parameters associated for the occurrence of HABs. Data captured in real-time basis will serve as inputs in the prediction. However, HABs prediction model based on the captured data by the developed system is not covered on this paper. Again, the intention of this study is to develop an automated mechanism that will detect the presence and dynamics of red-tide causing parameters.
2. Related Literature
The recurring occurrence of Harmful Algal Bloom in the coastal water of Samar, along with its adverse effect in human health and aquatic organisms necessitates the need to come-up an effective and efficient approaches, processes or technology that can be used to fast-tract the detection of the said phenomenon which is of paramount important. As such, several research and projects along on this area have been undertaken. On this, an analytical method has been developed for the quantitative analysis of marine biotoxins in shellfish – the main cause of the occurrence of harmful algal bloom.
One of such analytical method was made through the so called High Performance Liquid Chromatography (HPLC) with fluorescent detection using both pre-column oxidation as described in [3] and post column oxidation as described in [4]-[7]in addition to liquid chromatography tandem mass spectrometry. Similarly, HPLC with fluorescence detection in [8] have been utilized for the detection of Paralytic Shellfish Poisoning (SPS) toxins in algal and seawater samples with detection limits of nanograms per milliliter. Similarly, HPLC with fluorescence detection in [9] and LCMS/MS methods have been applied for the detection of the DSP toxins in algal and seawater samples as described in [10]-[14]. Furthermore, the study of [15] describes a method incorporating HPLC with fluorescent detection of domoic acid with others using modified version as indicated in [16]-[18]. Indeed, the used of analytical method has been widely explored as evident to the number of researches undertaken as described previously; however, the said methods require skilled personnel and are labor intensive measuring only toxin group per method.
On the other hand, the study of [19], explored the used of near real-time ocean color data from the Sea-viewing Wide Field-of-view Sensor (SeaWiFS) to detect and trace HAB in Southwest Florida coastal water, its optical characteristics are influenced not only by phytoplankton and related particles, but also by the other substances, that vary independently of phytoplankton, notably inorganic particles in suspension and yellow substances. The results of the study showed that the SeaWiFS data provides an unprecedented tool for research and managers to study and monitor algal blooms in coastal environments. The existing study was also was not practical and expensive to be adopted by a rural area.
Accordingly, the study of [20], used the Early Warning Harmful Algae Bloom (HAB) Sensing System for use in Underwater Monitoring which utilizes Principal Component Analysis (PCA) to establish the complex linkages between ocean color, absorption and scattering, algae pigmentation and cell size, along the depth of bloom layers. The author proposed an optical fiber sensor based method of detecting the associated neurotoxins that cause Harmful Algal Blooms.
Another technology was developed by [21], a field deployable method that uses Surface Plasmon Resonance (SPR) and species-specific Peptide Nucleic Acid (PNA) probes to detect Alexandrium (a genus of dinoflagellate that is responsible for Paralytic Shellfish Poisoning at extremely low cell densities) rRNA. This instrument has been tested using synthetic nucleotide sequences designed to mimic two species of Alexandrium. The SPR is an optical detection method that measures the change in refractive index after binding (Hybridization) of a target to probe on a surface [22]. Changes in refractive index are measured in resonance units (RUs) [23] The samples are manually injected to the portable device, 100 uliters, and then starts to measure the sample.
The study of [24] developed a toolkit used rapid HABs detection and monitoring of maritime microalgae dubbed as Suitcase Lab. The toolkit enable rapid detection of specific microalgae associated with that of HABs as used in fields. In fact the toolkit can detect the presence of A. catenella – an HABs causing microorganism within the 2 hours of time sampling. Along with this, investigation and on micro phytoplankton community structure and abundance in two contrasted marine ecosystem has been explored in [25]. Results of such investigation indicates that the presence of such microorganism is prevalent in the commercially exploited environment.
The existing study does not have continuous monitoring mechanism on this part since there will be only manual testing of the sampled water if the user or researcher is on the site. With our technology, the testing of sample procedure is automated and will
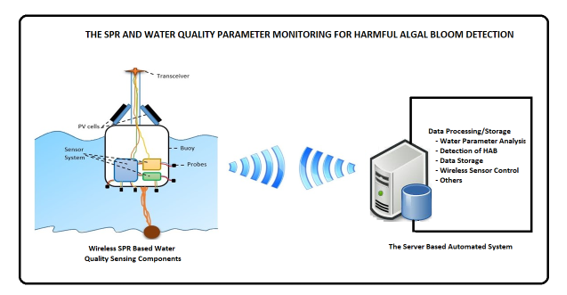 Figure 1: Developmental Model of the System
continuously be monitored depending on the necessary frequency of testing to be conducted.
Another method being explored in the detection of underwater biotoxins is the used of Surface Plasmon Resonance Technique described in [26]-[28]. Further, the study of [29] reported an situ SPR system using special optical fibers for measuring salinity of seawater using the determination of refractive index. The sensor was tested on a pelagic profiler and was successfully found to be functional. The study in [30] presented a similar optical fiber based SPR system for in situ measurement of reflective index and deployed it in 2013 in deep water.
3. System Development Model
A developmental research design approach following the Dynamic System Development Model (DSDM) has been adopted. DSDM is a project development concept consisting six phases as follows: (1) conceptualization, requirement and specification phase; (2) System Analysis Phase; (3) System Design – Hardware and Software Design phase; (4) Testing and Implementation Phase; and (5) Evaluation Phase.
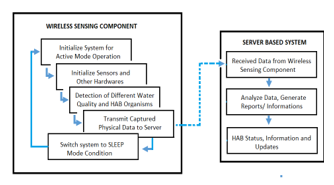 Figure 2: Operational and Functional Flow of the System
In the conceptualization phase, benchmark information has been collected and analyzed. Benchmark information includes, but not limited to existing and similar technologies along water quality and harmful algal bloom detection; historical data on water quality and occurrence of harmful algal bloom in the specific site area; climate change and anthropogenic activities as causative factors to HAB occurrence; and other relevant information. This information becomes the basis in the formulation of the system conceptual model which is the outcome of the system analysis phase – the phase 2 of the DSDM. Figure 1 shows the conceptual model of the system.
In reference to the conceptual model shown in Figure 1, the operation and functional flow of the system has been developed following as one outcome of the system design process. The functional and operational flow indicated in Figure 2 shows the graphical over-all workings of the proposed system. Figure 2 shows the detailed process, required and implied components – both hardware and software of the proposed system.
In particular, the system has been implemented utilizing the proposed backbone network articulated in [31] and [32]. The said network governs the communication and data transmission requirements of the sensing components s and that of the server-based automated system. Note that as indicated in Figure 1, detection of Harmful Algal Bloom via SPR, largely depends on the different water quality parameters that are being detected. The development model consist of two subsystems: (1) the wireless sensing component and (2) the server-based automated system.
The wireless sensing component consists of different sensors that detect the presence of HAB microorganisms in water and other water parameters such as the pH, turbidity, temperature, dissolved oxygen, and environmental parameters such as air temperature and humidity
The server-based automated system received all the information from the wireless sensing components and performs analysis of all received data including the determination of the so-called Harmful Algal Bloom.
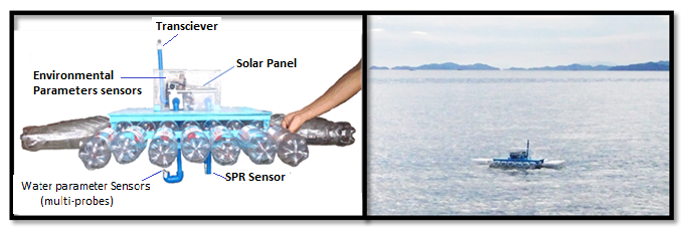 Figure 3: The Developed Wireless Sensors and SPR Based System
In particular, the Arduino uno, Xbee module, Spreeta Sensor, pH meter sensor, temperature sensor, humidity sensor, color -module, are used. Raspberry pie module. This hardware components form parts of the entire circuitry of the system. Further, a 5-watts solar panel is used to provide a 24/7 power supply to the wireless sensing component of the system. Note that a solar panel was specifically utilized in order to ensure a continuous power supply for the system and further ensure system continues operation.
The specific solar panel used was designed in conformity with the system required operational power where the current and voltage generated are auto-regulated. Voltage regulation was made possible with the use of LM317T and 1N4007 diode. In addition, considering the projected 24/7 operation of the system. Furthermore, the 1N4148 diode was also utilized to protect the LM317T and solar panel from reverse voltage generated by the battery. Reverse voltage is usually the main cause for the breakdown of the said component.
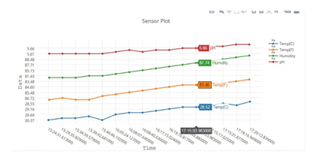 Figure 4: Water parameter sensor data
4. The SPR Based Harmful Algal Bloom System
4.1. The System Operation and Functional Flow
Figure 2 describes the operation and functions flow of the system. Once the system is on operational state condition – all sensors in the SPR based water quality monitoring automatically capture physical data and sends the same to the server-based automated system. Note that all sensors capture physical data and send the same to the central server for processing and analysis at an interval of 4 hours. On this case, reports on the water quality and status of HAB are updated every after 4-hours period.
On the other hand, the server based system contains application and analytical software that performs the analysis of all received data. However, captured data by SPR sensors and water quality parameters sensor are collectively and comparatively analyze in order to determine the possible occurrence of HAB or if there is an existing occurrence of the same. Figure 2 shows the detailed operational and functional flow of the system.
4.2. System Development, Field Testing and Evaluation
Figure 3 shows the actual wireless sensing component of the system during deployment, testing and evaluation. Major electronics and circuits are enclosed in an air-tight box. A Polyvinyl Chloride (PVC) pipe was used as enclosure for probes that are submerged in the water. The same material was used as enclosure for environmental parameter sensors such as air humidity and temperature. Empty plastic bottles were used as buoy.
The system was deployed in Maqueda Bay Samar, Philippines. The buoy containing the wireless sensing component was stationed 50 meters off the shore of Maqueda Bay, where the server-side of the system was placed. The major focus of the field-testing is to determine the operation performance and functions of the system. For this particular purpose the sensing component was set to capture physical data and transmit the same to server-based component at an interval of 5 minutes.
Figure 4 depicts the captured physical water parameters being observed by the system as received by the server for a time period of 80 minutes. 16 different sets of collected data are received by the serve-based system on the said time period. The figure shows that when the air temperature decreases, air humidity increases.
These characteristics occurred from the received data set at 15:44 o’clock until the last received data set at 17:20 o’clock. In other words, the said results validates the general principle that as air temperature increases, air can hold more water molecules, and its relative humidity decreases. Thus, when temperatures drop, relative humidity increases. Note that there are two sets of temperature indicated on the figure – one is being represented in degree Fahrenheit and the other is represented in degree Celsius. Hence what is being referred on this particular discussion is the temperature represented in degree Fahrenheit. The degree Celsius represent the sea water temperature.
On the other-hand, the pH value of water does not significantly changes over the entire test and evaluation period. Figure 4 indicates that the pH water value ranges only from 5.61 to 5.66.
Moreover, the SPR sensor are actually multiplex biosensors that detects paralytic shellfish poisoning toxins, such as saxitoxin, okadaic acids and domoic acid. On this case, evaluation of the SPR sensors was based on biosensors response measured in RU monitored for a certain period of time. With this in order to ensure its operational and functional performance, test, monitoring and evaluation has been separately carried over an 8-week period. It is to be noted that, when the SPR biosensor is unstable, there would have been steady decrease in responses over time at each time point. However, from Figure 5, it can be seen that SPR sensors response time did not drop off significantly for any biotoxin, although fluctuation did occur having a (+/-) 20% deviation from system deployment until the end of experimental tests.
4.3. System Operational Performance
To further ensure the efficiency of the system operational performance. The system has been subjected to further evaluation by experts – emphasizing the extent of functionality of all components measured based on success or failure of operation over total number of test trials. Result of the said evaluation is shown in table 1. As reflected on table 1, the success of operation of all components is at 100%. The said results only implied that the develop system is indeed reliable once it would be adopted. In particular, the wireless sensing component of the system is programed to operate in two mode of operations – the ACTIVE mode and the SLEEP mode. The system is said to be in ACTIVE mode when it captures physical data and transmit the same to the central server. When the captured data are successfully transmitted, then the wireless sensing component switches to SLEEP mode and remains on that state for a period of 4-hours.
Furthermore, it can be seen in the figure that for over a 10 test trials of the different system components, no failure has been recorded. With the said result, the system operational capability can be considered as effective and efficient.
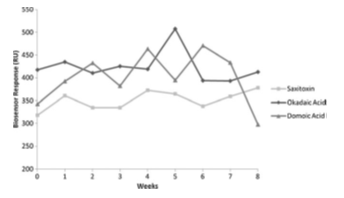 Figure 5: SPR biosensor stability curve using the 0 ng/ml calibration standard
5. Conclusion and Recommendation
This study validates that real-time monitoring of sea-water quality parameters is feasible. These parameters include pH level, turbidity, temperature, dissolved oxygen, ambient air temperature and humidity among others. Also, the study was able to prove the capability and stability of the SPR biosensors as used in detecting paralytic shellfish poisoning toxins.
Thus, with the capability of the developed system to (1) monitor the real-time quality of sea water and (2) determine the presence of paralytic shellfish poisoning toxins in sea-water can be a good mechanism in the detection and prediction of the possible occurrence of Harmful Algal Bloom. Note that the HAB occurrence are correlated with that of water quality. Specifically, for a time period of 80 minutes, 16 different sets of water parameters are captured and transmitted to the centralize system – making the system to be 100% functional as it is being set to operate in 5 minutes interval. Likewise SPR biotoxin detection has a deviation rate of (+/-) 20%. Operational performance of the system is found to be 100%.
| Table 1: Success and Failure of System Component Operations
|
||||
| Component and its Functions | Failure of Operation | Success Operation | No. of Test Trials | % of Success |
| The power supply and power system | 0 | 10 | 10 | 100% |
| Acquisition of Sensor Node data for transmission | 0 | 10 | 10 | 100% |
| pH level detection | 0 | 10 | 10 | 100% |
| Water color detection | 0 | 10 | 10 | 100% |
| Water Temperature detection | 0 | 10 | 10 | 100% |
| Air temperature detection | 0 | 10 | 10 | 100% |
| Reception/ Acquisition of sensors Data by Server Based system | 0 | 10 | 10 | 100% |
| Analysis and Display of Sensor Data in Server | 0 | 10 | 10 | 100% |
| Storage and retrieval of Data | 0 | 10 | 10 | 100% |
| SPR multiplex sensors | ||||
| Average | 0 | 10 | 10 | 100% |
In conclusion, the developed system can be used as a mechanism to automate the detection and prediction of the possible occurrence of HAB. However, the need for the development of a comprehensive HAB prediction model software that will utilize the data captured by the develop system is recommended since the said is out-of-context of this study.
Conflict of Interest
The authors declare no conflict of interest.
Acknowledgment
The authors wish to acknowledge the Office of the Research Center for Engineering, Science and Technology Innovation of Samar State University for the fund support extended for the research. Likewise, the same acknowledgement is extended to the Samar State University, College of Engineering
- A.C. Scoging, “Marine biotoxins.,” Symposium Series (Society for Applied Microbiology), 1998.
- P.C. Chu, Y.H. Kuo, “Detection of red tides in the Southwestern Florida coastal region using ocean color data,” in MTS/IEEE Seattle, OCEANS 2010, 2010, doi:10.1109/OCEANS.2010.5663861.
- H.Z. He, H. Bin Li, Y. Jiang, F. Chen, “Determination of paralytic shellfish poisoning toxins in cultured microalgae by high-performance liquid chromatography with fluorescence detection,” Analytical and Bioanalytical Chemistry, 2005, doi:10.1007/s00216-005-0092-8.
- Y. Oshima, “Postcolumn Derivatization Liquid Chromatographic Method for Paralytic Shellfish Toxins,” Journal of AOAC INTERNATIONAL, 1995, doi:10.1093/jaoac/78.2.528.
- D.Z. Wang, S.G. Zhang, H.F. Gu, L. Lai Chan, H.S. Hong, “Paralytic shellfish toxin profiles and toxin variability of the genus Alexandrium (Dinophyceae) isolated from the Southeast China Sea,” Toxicon, 2006, doi:10.1016/j.toxicon.2006.04.002.
- N. Touzet, J.M. Franco, R. Raine, “Influence of inorganic nutrition on growth and PSP toxin production of Alexandrium minutum (Dinophyceae) from Cork Harbour, Ireland,” Toxicon, 2007, doi:10.1016/j.toxicon.2007.03.001.
- N.G. Montoya, V.K. Fulco, M.O. Carignan, J.I. Carreto, “Toxin variability in cultured and natural populations of Alexandrium tamarense from southern South America – Evidences of diversity and environmental regulation,” Toxicon, 2010, doi:10.1016/j.toxicon.2010.08.006.
- M. Halme, M.L. Rapinoja, M. Karjalainen, P. Vanninen, “Verification and quantification of saxitoxin from algal samples using fast and validated hydrophilic interaction liquid chromatography-tandem mass spectrometry method,” Journal of Chromatography B: Analytical Technologies in the Biomedical and Life Sciences, 2012, doi:10.1016/j.jchromb.2011.11.015.
- I. Bravo, M.L. Fernández, I. Ramilo, A. Martínez, “Toxin composition of the toxic dinoflagellate Prorocentrum lima isolated from different locations along the Galician coast (NW Spain),” Toxicon, 2001, doi:10.1016/S0041-0101(01)00126-X.
- E. Fux, R. Bire, P. Hess, “Comparative accumulation and composition of lipophilic marine biotoxins in passive samplers and in mussels (M. edulis) on the West Coast of Ireland,” Harmful Algae, 2009, doi:10.1016/j.hal.2008.10.007.
- E. Fux, J.L. Smith, M. Tong, L. Guzmán, D.M. Anderson, “Toxin profiles of five geographical isolates of Dinophysis spp. from North and South America,” Toxicon, 2011, doi:10.1016/j.toxicon.2010.12.002.
- J.D. Hackett, M. Tong, D.M. Kulis, E. Fux, P. Hess, R. Bire, D.M. Anderson, “DSP toxin production de novo in cultures of Dinophysis acuminata (Dinophyceae) from North America,” Harmful Algae, 2009, doi:10.1016/j.hal.2009.04.004.
- P. Vale, V. Veloso, A. Amorim, “Toxin composition of a Prorocentrum lima strain isolated from the Portuguese coast,” Toxicon, 2009, doi:10.1016/j.toxicon.2009.03.026.
- A. Gerssen, P.P.J. Mulder, J. de Boer, “Screening of lipophilic marine toxins in shellfish and algae: Development of a library using liquid chromatography coupled to orbitrap mass spectrometry,” Analytica Chimica Acta, 2011, doi:10.1016/j.aca.2010.11.036.
- J.E. Milley, S.S. Batesf, C.J. Bird, A.S.W. De Freitas, M.A. Quilliamt, “Trace determination of domoic acid in seawater and phytoplankton by high-performance liquid chromatography of the fluorenylmethoxycarbonyl (fmoc) derivative,” International Journal of Environmental Analytical Chemistry, 1990, doi:10.1080/03067319008026940.
- J. Fehling, K. Davidson, C.J. Bolch, S.S. Bates, “Growth and domoic acid production by Pseudo-nitzschia seriata (Bacillariophyceae) under phosphate and silicate limitation,” Journal of Phycology, 2004, doi:10.1111/j.1529-8817.2004.03213.x.
- C.K. Cusack, S.S. Bates, M.A. Quilliam, J.W. Patching, R. Raine, “Confirmation of domoic acid production by Pseudo-nitzschia australis (Bacillariophyceae) isolated from Irish waters,” Journal of Phycology, 2002, doi:10.1046/j.1529-8817.2002.01054.x.
- S. Besiktepe, L. Ryabushko, D. Ediger, D. Yilmaz, A. Zenginer, V. Ryabushko, R. Lee, “Domoic acid production by Pseudo-nitzschia calliantha Lundholm, Moestrup et Hasle (bacillariophyta) isolated from the Black Sea,” Harmful Algae, 2008, doi:10.1016/j.hal.2007.09.004.
- S.B. Hooker, C.R. McClain, The calibration and validation of SeaWiFS data, Progress in Oceanography, 2000, doi:10.1016/S0079-6611(00)00012-4.
- E. O’Connell, W.B. Lyons, C. Sheridan, E. Lewis, “Development of a fibre optic sensor for the detection of harmful algae bloom and in particular domoic acid,” in Conference Record – IEEE Instrumentation and Measurement Technology Conference, 2007, doi:10.1109/imtc.2007.379024.
- A.R. Bratcher, L.B. Connell, P. Millard, “Portable biosensor detection of the harmful dinoflagellate Alexandrium using surface plasmon resonance and peptide nucleic acid probes,” in OCEANS’11 – MTS/IEEE Kona, Program Book, 2011, doi:10.23919/oceans.2011.6107116.
- P.E. Nielsen, M. Egholm, O. Buchardt, “Peptide Nucleic Acid (PNA). A DNA Mimic with a Peptide Backbone,” Bioconjugate Chemistry, 1994, doi:10.1021/bc00025a001.
- E. Kretschmann, “Die Bestimmung optischer Konstanten von Metallen durch Anregung von OberflächenplasmaschwingungenThe determination of the optical constants of metals by excitation of surface plasmons,” Zeitschrift Für Physik A Hadrons and Nuclei, 1971, doi:10.1007/bf01395428.
- S. Fujiyoshi, K. Yarimizu, Y. Miyashita, J. Rilling, J.J. Acuña, S. Ueki, G. Gajardo, O. Espinoza-González, L. Guzmán, M.A. Jorquera, S. Nagai, F. Maruyama, “Suitcase Lab: new, portable, and deployable equipment for rapid detection of specific harmful algae in Chilean coastal waters,” Environmental Science and Pollution Research, 2020, doi:10.1007/s11356-020-11567-5.
- B. Rijal Leblad, R. Amnhir, S. Reqia, F. Sitel, M. Daoudi, M. Marhraoui, M.K. Ouelad Abdellah, B. Veron, H. Er-Raioui, M. Laabir, “Seasonal variations of phytoplankton assemblages in relation to environmental factors in Mediterranean coastal waters of Morocco, a focus on HABs species,” Harmful Algae, 2020, doi:10.1016/j.hal.2020.101819.
- J. Melendez, R. Carr, D.U. Bartholomew, K. Kukanskis, J. Elkind, S. Yee, C. Furlong, R. Woodbury, “A commercial solution for surface plasmon sensing,” Sensors and Actuators, B: Chemical, 1996, doi:10.1016/S0925-4005(97)80057-3.
- H. Kawazumi, K.V. Gobi, K. Ogino, H. Maeda, N. Miura, “Compact surface plasmon resonance (SPR) immunosensor using multichannel for simultaneous detection of small molecule compounds,” in Sensors and Actuators, B: Chemical, 2005, doi:10.1016/j.snb.2004.11.069.
- A.N. Naimushin, S.D. Soelberg, D.U. Bartholomew, J.L. Elkind, C.E. Furlong, “A portable surface plasmon resonance (SPR) sensor system with temperature regulation,” Sensors and Actuators, B: Chemical, 2003, doi:10.1016/S0925-4005(03)00533-1.
- N. Díaz-Herrera, O. Esteban, M.C. Navarrete, M. Le Haitre, A. Gonzalez-Cano, “In situ salinity measurements in seawater with a fibre-optic probe,” Measurement Science and Technology, 2006, doi:10.1088/0957-0233/17/8/024.
- Y.C. Kim, J. Cramer, T. Battaglia, J.A. Jordan, S.N. Banerji, W. Peng, L.L. Kegel, K.S. Booksh, “Investigation of in Situ Surface Plasmon Resonance Spectroscopy for Environmental Monitoring in and around Deep-Sea Hydrothermal Vents,” Analytical Letters, 2013, doi:10.1080/00032719.2012.757701.
- M. Labrador, W. Hou, “Security mechanism for vehicle identification and transaction authentication in the Internet of Vehicle (IoV) scenario: A Blockchain based model,” Journal of Computer Science, 2019, doi:10.3844/jcssp.2019.249.257.
- M. Labrador, W. Hou, “Implementing blockchain technology in the Internet of Vehicle (IoV),” in Proceedings – 2019 International Conference on Intelligent Computing and Its Emerging Applications, ICEA 2019, 2019, doi:10.1109/ICEA.2019.8858311.
Citations by Dimensions
Citations by PlumX
Google Scholar
Scopus
Crossref Citations
No. of Downloads Per Month
No. of Downloads Per Country