Analysis of Gaze Time Spent at the Gazing Point that is Required During Reading
Volume 6, Issue 1, Page No 726-734, 2021
Author’s Name: Yusuke Nosakaa), Miho Shinohara, Kosuke Nomura, Takuya Sarugaku, Mitsuho Yamada
View Affiliations
Tokai University, Tokyo, 108-8619, Japan
a)Author to whom correspondence should be addressed. E-mail: yusuke_n@star.tokai-u.jp
Adv. Sci. Technol. Eng. Syst. J. 6(1), 726-734 (2021); ![]() DOI: 10.25046/aj060179
DOI: 10.25046/aj060179
Keywords: During reading, Lower limit of the gaze time

Export Citations
This paper aims to clarify the lower limit of the gaze time required during reading by investigating at a display time of 98 msec or less using the visual information processing analyzer developed in the previous research. The image display range and display time at the point of gaze was controlled by moving the window in conjunction with the eye movement. As a result, it was found that normal reading, as if there were no window or visual ?eld restriction, could not be performed with a display time of 42 msec or less, but that normal reading could be performed when sentences were displayed in a window of 7 characters at 56 msec. In this way, we believe we can obtain useful knowledge that is necessary for studying more e?ective methods of displaying text on electronic device.
Received: 14 October 2020, Accepted: 19 January 2021, Published Online: 05 February 2021
1.Introduction
In recent years, information terminals such as smartphones and tablet terminals have been driving the spread of e-books. Before the popularization of smartphones and the like, many terminals exclusively for electronic books (e-books) were produced by various manufacturers, but since the introduction of the Apple iPhone in 2007, the use of e-books on smartphones rather than dedicated terminals has become mainstream. Not only does this make books highly portable, but books of various genres are also easily available online, making them more accessible.
Regarding research on electronic books, evaluations of the hardware include assessments of the size, weight, and resolution of the terminal on which the reading material is displayed, and the possibility of e-books replacing paper media has also been examined [1]-[3]. In addition, it has been reported that text on an electric display provides the same reading experience as text printed on paper if it is displayed at a high resolution [4]-[6]. Nevertheless, differences in reading between a display and paper, and differences in reading due to differences in display performance and operation have also been reported [7]-[9].
We have been studying e-books and traditional paper books, focusing on the differences in eye movements during reading. In particular, in the case of a paper book, the reader often gazes at the various places on the paper while turning a page and the reader’s eye movements depend on how the page is turned. On the other hand, with an e-book, the reader’s gaze moves linearly from the end of the sentence of the previous page to the beginning of the next page [10]. By developing research on visual information processing with such eye movements, we will be able to develop a new display method for e-books that incorporates the characteristics of visual information that make it most easily absorbed by readers.
Human eye movements include saccade (intermittent and rapid step-like movement), smooth pursuit movement (smooth movement that occurs when following a moving object), and miniature eye movement (miniature involuntary movement that occurs when gazing at one point) [11]. The eye movement that occurs during reading is not a smooth pursuit eye movement that moves smoothly over the letters, but a repetition of a fixation, which is composed of miniature eye movements and occurs at a gazing point, and a saccade, which skips between fixation points. In addition to moving in the direction of sentence progression when reading, there is also a return movement, called regression, that moves in the opposite direction.
Research on eye movement during reading has a long history of more than a century, and many different researchers have reported useful results using various measurement methods.
In 1878, Javal, who observed and recorded eye movements reflected in a mirror, first reported that reading eye movements are repeated saccades and fixations [12]. Later measurement following Huey’s method using an equipment like a contact lens made of a thin hardened layer of gypsum powder and a kymograph found that the number of fixations per line was 4 to 5 when the viewing distance was 33 to 42cm, and that that number did not change even if the size of the characters was changed or the viewing distance was doubled; fixation duration likewise remained steady at about 200 msec. Furthermore, it has been reported that the average size of saccades is 3° to 4° [13]-[15]. Regarding fixation duration, Dearborn reports durations of 100 to 500 msec, with most falling between 200 and 300 msec [16]. Results for saccade and fixation similar to those in Huey’s report have been found for reading in Japanese. It was reported that 2 to 8 characters are grasped observed in a single fixation and that the size of the saccade is also 2 to 8 characters [17], [18]. In addition, differences in the reading direction of sentences are being examined, and there have been many reports on eye movements during vertical and horizontal writing. Ohtomo reports that there was no difference in direction based on reading experiments of on vertical and horizontal writing in kanji and hiragana, kanji and katakana, hiragana, katakana, and romaji [19], [20]. Additionally, one report for a large influence of reading experience [21]. Although these studies were carried out early in the study of eye movements during reading, their results are still considered to be useful.
After the early research of the 1930s, the analysis of eye movements during reading received particular attention during the period from 1970 to 1980 with the development of computers and eye movement measurement devices. Past research on the perceptual range (effective visual field) during reading and the recognition of characters within the gazing point are considered to be highly compatible with e-books that can change display information in real time. In other research [2], a visual information processing analyzer that can control the image display range and display time at the point of gaze was also developed with reference to those eye movement studies. Furthermore, in experiments using this developed experimental device, it was reported that normal reading without restriction of the visual field can be performed by displaying images for 98 msec during gazing.
Therefore, this paper aims to clarify the lower limit of the gaze time required during reading by investigating at a display time of 98 msec or less using the visual information processing analyzer developed in the previous research. In this way, we believe we can obtain useful knowledge that is necessary for studying more effective methods of displaying text on electric device.
In this paper, previous research plays a major role. Therefore, Chapter 2 summarizes two similar studies on the perceptual range (effective field of view) that had significant effects on the previous study [22], and Chapter 3 describes the analyzers developed in the previous study and an experiment involving an image display time of 98 msec in detail. Chapter 3 indicates the approach of this research, Chapter 5 describes the method and results of this experiment, and Chapter 5 describes the conclusions and future developments.
2. Related Works
Since all parts of the visual field are not equally visible, it is thought that the amount of information processed is different if two locations in the field of view where information is presented are different. When performing various visual tasks, the part of the visual field from which information that is necessary for the tasks can be obtained is called the effective field of view. In this paper, “visual task” refers to reading.
There are various methods for investigating the effective visual field, including instantly presenting a character string or word using a tachistoscope (instantaneous presentation device) and estimating the readable range. Another method is that the number of characters viewed at a gazing point was estimated based on the record of eye movements in one line. All of these methods are based on estimation, and the departure from estimation is a method called windowing. The window is the area on the screen where the image is displayed. This method investigates the effective visual field by moving the window in conjunction with eye movement and changing the display information in the window during a period called saccadic suppression, in which the function of visual information processing in the brain decreases. If this window is smaller than the effective field of view, the reading time will be longer because less than the maximum amount of information will be obtained. Conversely, if the window is larger than the effective field of view, it will not be useful for reading, so the reading time becomes constant.
Research using the window method began with experiments by [23] and by [11], [24], [25]. The research by [22] solved the problems in these studies by developing a new analyzer. This section describes two studies of Saida and Ikeda and McConkie and Rayner and introduces the issues raised by Kushima and describes in detail the equipment developed by Kushima used in this study.
First, we explain the experiments of Saida and Ikeda. An image of the experimental equipment is shown in Figure 1. The subject’s eye movements were acquired by the Limbus tracking method (a method of irradiating non-visible light such as near infrared rays to the black and white eye regions and calculating the difference of the reflected light). The acquired X-Y position information of the eye is input to the oscilloscope, and a rectangle is displayed at that position. Two TV cameras are prepared, the oscilloscope video is shot with TV camera 1, and a board with written text is shot with TV camera 2. The image of the rectangle shown on TV camera 2 is switched by the video switcher to the image on TV camera 1 using the wipe process. In this way, the displayed rectangular area, which is linked to eye movement, display the written text of the specified window width. The results of this experiment showed that if the size of the window exceeds 13 characters, it is possible for a viewer to read it as well as they would normally read without a window.
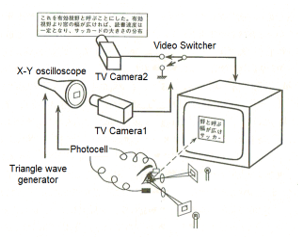 Figure 1: Experimental equipment by Saida and Ikeda [26]
Kushima point out the following issues regarding this experiment.
- In their experiment, a rectangle was displayed on the oscilloscope directly with the eye movement being the output, and the gaze area was not switched after the gazing point was detected.
- Since a camera and cathode ray tube (CRT) display were used at that time, it is expected that there would have been afterglow and an afterimage, but there was no description of this.
- Since the window moves in conjunction with eye movement, the display time of the window is considered to change depending on the gazing time, so the display time was not controlled.
On the other hand, in McConkie and Rayner’s experiment the display (DEC Model 340) with built in uppercase and lowercase characters was controlled by inputting the eye movement acquired by the Limbus tracking method to a PDP-6 minicomputer. Since a character incorporated display was used, not only the masking of the gaze area, but also six patterns in which the characters in the window were replaced with X, x, characters with similar shapes, etc., were tested. The results of this experiment showed that the effective visual field was 13 characters, similar to the experiments of Saida and Ikeda. The following issues were raised in this experiment.
- Afterglow was only described as short afterglow, and it is not possible to determine how much afterglow or afterimage remained after switching.
- The saccade was not detected. If the eye movement exceeded a certain distance from the left edge of the sentence, the image in the window was switched, so the window was not displayed in the gaze area.
- There was no description of the display time of the characters in the window.
3. Research
An analyzer that overcomes the issues introduced in the previous chapter was developed in a previous study [22].
3.1. Overview of the developed analyzer used in this study
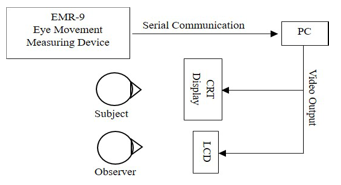 Figure 2: System configuration diagram
Table 1 shows the equipment used, Figure 2 shows the configuration diagram, and Figure 3 shows the flowchart.
Table 1: Experimental apparatus
| Eye Movement Measuring Device | EMR-9 EYEMARK RECORDER (NAC Imaging Technology) |
| Sampling Rate | 60Hz (serial communication), 120Hz, 240Hz |
| Resolution | 0.1[degree] |
| Data Processing PC | OS Windows 7 Professional, Memory 32 GB, CPU core i7 3770 |
| CRT Display | IIyama HM204A |
The video output of the analyzer consists of a liquid crystal display for the experimenter and a CRT display (Figure 4; afterglow of 1 msec or less) for the subject. Liquid crystal displays are not used as displays for subjects because afterimages remain longer in the window after images are switched compared to CRT displays. The subject’s CRT display shows only text, and the experimenter’s LCD displays the EMR-9 (Figure 5) visual field camera image, allowing the subject’s gazing point and text to be displayed. The system executes two threads in parallel. One thread acquires the position of the rectangle displayed on the CRT from the image of the EMR-9 field of view camera, and the other thread (on the left in Figure 3) obtains eye movement data from the EMR-9 by serial communication. Since the position of the rectangle shown on the CRT display is always obtained, head movement can be detected from the movement of the rectangle, and so the experiment can be performed in a natural posture without fixing the head. The saccade is detected by calculating the gazing point position, moving speed, rotation angle of eye movement, and
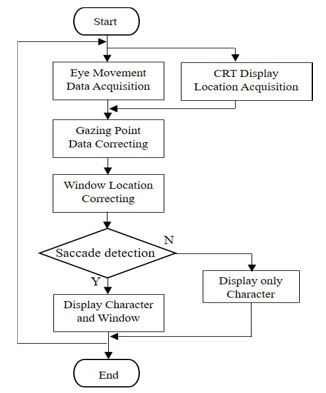 Figure 3: Flow chart
angular acceleration from the acquired eye movement data. When a saccade is detected, a window image is presented on the gazing point of the CRT display (Figure 3, left). When no saccade is detected, only the first three characters of each line are displayed. It was initially thought that it would be sufficient to display only the line that the subject is reading, but the subject does not always look at the center of the sentence. Since the size of the fovea, which has high visual acuity, is about 1°, the subject can read normally even if his or her gazing point deviates from the center of the character by ±1°. Since the center of the window is set at the center of the gazing point, in the case of horizontal writing the characters remain displayed in the window even if it shifts horizontally. However, if the window shifts vertically, part of each character may not be displayed inside the window when only one line is displayed. Furthermore, considering the accuracy of the EMR-9 (±0.1°), the upper and lower sentences were also displayed, so the size of the window was 3 lines in the vertical direction, and the
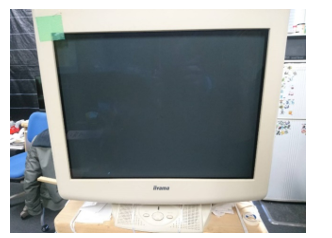 Figure 4: CRT display
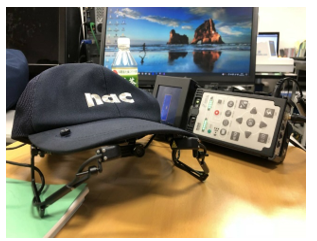 Figure 5: Eye movement analyzer
number of characters in the horizontal direction was changed as a parameter.
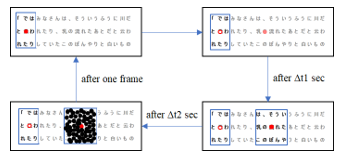 Figure 6: Example of screen change seen by the subject
Figure 6 shows an example of the change in the screen seen by the subject during the experiment. In Figure 6, the red filled circle represents the present gazing point (the red open circle represents the previous gazing point), and the blue frame shows the area displayed to the subject. When the gazing point moves and the termination of saccade is detected, a window image is displayed Δ?1 seconds after the detection as shown in the lower right of Figure 6. The displayed window image is the text extracted from the sentence based on the size of the window. After the window image is displayed for Δ?2 seconds, the masking image is displayed for one frame in the area where the window image was displayed. This process is repeated until the subject finishes reading, and the experimenter performs experiments by arbitrarily changing the values of Δ?1 and Δ?2. Kushima. measured eye movements during fixation to fixation movement imitating eye movements during reading, and suggest that eye movement speed (42 degrees/sec) is most appropriate for detecting the start and end of saccades as the threshold [22]. Therefore, eye movement velocity (42 degrees/sec) was used as the threshold value in the present study.
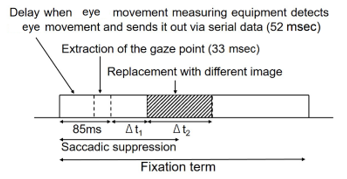 Figure 7: Time flow of processing
Since the retinal image is greatly blurred during the saccade, the perceptual function is reduced before and after the saccade so that the blurred image is not perceived. This phenomenon is called saccadic suppression [26]. The switching of the displayed image in the window must be performed within the period of saccadic suppression. Figure 7 shows the temporal ow of the processing. From Figure 7, it can be seen that there is a delay of 52 msec when the eye movement measurement device sends out the eye movement data by serial communication, and it takes about 2/60 sec (about 33 msec) to extract the gazing point; thus, it takes about 85 msec to detect the termination of a saccade. This means that the gazing period starts from 52 to 85 msec before the gaze point is extracted, and therefore the “fixation term” includes this period, as shown in Figure 7. Saccadic suppression continues after the saccade ends. The decrease in the detection rate due to the saccadic suppression recovers to 60% about 100 msec after the saccade, and to almost 100% in about 200 msec [27]. Considering this and the detection time of the saccade, Δ1 and Δ2 are varied.
As described above, it is necessary to control the image replacement time of the gazing area in msec units. At a typical display refresh rate of 60 Hz, for example, drawing is performed approximately every 16.7 msec, so a delay of up to 16.7 msec is expected. In addition, if image switching of the gazing area occurs after the display is drawn, there is a possibility that image switching of gazing area does not occur on the display. To prevent this phenomenon, Kushima. implemented a vertical synchronization function to synchronize display drawing and program drawing.
Table 2 shows the differences between past research and research using the equipment developed by Kushima. First, in research by Saida and Ikeda, because the eye movement data are directly input into the oscilloscope and the rectangle is displayed, the window is not always displayed in the gazing area. However, since the gazing point is always acquired, a window can be displayed at the gazing point by the system developed by Kushima. Second, the study by Saida and Ikeda suggests that afterglow and an afterimage occurred because a camera and cathode ray tube (CRT) display were used together and, while McConkie and Rayner describe the afterglow as “short,” they do not state how many characters remained when switching images. Under the system developed by Kushima, afterimages do not remain after image switching, and technological advances have reduced the afterglow time of CRT displays to less than 1 ms. Third, in the Saida and Ikeda’s study, window display time was not controlled, and in McConkie and Rayner’s research, since the gazing point is not detected, the image cannot be replaced for a certain period within the gazing time. However, since the gazing point is always acquired, the image can be switched within the gazing time, and the switching period can be controlled accurately by implementing the vertical synchronization function used in the system developed by Kushima. Finally, because the gazing point is not detected, the image is switched in McConkie and Rayner’s study according to the distance of the eye movement from the edge of the screen. In contrast, under the system developed by Kushima, the gazing point is always acquired, saccade detection is performed, and then the image is switched.
Here, we describe the experiments performed by Kushima in a previous study [2]. The subject in this experiment was a 21-year-old student. The experiment consisted of a training session and two main sessions. In the training session, the window width was changed from 17 characters to 3 characters at 2-character intervals for practice, and in the main session the window width was changed from 3 characters to 17 characters and from 17 characters to 3 characters. These experimental methods were based on the experiments of Saida and Ikeda, who conducted experiments using Japanese text. In the experiment, since the refresh rate of the CRT display was set to 72 Hz, image switching could be performed every 13.9 msec. Therefore, the experiment was performed with Δ1 set to 14 msec and Δ2 set to 98 msec.
Figure 8 shows the subjects’ average reading time in the two main sessions. The horizontal axis in Figure 8 shows the window width, and the vertical axis shows the reading time(s). As shown in Figure 8, the reading time was greatly reduced between window widths of 3 and 5 characters, and the reading time did not change significantly when the window width was larger than 9 characters. Experiments by Saida and Ikeda showed that normal reading was possible when the window width was larger than 13 characters. As mentioned in the previous section, it was reported that the experiment by Kushima. showed the same tendency as the experiment by Saida, considering that the first three letters of each line were always displayed during Kushima’ s experiment.
Table 2: Differences between past research issues and the equipment developed by Kushima
| Issues in the research of Saida and Ikeda | Changes with the system developed by Kushima. |
| Because the eye movement data are directly input to the oscilloscope and the rectangle is displayed, the window is not always displayed in the gazing area. | Since the gazing point is always acquired, a window can be displayed at the gazing point. |
| It is thought that afterglow and an afterimage occurred because a camera and CRT display were used at that time. | Afterimages do not remain after image switching, and technological advances have reduced the afterglow time of CRT displays to less than 1 msec. |
| Window display time is not controlled. | Switching at the speed of the refresh rate of the CRT display is possible by implementing vertical synchronization function. |
| Issues in the research of McConkie and Rayner | Changes with the system developed by Kushima. |
| Description of the afterglow as “short” does not indicate how many characters were actually left when switching. | There is no afterimage when switching the display. |
| Since the gazing point is not detected, the image cannot be replaced for a certain period within the gazing time. | Since the gazing point is always acquired, the image can be switched within the gazing time, and the switching period can be controlled by implementing the vertical synchronization function. |
| Because the gazing point is not detected, the image is switched according to the distance of the eye movement from the edge of the screen. | The gazing point is always acquired, saccade detection is performed, and then the image is switched. |
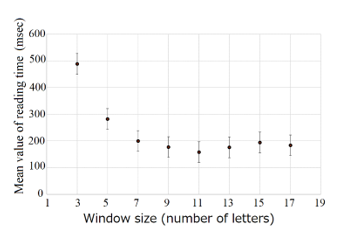 Figure 8: Average reading time [22]
4.The Approach of this research
In their research, only experiments with a display time of 98 msec were performed, and experiments with other display times were not performed. However, we think that reading is possible even with a shorter display time. Therefore, in this experiment, we decided to investigate the lower limit threshold of the gaze time that was necessary for reading by performing a similar experiment with a display time of 98 msec or less. The past research did not involve control of image switching time and display time, which are features of this device. Therefore, the approach in this paper is very novel, and we believe that it can show new possibilities for visual information processing during reading. In addition, since the experimental method was complicated and difficult, the authors deliberately described past research and Kushima’ s research and clarified the position and purpose of the present research.
5. Experiments with variable window display time
5.1. Experimental method
An experiment was conducted to investigate the reading time at six different display times. The experimental method was based on the experiment of Kushima. In this experiment, it is necessary to align the literacy levels of the subjects and select the subjects who can acquire eye movements with high accuracy in advance. The measurement accuracy of the eye movement measuring device depends on the characteristics of the subject’s eye, in addition to careful pre-calibration. That is, in order to maintain the accuracy of eye movement measurement at the character size level from the start to the end of the experiment, it is important to select the subject in addition to careful pre-calibration. Therefore, in a preliminary experiment conducted in advance, eight subjects aged 21 to 23 years (male) were selected from among many candidate subjects.
The experimental procedure consisted of a main session and two training sessions. The window width consisted of 8 images in the training session, and each window changed from 3 to 17 at 2-character intervals. Also, in the main session, 8 images were presented, and the characters were changed from 3 characters to 17 characters (up) and from 17 characters to 3 characters (down). The analysis was performed by averaging the reading times of the up series and down series measured in the main session for each window width. The displayed images are excerpts from three novels from the copyright-free Aozora library: “Night on the Galactic Railway, “I Am a Cat,” and “Bochan.” As an example of the display image, “Night on the Galactic Railway,” which was used in the training session, is shown in Figure 9. We used the early part of each novel to minimize any reading difficulty due to the content of the text. An example of the experimental environment is shown in Figure 10. The CRT display was placed at a viewing distance of 60 cm so that the subject’s dominant eye was at the center of the image. The subject placed an eye patch on his or her non-dominant eye and stabilized his or her head on a chin rest. Δ?1 was set at 14 msec, the same as in the previous study, and Δ?2 was varied among 84, 70, 56, 42, 28, and 14 msec, all of which were 98 msec or less. A total of six types of Δt2 × 8 different window sizes = 48 conditions. It is difficult to perform 48 experiments on a single subject with an eye patch on one eye. Therefore, we conducted experiments of 18 conditions per person so that reading times for 3 people could be obtained for each Δt2 and window size. We also experimented with combinations of subjects and sentences so that one subject did not read the same sentence multiple times. It has been found that the characteristics of saccades differ between reading with an emphasis on understanding sentences and reading with an emphasis on reading quickly [7]. In this experiment, in order to have the reader read in the former way, we informed the subjects before the experiment that they would perform a comprehension confirmation test after the experiment to align reading behavior among subjects.
5.2. Experimental result
Figure 11 shows a comparison of the average reading times measured for each display time. Here, the reading time was defined as the time from the start of reading to the end of reading. This comparison will clarify the display time that enables normal reading, and in the next step, additional subjects will be added to this display time for statistical examination. From Figure 11, it can be seen that the reading time is longer when the display time is shorter, and the reading time is shorter when the display time is longer. When the display time is 56 msec or more, the reading time does not change significantly when the window width is 7 characters or more, and when the display time is 42 msec or less, the reading time is longer than with the 56 msec display time, and the change in the reading time is large regardless of the window width expansion. In Kushima’ s experiments, the reading time did not change significantly when the window width was 9 characters or more, so the tendency was similar to that in Saida’s experiment. In the present experiment, the reading time converged when the display time was 56 msec or more and the window width was 7 characters or 9 characters or more, which is considered to be close to the tendency shown in Kushima’ s results. On the other hand, when the display time was 42 msec or less, the reading time tended to be extended or to fluctuate without depending on the enlargement of the window width. This suggests that reading cannot be performed normally with a display time of 42 msec or less. However, from Figure 11, it is not possible to determine exactly whether the starting point at which the reading time did not change was the window width of 7 characters or 9 characters. Regardless of the window width, the trend remains the same as in previous studies, but a detailed investigation will improve the novelty of this experiment.
5.3. Examination of the minimum required number of characters in the window and display time
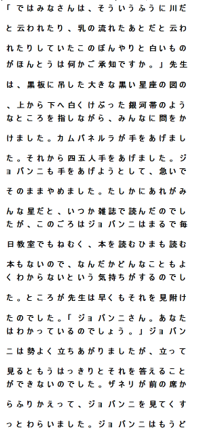 Figure 9: Example of display image (Night on the Galactic Railway
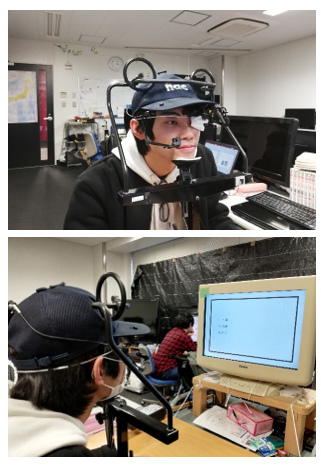 Figure 10: Example during experiment
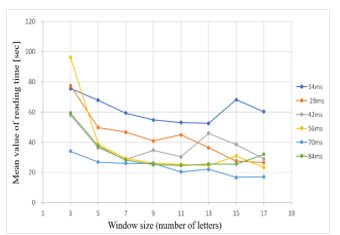 Figure 11: Comparison of average reading time at each display time
Further, experiment about a display time of 56 msec was performed with two new subjects, and a statistical study was performed on the data from all five sub jects. Here, based on the average reading time for a window width of 17 characters, we performed a t-test of the average reading times for other window widths at a significance level of 5%. Table 3 shows the results. The yellow cell in Table 3 is the p-value of the window width, which shows no significant difference from the average reading time of the 17-character window width. It shows that there is a significant difference between window widths of 3 characters and 5 characters, and it is clear that there is no significant difference when the window width is 7 characters or more. Comparing the p-values with those for window widths of 7 or more characters, it can be seen that there is a large difference between the 7-character and 9-character p-values, but they become almost constant at 9 or more
Table 3: Results of t-test of the average reading times for 17-character window width and other window widths (5%)
|
characters.
According to the above results, it was shown in this experiment that reading can be performed in the same time required for normal reading without a visual field restriction only by displaying text in a window of 7 characters with a display time of 56 msec. The reason for the difference between our results and those of previous research is that while the previous research used sample texts extracted from a third grade, elementary school textbook, the present research used a text extracted from the Aozora Bunko (copyright-free Aozora library). Both texts were composed of the same level of kanji, hiragana, and katakana, but it is possible that the present study had slightly fewer kanji. It is extremely difficult to match the ratio among hiragana, katakana and kanji as well as the difficulty of the kanji, but doing so will be necessary to improve the accuracy of the experiment.
6. Conclusion
In recent years, the number of people reading e-books on smartphones and tablet terminals has been increasing. A major feature of these information terminals is that they can turn pages instantly, unlike conventional paper books. It has already been shown that this causes a difference in eye movement between e-books and paper books.
In this study, we conduct research on visual information processing during reading, and we believe that it is possible to develop a more efficient and easier to see method of displaying information on such terminals. In previous research, we identified problems with the use of windows in researching effective visual fields and developed a new visual information processing analyzer that overcomes them. Furthermore, experiments using the developed device showed that normal reading without any restriction of view was possible if images were displayed for 98 msec with a window width of 9 characters.
In this paper, we extended our previous research, and while the previous research only involved experiments with a display time of 98 msec, here we investigated the minimum display time required for reading. In this study, 18 experiments were performed to increase the variation of the display time and to collect data for three persons for each of six display times of 98 msec or less. As a result, it was found that normal reading, as if there were no window or visual field restriction, could not be performed with a display time of 42 msec or less, but that normal reading could be performed when sentences were displayed in a window of 7 characters at 56 msec. Additional subjects were added and the 56 msec display time was tested further, and this finding was statistically confirmed.
Although our previous research used only on a 98 msec display time because the main focus of that study was device development, in this experiment we investigated the lower threshold of the gaze time required for reading by changing the display time. As mentioned in the experimental method, it is extremely difficult to select a subject who can maintain the accuracy of eye movement measurement at the character size level from the start to the end of the experiment, so this time we conducted an experiment using eight adult male subjects. We believe that advances in eye movement measuring devices will make it possible to acquire eye movements with greater accuracy with less dependence on the subject. We believe that it is necessary to further increase the number of subjects, add female subjects at the same time, and verify various age groups.
In the future, we would like to research visual information processing from additional angles, such as changing the composition ratio of hiragana, katakana, and kanji, the difficulty of the kanji, the length of the sentences, and the size of the characters. Furthermore, we think that this research not only proposes a display method on an electronic device, but also psychophysically can clarifies what kind of processing is performed in the brain and how long it takes for reading and character processing. We would like to develop it as an effective means to clarify information processing in the human brain in a non-invasive manner.
Acknowledgment
In pursuing this research, Mr. Takahide Ohtomo, a master’s student in our laboratory, consulted on various questions related to the experiment, and provided a great deal of knowledge and suggestions. Mr. Tsuyoshi Kushima, a graduate of this laboratory and a master’s student at the University of Electro Communications, and kindly provided instruction on how to use the experimental equipment. We thank everyone who cooperated as subjects.
- H. Yaguchi: “A Study of e-book as Mobile Media,” Japan Society of Publishing Studies, 40, 45-62, 2009, doi : 10.24756/jshuppan.40.0_45.
- H. Yaguchi: “Conditions for the spread of e-book readers,” Japan Printer, 93, 11, 33-39, 2010-11-15.
- H. Shibata, Kentaro Takano, Kengo Omura: “Can electric reading devices replace paper,“ Fuji Xerox Technical Report, 21, 98-109, 2012. in Japanese
- A. Dillon: “Reading from paper versus screens: a critical review of the empirical literature,” Ergonomics, 35, 10, 1297-1326, 1992, doi : 10.1080/00140139208967394.
- J. D. Gould, L. Alfaro, V. Barnes, R. Finn, B. Haupt, and A. Minuto: “Reading from CRT displays can be as fast as reading from paper,” Human Factors, 29, 5, 497-517, 1987, doi : 10.1177/001872088702900501.
- J. D. Gould, L. Alfaro, R. Finn, B. Haupt, and A. Minuto: “Why reading was slower from CRT displays than from paper,” Proc. of CHI ’87, 7-11, 1987, doi : 10.1177/001872088702900501.
- P. Muter, and P. Maurutto: “Reading and skimming from computer screens and books: The paperless office revisited,” Behaviour and Information Technology, 10, 4, 257-266, 1991, doi : 10.1080/01449299108924288.
- E. Wastlund, T. Norlandera, and T. Archerb: “The effect of page layout on mental workload: A dual-task experiment,” Computers in human behavior, 24, 3, 1229-1245, 2008, doi : 10.1016/j.chb.2007.05.001.
- A. Dillon, J. Richardson, and C. McKnight: “The effect of display size and text splitting on reading lengthy text from screen,” Behaviour and Information Technology, 9, 3, 215-227, 1990, doi : 10.1080/01449299008924238.
- H.Takahira, R.Ishikawa, K.Kikuchi, T.Shinkawa, M.Yamada: ”Analysis of Gaze Movement while Reading E-Books,” IEICE Transactions on Fundamentals of Electronics, Communications and Computer Sciences, E97-A, 2, 530-533, 2014, doi : 10.1587/transfun.E97.A.530.
- G.W.McConkie, K.Rayner: ”The span of the e?ective stimulus during a ?xation in reading,” Perception and Psychophysics, 17, 6, 578-586, 1975, doi : 10.3758/BF03203972.
- E. Kowler: “Eye movements: The past 25 years,” Vision Research, 51, 13, 1457–1483, 2011, doi : 10.1016/j.visres.2010.12.014.
- K. E. Javal: “Essai sur la physiologic de la lecture, Annales d’oculistique,” 79, 97-117, 240-274, 80, 135-147, 1878.
- E. B. Huey: “On the Psychology and Physiology of reading I,” The American Journal of Psychology, 11, 3, 283-302, 1900, doi : 10.2307/1412745.
- E. B. Huey: “On the Psychology and Physiology of reading II,” The American Journal of Psychology, 12, 3, 292-312, 1901, doi : 10.2307/1412280.
- E. B. Huey: “The psychology and pedagogy of reading,” Macmillan, New York, 1908.
- W. F. Dearborn: “The psychology of reading,” Columbia University Contributions to Philosophy and Psychology, 14, 1, 1906.
- Kokishi Tanaka: “Basic research on language and reading,” Meguro Shoten, Tokyo, 1916. in Japanese
- Chozo Matsuo: “Psychological Study of Reading,” Psychological Series Vol.12, Shinrigaku Kenkyukai, Tokyo, 1919.
- S. Ohtomo: “Educational science issues,” Toyo Tosho, Tokyo, 1927.
- S. Ohtomo: “Educational Science Principles,” Toyo Tosho, Tokyo, 1933.
- Tsuyoshi KUSHIMA, Miyuki SUGANUMA, Shinya MOCHIDUKI,and Mitsuho YAMADA: ”Development of a Novel Accurate Analysis System Regarding Information Processing Within the Gazing Point,” IEICE Transactions on Fundamentals of Electronics, Communications and Computer Sciences, E102-A, 9, 1205-1216, 2019, doi : 10.1587/transfun.E102.A.1205.
- S. Masaya, Mitsuo IKEDA: “Sentence interpretation with limited ?eld of view,” Clinical ophthalmology, 29, 8, 923-925, 1975, .
- K.Rayner: ”The perceptual span and peripheral cues in reading,” Cognitive Psychology, 7, 1, 65-81, 1975, doi : 10.1016/0010-0285(75)90005-5.
- K.Rayner: ”Parafoveal identi?cation during a ?xation in reading,” Acta Psychological, 39, 4, 271-282, 1975, doi : 10.1016/0001-6918(75)90011-6.
- O. Ryoji, Yukio NAKAMIZO, Kazuo KOGA: “Experimental psychology of eye movement,” Nagoya University Press, 1993.
- F.C. Volkmann, Shick,A.M. Riggs,L.A.: “Time course of visual inhibition during voluntary saccades,” Journal of the Optical Society of America, 58, 4, 562-569, 1968, doi : 10.1364/JOSA.58.000562.
Citations by Dimensions
Citations by PlumX
Google Scholar
Scopus
Crossref Citations
No. of Downloads Per Month
No. of Downloads Per Country