An Enhanced Artificial Intelligence-Based Approach Applied to Vehicular Traffic Signs Detection and Road Safety Enhancement
 , Abderrahim Bajit 1, Taoufiq El Harrouti 2, Ahmed Tamtaoui 3, Mohammed Benbrahim 1
Adv. Sci. Technol. Eng. Syst. J. 6(1), 672–683 (2021);
 DOI: 10.25046/aj060173
The paper treats a problem for detection and recognition objects in computer vision sector, where researchers recommended OpenCV software and development tool, it’s several and better-remembered library resource for isolating, detecting, and recognition of particular objects, what we would find an appropriate system for detecting and recognition traffic roads signs. The robustness with optimization is a necessary element in the computer vision algorithms, we can find a very large number of technics in object detection, for example, shapes transformation, color selection, a region of interest ROI, and edge detection, combined all these technics to reach high precision in animated video or still image processing. The system we are trying to develop, is in high demand in the automotive sector such as intelligent vehicles or autonomous driving assist systems ADAS, based on intelligent recognition, applying Artificial Intelligence, by using Deep Learning, exactly Convolutional Neural Network (CNN) architecture, our system improves the high accuracy of detection and recognition of traffic road signs with lower loss.
1.Introduction
Computer vision belongs to a large family of Artificial Intelligence-based systems, more precisely, it is to AI what eyes are to humans, an extremely powerful tool capable of analyzing, recognizing an image pattern, and even analyzing several images simultaneously, in other words, a video stream. To achieve this, computer vision relies on different technologies, firstly image processing, which applies operations and algorithms directly on the image, and secondly Deep Learning through neural networks using a large amount of data. In the automotive world, Industry 4.0 [1] has already chosen its IoT camp, the automotive groups have announced that their autonomous vehicles will embed an onboard camera, and not only electronic sensors, aiming to reduce a maximum accident’s risk and also helping the driver to safely control his car to avoid dangers. The re-manufacturing sector has also already started to conquer computer vision, the major objective of the automotive industry, is to make non-polluting vehicles, e.g. electric or hybrid vehicles, to integrate intelligent options [2], to make vehicles easier, to move in and out of the city area, with road safety for both cars, users, and pedestrians. The procedure that we are going to follow in our system development, that integrates a series of automotive embedded systems, among the most famous of these systems, is the ADAS system that has accelerated the vehicle sector and improved its features, which has made the semi-automatic vehicles, to facilitate the tasks of conduction and avoid all possible dangers [3]. The human being is based essentially on his eyes, to make a description and a global analysis of his environment, because this description will allow him to manage these reactions, that he has to make either in the present or the future. Therefore, the equivalence of this behavior enters the field of computer vision or robotics, where it is called object detection [4, 5], which in our case are the traffic road signs, that help traffic management. Every year, researchers offer us a new advanced, highly precise technology, and slightly object detection error injection. Our traffic road signs system detection [5], which is based on the colors of the environment description, to detect the desired specific colors of the specified objects.
The fact of making this description, therefore, required a test its effectiveness, based on onboard vehicle cameras, and then to integrate it into the developed algorithm. So detecting the colors of traffic roads signs with accuracy, is the necessary factor, so that we can recommend the approach, that can be applied in the future or improved, and applied to Industry 4.0 [6], but we’re not going to stop only on the colors [7], we’re also going to base it on the geometry of the traffic roads signs, to reduce detection errors. The general procedure of our system, is based on human characteristics, that it can easily detect objects, and avoids encountering difficulties due to light reflection. The performance will increase, if we have combined the colors and geometries of the traffic road signs, which will conduct us to reach an interesting and robust algorithm [8]. In computer vision and image processing, the detection or recognition of specific objects in movements, in unknown or a known environment, is commonly elaborate by different researches studies every year, the most technique based on the invariance properties of the interest objects, it can be the appearance of the objects, the geometry of the scene or objects, photometry or color, for example, space-time constraints.
Video is a media that poses complex problems, because of the large data volume to be processed, with the difficulty of extracting the representative information from its content. At present, indexing the content of images, and dividing the video into elementary unit shots, representative images only partially meets this growing need. But, the content of an image is often too rich in itself, and contains several objects of interest, i.e. semantic objects. When a target is located in a video frame, it is often useful to follow this object in the following images, each image target successfully tracked, can provide a lot of information or feature, about its activity with the identity, the visual characteristics most using are colors. Usually, the RGB represents color space, but this space doesn’t a uniform perceptual, because the differences calculating between colors in this space by machines, do not correspond to the difference perceived by humans, besides, the RGB dimensions are highly correlated. But the HSV is an approximately uniform color space [9], with a high degree of sensitivity to the noise, for example, can be used to extract a characteristic for histogram-based appearance, for detected the contour-based edges of all or specific objects; that existed in images, in general, many tracking algorithms in real-time uses and recommend this space.
Object recognition is an important topic in computer vision, it has a huge evolution during these years, combined with Artificial Intelligence, which has been finalized by the appearance of Deep Learning [10], Deep Learning has touched different areas, such as automotive, robotics, industry. In computer vision, object recognition or object classification is a method for identifying the presence of an instance, or a class of objects in a digital image, for example, the application face detection and the detection of persons [11]. These methods often involve supervised learning, and have applications in multiple fields, such as, Biometric recognition using biometric technology, Surveillance, Industrial inspection, Robotics, Medical analysis, our case is applied for Intelligent Vehicle Systems, which are necessary for recognize and tracking the traffic road signs, as well as autonomous vehicle [12].
- Methodology
The strategy is to develop a homogeneous system for detection and recognize traffic road signs, the system combines three essential parts, the first, detection of traffic road signs by methods that are proposed, and well described later on. Secondly, when the sign detected, strongly is going to be cropped with dimensions defined in real-time, finally, the last phase, is the recognition of the traffic road using Artificial Intelligence, establishment an architecture has the same concept of the human being analyzes with his brain, for classification or recognize the correct place different objects in the environment.
The paper organized as follows; section 1 contains an introduction to the essential for detection and recognition. Section 2 presents a system diagram, then section 3 describes the detection approach. Section 4, related work for different work of detection and our proposed approach, section 5 and section 6 for the discussion and implementation in real-time. Section 7 with section 8, to recognize road signs by deep learning and evaluation the performance of the system proposed.
 Figure 1: Traffic road signs detection and recognition System diagram
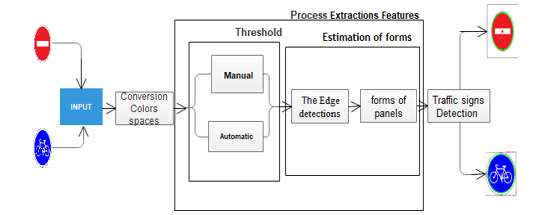 Figure 2: Traffic road sings detection diagram [5]
3. Road Signs Detection
In the figure. 2, the system tries to determine which road signs have a circular shape and specific colors.
The colors of the traffic road signs, are unique in the whole world, fixing the relevant colors or those that represent the majority, are blue and red. The second part, which is based essentially on the detection of the geometries of the traffic roads signs, which are also by default unique, can find either the geometry: rectangular, circular, triangular, and square, therefore for our study, based the circular, because it a percentage of 50% of the traffic roads signs, and at the same time contains the colors, to achieve our objective, it must to a play on the elements, that characterize the circular form, so the circle is described mathematically, by center position and radius.
4. Related Work
The paper has the main objective, to implement an application aiming to detect and recognize traffic signs in real-time, most of the techniques use the color detection presented in this paper [13], or based only on the shapes of signs treated in this paper [14], our approach combined between colors and shapes of traffic road signs, by applying the Canny matrix transformation. This approach uses the OpenCV library, because integrated powerful functions, to properly detect the edges in the image. Before the process detects shapes of signs, following sub-steps, firstly, the conversion input image from the RGB space to the HSV space for segmentation. secondly, applying the Gaussian smoothing filter, to minimize false detection results, as the color-based one just isolates red and blue colors of interest.
4.1. Color detection
The image can be represented by function G (X, Y), the X and Y are the spatial coordinates for two-dimension, besides this, the amplitude at any point G (X, Y) corresponding in general to gray level or mostly to intensity, and when the amplitude is discretized, the image is categorized to a digital image. The digital image also referred to as a scene, has a marker as an indication, each frame or image different from other mathematically, based mainly on its height (H) and width (W).
In image processing has several descriptions of images, for simplicity, can be a binary image, a rectangular matrix contains these values, 0 represented the blacks, or 1 represented the whites. Also, can be a grayscale image, the total number of pixels is 256, distributed from 0 (black) to 255 (white), these values means that each pixel encoded on 8 bits, grayscales are very powerful for recognition or detection of the most objects in a complexed scene [15]. Finally, the color image has 3 color channels, described respectively in this order by pixels number of red (R), green (G), and blue (B), it’s coded or ranging between 0 and 255, which results in 2553=16,777,216 possible colors, that it takes 24 bits to code a pixel. In the general hierarchy of video data present in a sequence, which means that contents one or more images groups, and ends with an end-of-sequence code, this grouping of one or more images facilitating direct access, thus, the image is the elementary unit for coding the video sequence [16].
As shown in figure 2, the first step based on color detection, to have a system capable of detecting; the colors of road signs with high accuracy, our approach proposes the conversion from RGB to HSV space, this conversion is essentially, based on the equations above [5], the first one is used to normalize each color channel, which makes the interval ordered [0,255] to [0,1], to calculate delta, Cmin and Cmax [17].
 The HSV space is considered to be a natural representation model, which means has the same physiological color perception seeing by the eye of a human, in generally decomposing the colors consists of physiological criteria. This space decomposes the color, according to more intuitive characteristics close, to the current vocabulary to describe a color, based on pure color. Finally, these equations above serve to complete the conversion, to determine each channel: Hue, Saturation, and Value [5].
- The Hue Channel (H), corresponding to the perception of color:
 The Saturation Channel (S), describing the color purity, which can be bright or dull:
 The Value Channel (V), indicating the light amount in the color, that can have a light or dark appearance:
 4.2. Canny matrix transformation
The deployment between the Canny filter and the Hough transformation, to detect edges and locate shapes wants, a well-known algorithm for pattern detection, Hough transform do a parametric estimation method. The pattern recognition method, proposed by Hough are morphological study methods, but they require a large computation time, in the case of complex geometrical shapes or discontinuous contours, the Canny contour detection method, allowed us to highlight rather wide contours, that are perfectly suited to pair correlation localization, to achieve the work with higher detection accuracy.
4.3. Edge Detection
Canny a multi-step process for edge detection, First of all, it is a question of reducing the noise of the image to optimize contour detection, this reduces strong responses during the gradient calculation, leading to false positives, the solution using Gaussian Filter, very powerful filter, has a kernel of convolution operator in a 2D Gaussian plan [18], this operation due to Gaussian probability law, demonstrated in equation (8), represent the variance of each variables couple ( x, y) with the peak (μ). The main condition for using this type of filter, whether the image is in gray level so that it can be processed to standard deviation Gaussian σ.
![]() A canny filter is based on Sobel’s algorithm, it has additional steps that allow us to work on more complex images [19]. This method allows, by changing the intensity of edge detection, to eliminate linearization and noise defects and at the same time to have wide contours. The width is important for the correlation localization algorithm that follows this contour detection algorithm [20].
A canny filter is based on Sobel’s algorithm, it has additional steps that allow us to work on more complex images [19]. This method allows, by changing the intensity of edge detection, to eliminate linearization and noise defects and at the same time to have wide contours. The width is important for the correlation localization algorithm that follows this contour detection algorithm [20].
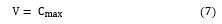
 The Angle and Edge algorithm-based, has been designed to be optimal according to three criteria:
- Good detection: low error rate in contour signaling;
- Good localization: minimizing detected and real contours gap;
- Answer clarity: one answer per outline, no false positives.
After calculating the norm and the direction of the gradient, in each pixel of the image, these methods extract contours of a single-pixel, thickness by selecting the local maxima of the gradient norms. One can mention the detectors of Canny, Deriche, Marr -Hildreth, or the more recent one of Bao [20]. For the operators of Canny and Deriche, an additional variable allows us to adjust the detection sensitivity at the expense of the spatial precision of the contour and vice versa. Moreover, it can be noted that the contours detection in areas, with strong gradients does not necessarily, correspond to an object. In this case, post-processing can be effective, these useful methods yield good results for non-textured image analysis, high-contrast objects with marked contours.
4.4. Shape extraction
The international road safety regulations, are essentially based on laws, that must be respected by everyone, either drivers of automobiles or passengers, so the majority of its laws have been modeled by traffic road signs, that have unique shapes, for example triangular, rectangular, square, or circular, keeping only the circular shapes that exist in the images.
So, the objective of our approach, is to improve or increase the accuracy of the system, that based on artificial intelligence, will have accuracy to detect traffic road signs, we focus the studies on the circular shape, applying the Hough circles method of OpenCV [18] modeled by this equation:
![]() Paul Hough invented a pattern recognition technique, named Hough transform, this technique allows us to recognize any shape in an image, for example, the circles or lines, this technique will serve, to identify circles presences in an image, it can be very easily extended to circle recognition, compared to other models, the Hough technique is a simple mathematical model and robust. This produces sinusoids curves, can be accumulated in a space called Hough space, its role is to draw all points set of the circles, to find out the places when the curves intersect, which means the presence of a circle, mathematically the circle is characterized, by (r) radius and center ( , ) in equation (11).
Paul Hough invented a pattern recognition technique, named Hough transform, this technique allows us to recognize any shape in an image, for example, the circles or lines, this technique will serve, to identify circles presences in an image, it can be very easily extended to circle recognition, compared to other models, the Hough technique is a simple mathematical model and robust. This produces sinusoids curves, can be accumulated in a space called Hough space, its role is to draw all points set of the circles, to find out the places when the curves intersect, which means the presence of a circle, mathematically the circle is characterized, by (r) radius and center ( , ) in equation (11).
For forming a cone with a vertex ( , , r = 0), based essentially on the set number of circles, passing through a given point N (x, y) according to the axis r, and the best points correspond to the maximum intersection of cones. On the other hand, if the circle radius is specified, in a two-dimensional the (a, b) plane, in this plane, the set of circles passing through a given point N is described by the circle of center ( , and radius r, also the best points that bring together the intersection of several circles. Finally, in accumulation, an M matrix is constructed, each element M (i, j) contains the number of circles passing through the point, but the method consists to construct a hyper-matrix for accumulation when the radius is unknown, which each value of cells M (i, j, k), corresponds to a cubic space (a, b, r), characterized by scanning between 1 pixel up and the dimension of the image.
- Implementation
5.1. The manual threshold applied to images
We have tried to roughly summarize the procedure or essential steps in the traffic road signs detection process. Based essentially on the colors by setting the lower and upper limit markers for each color, and the geometry of the signs- see the evolution in Table. I.
5.2. Manual thresholding in Real-time
At this level, we try to apply the detection in real-time, for evaluation of our algorithm the detection of traffic road signs, especially circular shape, which have the colors either Red or Blue, been using a web camera of Asus laptop.
Table 1: Detection of Color and Panel Form [5]
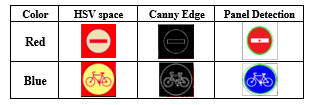 The results obtained contains two essential windows: One window shows the color images conversions, that have several objects detected with Gaussian filtering to eliminate noise, to easily convert it into grayscale images, the other represents the Canny outlines that facilitate the detection of the desirable object outline, at each figure 4: (a) and (b). We took real-world images of two road signs of different colors: red for the “No-entry” sign and blue for the “Bicycle” sign, but the more relevant thing, the extraction or detection of objects were not perfectly detected. So, we ask several questions where this error comes from, but most probably the two HSV space filters are not perfectly established.
- Discussion
The goal of our approach is to have or ensure high accuracy for the detection of traffic road signs, specific circular shapes, then we will be able to apply it to all geometric shapes. We have concluded from what we have obtained previously that the HSV space filter terminals did not prove our approach, indirectly the manual thresholding. In image processing, to have a high resolution or in-depth studies on images, we establish a histogram to have an idea of distributions pixels, because our objective is to reach automatic thresholding for the two test images used previously.
If we have visualized well or focused our attention on the two histograms, we interpret the results obtained, that we have a peak that seems to be the maximum of the pixels distributed for each histogram, in an interval from 250 to 255, it is the V channel in blue concerning the other channels H and S, for the figure. 4 (a) and (b). So, what we can conclude is to look for new values of the HSV space filters and make tests until we get high precision, it’s hard because there are several factors among these factors is the luminance, the solution, we will unproven our work by using the automatic thresholding, we use the most robust is the OTSU method.
6.1. Automatic thresholding
The OTSU method based on a histogram of images, uses discriminant analysis to separate the text from the background, its principle is to divide the image into classes, and then look for the optimal threshold, by minimizing the variance function inter or intra classes. Otsu’s method [21] tries to find or to get the optimal threshold, by separate the histogram into two segments, that maximize the inter-segment variance or minimizes a measure of intra-segment variance, the determination of these variances, based on the histogram normalization. The variances for each threshold is given by equation (12), The designed weights of the probability for each class (i), which means the threshold separation.
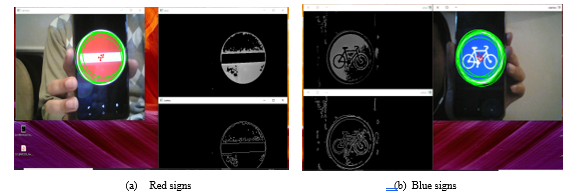 Figure 3: Traffic Signs detection manual thresholding [5]
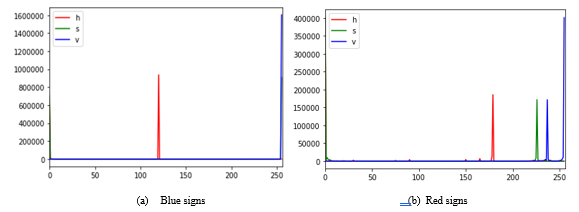 Figure 4: Traffic road signs histogram [5]
![]() The Otsu method advises, for its technique to be effective, by minimizing the intra-class variance, due by maximizing the inter-class variance [20].
The Otsu method advises, for its technique to be effective, by minimizing the intra-class variance, due by maximizing the inter-class variance [20].
 The approach to detect regions of objects, therefore leads directly to a partition of the image, in this approach, we applied different methods consisting of manual or automatic thresholding, the simplest method for thresholding in image processing, through segmentation. From a grayscale image, image thresholding can be used to create an image with only two values, black or white, we have applied this method to the basic images that are shown below in Table. 1. The automatic thresholding applies a multi-level per Otsu’s method, it consists to determine the number of regions, the optimal values of the different thresholds, based on the variance of the subdivisions. To have an algorithm for the detection of traffic roads signs with high efficiency and precision, from what we understood from the OTSU method, that is based on the classes average and , also the class probabilities , which will be applied to the pixels of the road signs, either for blue or red, and we fly at the end of the binarized images.
Our strategy for the binary image was formed by the function of the OpenCV library, the bitwise function. Then we merged the three thresholds h, s, v resulting from the three binary images, to obtain at the end a single threshold value. Still, for the detection of traffic roads signs contours, we use Canny because it has proven its high precision in contour descriptions according to the previous tests, even when there is noise, it guarantees high detection and localization of objects for all two-dimensional applications. Before applying the Canny outline, it is preferable to apply a Gaussian filter. Table. 2 shows the manual thresholding values, which contain the bounds of the HSV space values and automatic thresholding.
Table 2: Identification signs for manual and automatic thresholding [5]
| Threshold | HSV space | Canny Edge | Detection panels forms |
| Automatic | |||
| Manual |
Starting from the fact that we are trying to detect the presence of the circle shape in an image, Firstly, the Hough transform consist of searching for the parameters of the structure to be detected, the second step aims to find the points of the image that may belong to the structure, typically the points where the gradient goes beyond a certain threshold. At each of these points, a representative of the structure will pass through and calculate its parameters, the values of these parameters correspond to a point in the parameter space, the third step consists of marking the curve represented by the calculated parameters as a possible representation of the structure being searched.
Table 3: Manual and automatic thresholding [5]
| Threshold | Colors | Filter | Hue | Saturation | Value |
| Automatic | Red | Auto | |||
| Blue | |||||
| Manual | Red | Upper | 180 | 255 | 255 |
| Lower | 136 | 87 | 111 | ||
| Blue | Upper | 130 | 255 | 255 | |
| Lower | 110 | 50 | 50 | ||
For the identification of colors in HSV space shown in the Table. 3, it is certainly necessary to specify very essential elements, for each color of the high and low filters. Our case is the colors that represent the majority of blue and red traffic roads signs, obtaining the values of channels H, S, and V after extensive experimentation and testing, but the trick is to note that these values can make a service or a work perfectly in an environment A and not sure certainly for an environment B. The solution is to apply automatic thresholding by applying the method of OTSU. OTSU adapts to each environment, to find optimal values for the HSV space that leads easily to the detection of traffic road signs. Finally, we are not only going to press on the color, but we are also going to combine the color and the detection of the circular geometry, it shows in table 3 we have an improvement that makes the algorithm more robust to detect the desired object with real-time optimization.
Practically, we are going to vote for parameters. The curve whose parameters obtain the most votes is therefore the one that best describes the structure. To collect the votes, we need an accumulator table, the size of this table is equal to the number of unknown parameters. The size of each dimension is equal to the maximum value of the corresponding parameter. Once the parameters have been calculated, they represent a cell of the accumulator table, we will increase the value of this cell by one unit. At the end of the process, we are going to explore the accumulator to find the boxes that have obtained the most votes, their corresponding parameters describe the occurrences of the structure we are looking at in table.2, which is the circular shape.
6.2. Real-time based Automatic thresholding
At this stage we try to make a real-time test for traffic road signs detection, we will produce the same scenario in an urban environment by using a webcam as shown in the two figures.5 (a) and (b). The relevant thing is that the detection of circular signs is made with high accuracy, so the automatic thresholding by the OTSU method has a great effect than the HSV space. For the three windows that make up the two figures, we have a very high image quality, which makes it easy for Canny to locate the outline of traffic road signs in a very powerful and robust. Otsu has a methodology able whatever the environments, to perform
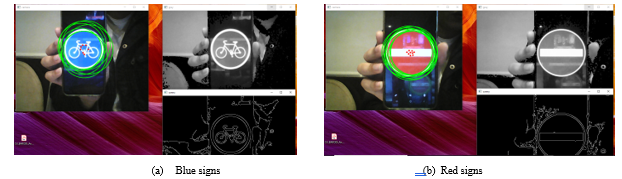 Figure 5: Traffic road signs automatic thresholding [5]
automatic thresholding from the shape of the image histogram, so we deduce, that the conversion from gray-level space to binary space, makes it easier to calculate background and foreground classes, for optimal thresholding for each separate between classes, to comply with the condition, that intra-class variance to be minimal.
6.3. Cropping of the panels detected
The Hough feature descriptor used for road signs detection, calculated on a 32 × 32 patch of an image. Let an image of road signs with a size of 128 × 128. A patch with a size greater than 50 × 50 is selected for the calculation of the Hough descriptor. This patch is cropped from an image and resized to a size 32 × 32 in Table.4.
Table 4: Cropped traffic road signs
| Cropped Blue Signs | Cropped Red signs |
- Recognizing Detected Road Signs
In the recognition part, applying model based on images of traffic road signs in Germany [22], the work is doing it with the Keras libraries for learning and classification, importing python framework, by using some simple and efficient techniques, such as data augmentation [23] and dropout [24].
7.1. Deep Learning
Figure.6 clarify the second part of the approach, for recognizing images, exactly the traffic roads signs [22] using Artificial intelligence, these images cropped from the first part of detection, so this second part, demonstrate how to apply Convolution Neural Networks (CNN) architectures in general, we are going to use in our approach the field of Deep Learning (DL), because this family of architecture, has made it possible to make significant progress in the fields of image classification and recognize different objects, the DL models contains multi-layer of perceptron described above, with more intermediate layers. Each intermediate layer, subdivided all images datasets, for getting sub-parts of features, and providing simpler results to the next layer, CNN currently the powerful models for classifying images [25].
In figure.6 demonstrate two distinct parts of the CNN model, training and performance evaluation, for the first part, in input color images exist, which consist of pre-treatment, the conversion of the color space from RGB to grayscale, for providing a matrix of pixels has two dimensions for a grayscale image, and normalization by value 255 for each image, forget the images ranging between 0 and 1. After the step of pre-treatment, starts training the model, then select the best training model, and then choose based essentially, the curve of accuracy function and loss function. For the second part, the best model passed by strict steps, to evaluate performance; so, we use confusion matrix and rapport classification each class image.
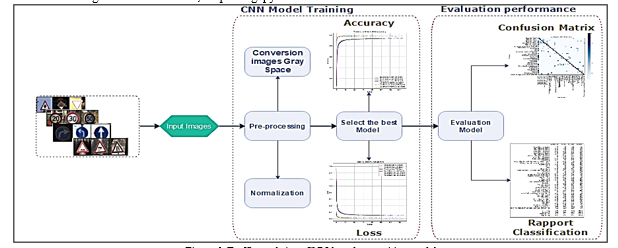 Figure 6: Traffic road signs CNN-based recognition model
 Figure 7: Results of training CNN Model proposed in Table.5
7.2. CNN-based Model Description
- The first part of a CNN is the convolutional part, strictly speaking, functions as an extractor of the characteristics of the image, because the images pass through a succession of filters, or convolution cores, creating new images called convolution maps some broker filters reduce the images resolution, by using a local maximum of operation. After the convolution layers or maps, are flatteners and reassemble into a vector of features.
The CNN base on the MLP (Multi-Layer Perceptron) [26], and inspired by the behavior of the visual cortex, although effective for image processing, MLPs have great difficulty in handling large images, which are due to the exponential growth in the number of connections to the image size, for example, if taking an image size of 32x32x3, so the first hidden layer, need fully-connected neuron of the MLP, to have in inputs 3072 neuron, but for 224x224x3 size images, lead to being processed in inputs, need 150,528 neuron, which means when the images size are larger, the number becomes enormous of neurons.
- A CNN architecture formed by an ensemble of different processing layers, the important layers are:
- The convolution layer (Conv2D) a receiver field the data, explained before.
- The pooling layer (MaxPooling2D) compresses or reduces the image size by subsampling.
Table 5: Architecture CNN Model
| Layers | Output | Parameters |
| Conv2D | (None, 28, 28, 60) | 1560 |
| Conv2D | (None, 24, 24, 60) | 90060 |
| MaxPooling2D | (None, 12, 12, 60) | 0 |
| Dropout | (None, 12, 12, 60) | 0 |
| Conv2D | (None, 10, 10, 30) | 16230 |
| Conv2D | (None, 8, 8, 30) | 8130 |
| MaxPooling2D | (None, 4, 4, 30) | 0 |
| Dropout | (None, 4, 4, 30) | 0 |
| Flatten | (None, 480) | 0 |
| Dense | (None, 500) | 240500 |
| Dropout | (None, 500) | 0 |
| Dense | (None, 43) | 21543 |
| Total parameters: 378,023
Trainable parameters: 378,023 Non-trainable parameters: 0 |
||
Table.5 is composed of four convolution layers, two layers of Max-pooling, and two layers of fully connected. The input image is 32*32 in size; goes to the first convolution layer, this layer composed of 60 filters of 5*5 size, with ReLU activation function forces neuron to return positive values, after this convolution, then 60 feature maps of size 32*32 are obtained, which represent the input of the second convolution layer, also composed of 60 filters. The Max pooling layer was applied afterward, to reduce the image size. At the output of this layer, we will have 60 feature maps of size 12*12. We repeat the same thing with the last convolution layers composed of 30 filters; the ReLU function always applies to each convolution, and Max-pooling layer valid all the time, at the output of these layers, the features vectors of sizes 480. Finally, using a neural network composed of two fully connected layers, the first layer composes of 500 neurons, where the ReLU activation function was used, the second layer uses softmax function, for calculating the probability distribution of the 43 classes of traffic roads signs.
7.3. Trained Model
According to Figure.7 (a), the curves of training accuracy increase when several epochs increases, the same observation for curves of validation accuracy, reflecting the fact of epochs, can conclude the model learns more information. If the validation accuracy can’t follow training accuracy, during the training model, this means that the CNN architecture, did not extract enough characteristics, for each class from the road sign images, called the underfitting, and when validation accuracy decreases during the training model, may result to overfitting, can conclude more features, allowing to model learn enough. Therefore, the curves of training loss decrease to achieve minimum error values, according to the number of epochs in the figure.7 (b), and the same for curves of validation loss. For all the graphs shown, the model does a very good job and powerful, according to the best scores shown in the figures previously during training, has reaches 11% in error rate and the totality for a 97% accuracy rate.
Table 6: Scores of accuracy and loss
| Model | Epoch | Test
Loss (%) |
Test
Accuracy (%) |
Processor Type |
| CNN Model | 50 | 06.93 | 97.91 | NVIDIA
GeForce 920M (GPU) |
| 100 | 11.64 | 97.05 | ||
| 150 | 11.31 | 97.11 |
7.4. Training model description
Table.6 shows the results of scores accuracy and loss, using the test dataset, the execution time is too expensive, this comes back to the large size of the base which requires to use GPU that CPU [27]. The model presented the best results found, the number of epochs and convolution layers reflect these good results; however, the execution time was very expensive because of the number of epochs.
In general, a deep convolutional neural network gives good results and the performance of our network degrades, if the number of epochs increases. For example, according to the table, the increase leads to a loss of about 0.86% of the performance of the network. Therefore, depth is crucial to achieving good results. The results obtained have improved as we have deepened our network with the number of epochs. The learning base is also a crucial element in convolutional neural networks, you need a large learning base to achieve better results in the future.
- System Performance Evaluation
8.1. Cropped images recognition
As can see in Table.7, after the detection of circular-shaped panels with high accuracy in a real-time environment. Then we cut the road signs, the next phase is the most important for our system, the recognition of the road signs, identifying it to which class or category belongs in an intelligent way using deep learning. The objects that contain both images have been classified correctly without any errors. The red sign has been classified or recognized with a prediction of 100% No-entry, the same for the blue sign with a percentage of 100% Turn left. So, we have good results that can be a basis for the improvement of ADAS systems in the automotive sector that will serve the evolution of industry 4.0.
Table 7: Recognition of TRAFFIC ROADS SIGNS cropped
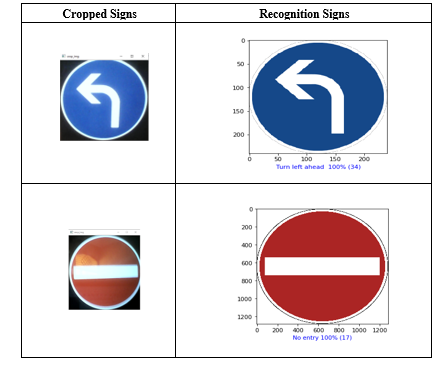
 Figure 8: Confusion Matrix of CNN model
 Figure 9: The classification rapport of the CNN model
8.1. Confusion Matrix
The Confusion Matrix [28] is used to evaluate the performance of our model, since it reflects the metrics of True Positive, True Negative, False Positive, and False Negative. Figure.8 closely illustrates the position of these metrics for each class. For example, the model ranked the automotive images well and is ranked or confused by the images of the other classes. We notice that there is a little confusion in classification on everything for the first class, which reduced the classification rate a little.
The average classification rate, as shown in the figure. 9 is 98%, which indicates our good system, for precision and recall, and high classification values for all categories.
- Conclusion
Object detection in images and more specifically the detection of road signs images is a problem addressed by artificial vision. Among its fields of application are video surveillance, road safety, detection assistance systems. In our work, we were interested in the detection of signs. A bibliographical study has been carried out to determine the possible detection adopted methods and the most used descriptors in this case. Image classification is an important task in the computer vision field, object recognition, and machine learning. Through Deep Learning, the future of artificial intelligence enhances large and very fast developing algorithms. We discussed how the detection process and image classification took by a camera device during the discussion of the concepts of the neural network. To realize our classification work we used deep learning, which has shown its performance in recent years and we chose the CNNs method as the classification method, this choice is justified by the method’s simplicity and its efficiency. During the tests phase, the obtained result confirms our approach effectiveness. Our work is only in its initial version and remains open for comparison with other classification methods [29].
The objective was to create a system for the automotive sector that combines detection and recognition. Detection based on the color and geometry of road signs, recognition based on deep learning based on CNN architecture, we got a score of 100% for classifying the test images captured from a real environment. Our work to be complimentary for our next work of detected geometry: triangular and rectangular, and classified it using Artificial Intelligence. This approach can be applied to the development of embedded systems for the automobile, which will serve road safety for all road users, either the passenger or the driver.
- L. Li, “China’s manufacturing locus in 2025: With a comparison of ‘Made-in-China 2025’ and ‘Industry 4.0,’” Technological Forecasting and Social Change, 135(February), 66–74, 2018, doi:10.1016/j.techfore.2017.05.028.
- K.M. Tan, V.K. Ramachandaramurthy, J.Y. Yong, “Integration of electric vehicles in smart grid: A review on vehicle to grid technologies and optimization techniques,” Renewable and Sustainable Energy Reviews, 53, 720–732, 2016, doi:10.1016/j.rser.2015.09.012.
- K. Armstrong, S. Das, J. Cresko, “The energy footprint of automotive electronic sensors,” Sustainable Materials and Technologies, 25, e00195, 2020, doi:10.1016/j.susmat.2020.e00195.
- S. Hossain, D.J. Lee, “Deep learning-based real-time multiple-object detection and tracking from aerial imagery via a flying robot with GPU-based embedded devices,” Sensors (Switzerland), 19(15), 2019, doi:10.3390/s19153371.
- A. Barodi, A. Bajit, M. Benbrahim, A. Tamtaoui, “An Enhanced Approach in Detecting Object Applied to Automotive Traffic Roads Signs”, IEEE International Conference on Optimization and Applications (ICOA), 1–6 ,2020 , doi:10.1109/ICOA49421.2020.9094457.
- R.Y. Zhong, X. Xu, E. Klotz, S.T. Newman, “Intelligent Manufacturing in the Context of Industry 4.0: A Review,” Engineering, 3(5), 616–630, 2017, doi:10.1016/J.ENG.2017.05.015.
- K. Okuma, A. Taleghani, N. De Freitas, J.J. Little, D.G. Lowe, “A boosted particle filter: Multitarget detection and tracking,” Lecture Notes in Computer Science (Including Subseries Lecture Notes in Artificial Intelligence and Lecture Notes in Bioinformatics), 3021, 28–39, 2004, doi:10.1007/978-3-540-24670-1_3.
- Y. Lu, Z. Zhou, J. Zhao, “Visual Object Tracking Using PCA Correlation Filters,” 2544–2550, 2018, doi:10.2991/caai-18.2018.10.
- S. Kolkur, D. Kalbande, P. Shimpi, C. Bapat, J. Jatakia, “Human skin detection using RGB, HSV and YCbCr color models,” ArXiv, 137, 324–332, 2017, doi:10.2991/iccasp-16.2017.51.
- A. Uçar, Y. Demir, C. Güzeliş, “Object recognition and detection with deep learning for autonomous driving applications,” Simulation, 93(9), 759–769, 2017, doi:10.1177/0037549717709932.
- R. Ranjan, V.M. Patel, R. Chellappa, “HyperFace: A Deep Multi-Task Learning Framework for Face Detection, Landmark Localization, Pose Estimation, and Gender Recognition,”IEEE Transactions on Pattern Analysis and Machine Intelligence, 41(1), 121–135, 2019, doi:10.1109/TPAMI.2017.2781233.
- M. Rout, J.K. Rout, H. Das, Correction to: Nature Inspired Computing for Data Science, 2020, doi:10.1007/978-3-030-33820-6_12.
- V. Balali, A. Jahangiri, S.G. Machiani, “Multi-class US traffic signs 3D recognition and localization via image-based point cloud model using color candidate extraction and texture-based recognition,” Advanced Engineering Informatics, 32, 263–274, 2017, doi:10.1016/j.aei.2017.03.006.
- S. Houben, J. Stallkamp, J. Salmen, M. Schlipsing, C. Igel, “Detection of traffic signs in real-world images: The German traffic sign detection benchmark,” Proceedings of the International Joint Conference on Neural Networks, 2013, doi:10.1109/IJCNN.2013.6706807.
- H. Zhang, T. Xu, H. Li, S. Zhang, X. Wang, X. Huang, D. Metaxas, “StackGAN: Text to Photo-Realistic Image Synthesis with Stacked Generative Adversarial Networks,” Proceedings of the IEEE International Conference on Computer Vision, 2017-Octob, 5908–5916, 2017, doi:10.1109/ICCV.2017.629.
- K. Muhammad, M. Sajjad, I. Mehmood, S. Rho, S.W. Baik, “Image steganography using uncorrelated color space and its application for security of visual contents in online social networks,” Future Generation Computer Systems, 86, 951–960, 2018, doi:10.1016/j.future.2016.11.029.
- G. Saravanan, G. Yamuna, S. Nandhini, “Real time implementation of RGB to HSV/HSI/HSL and its reverse color space models,” International Conference on Communication and Signal Processing, ICCSP 2016, 462–466, 2016, doi:10.1109/ICCSP.2016.7754179.
- K. Preethi, K.S. Vishvaksenan, “Gaussian Filtering Implementation and Performance Analysis on GPU,” Proceedings of the International Conference on Inventive Research in Computing Applications, ICIRCA 2018, (Icirca), 936–939, 2018, doi:10.1109/ICIRCA.2018.8597299.
- A. Barodi, A. Bajit, S. E. Aidi, M. Benbrahim, and A. Tamtaoui, “Applying Real-Time Object Shapes Detection To Automotive Traffic Roads Signs.”, International Symposium on Advanced Electrical and Communication Technologies (ISAECT) , 1–6 ,2020– Proceeding.
- B. Li, S.T. Acton, “Automatic active model initialization via poisson inverse gradient,” IEEE Transactions on Image Processing, 17(8), 1406–1420, 2008, doi:10.1109/TIP.2008.925375.
- M. Baygin, M. Karakose, A. Sarimaden, E. Akin, “An image processing based object counting approach for machine vision application,” ArXiv, 18.
- J. Stallkamp, M. Schlipsing, J. Salmen, C. Igel, “The German Traffic Sign Recognition Benchmark for the IJCNN’11 Competition,” Proc. of the International Joint Conference on Neural Networks, 1453–1460, 2011.
- A. Mikołajczyk, M. Grochowski, “Data augmentation for improving deep learning in image classification problem’, Inter. Interdisciplinary PhD Workshop (IIPhDW), 117–122, 19, doi10.1109/IIPHDW. 2018.8388338.”
- G.H. de Rosa, J.P. Papa, X.S. Yang, “Handling dropout probability estimation in convolution neural networks using meta-heuristics,” Soft Computing, 22(18), 6147–6156, 2018, doi:10.1007/s00500-017-2678-4.
- H.C. Shin, H.R. Roth, M. Gao, L. Lu, Z. Xu, I. Nogues, J. Yao, D. Mollura, R.M. Summers, “Deep Convolutional Neural Networks for Computer-Aided Detection: CNN Architectures, Dataset Characteristics and Transfer Learning,” IEEE Transactions on Medical Imaging, 35(5), 1285–1298, 2016, doi:10.1109/TMI.2016.2528162.
- V.F. Kuzishchin, V.A. Dronov, “The specific features of the algorithm for tuning controllers on the basis of the kvint firmware system,” Thermal Engineering, 48(10), 835–841, 2001.
- Y.D. Zhang, K. Muhammad, C. Tang, “Twelve-layer deep convolutional neural network with stochastic pooling for tea category classification on GPU platform,” Multimedia Tools and Applications, 77(17), 22821–22839, 2018, doi:10.1007/s11042-018-5765-3.
- M. Frid-Adar, I. Diamant, E. Klang, M. Amitai, J. Goldberger, H. Greenspan, “GAN-based synthetic medical image augmentation for increased CNN performance in liver lesion classification,” Neurocomputing, 321, 321–331, 2018, doi:10.1016/j.neucom.2018.09.013.
- A. Barodi, A. Bajit, M. Benbrahim, and A. Tamtaoui,‘Improving the Transfer Learning Performances in the Classification of the AutomotiveTraffic Roads Signs’, E3S Web Conf., 2020 — Proceeding.