Decision Support Model using FIM Sugeno for Assessing the Academic Performance
Volume 6, Issue 1, Page No 605-611, 2021
Author’s Name: Deddy Kurniawana), Ditdit Nugeraha Utama
View Affiliations
Computer Science Department, BINUS Graduate Program – Master of Computer Science, Bina Nusantara University, Jakarta, Indonesia 11480
a)Author to whom correspondence should be addressed. E-mail: deddy.kurniawan@binus.ac.id
Adv. Sci. Technol. Eng. Syst. J. 6(1), 605-611 (2021); ![]() DOI: 10.25046/aj060165
DOI: 10.25046/aj060165
Keywords: Assessing, Academic Performance, Fuzzy Logic, Fuzzy Inference Model, Sugeno

Export Citations
Assessing academic performance is a common way of evaluating and assessing the abilities of students in tertiary institutions. Usually it is practically performed based on the cumulative grade point average (GPA) at the end of each semester passed. Unwittingly there are many factors that are able to influence student performance results apart from GPA as a performance measure; i.e. gender, hometown, sibling, family status, residence, father education, mother education, family income, motivation, mileage, traveled time, transportation, scholarship, community, social media, and hang-out. Academic performance assessment is proposed through the decision support model (DSM) applying the fuzzy logic (FL) Sugeno technique. The model output generates a decision value (linear or constant equation) for academic performance based on the calculation of the measured fuzzy parameter value (ax) and conventional parameter value (bx). The DSM with the FL Sugeno method is able to provide sharp output in assessing student academic performance. In this case, the model is able to be applied then to assist academics in higher education in determining educational strategies for students with poor academic performance results.
Received: 06 November 2020, Accepted: 16 January 2021, Published Online: 30 January 2021
1.Introduction
The academic performance is one indicator of the education quality in universities. It generally is able to be measured with the value achievements record of the grade point average (GPA) [1]-[3]. The GPA is greatly influenced by various factors. Those factors are such as the social, family, economic and educational environment of each individual [1], [4], [5].
The assessment process is a part of the evaluation process toward student academic performance which is done by higher education academics. Academic performance appraisal is one of the effective solutions to detect student failure problems. Analyzing stored student data can help provide important information in their academic performance appraisal process.
The new models to support objectives in the academic performance assessment process are still being investigated and researched scientifically. One of them is a study related to decision support models (DSM). The research has been carried out by a number of researchers with DSM as the main issue. Creating DSM to solve difficulties related to mosque rebuilding. Fuzzy method was operated to determine the priority value of eleven parameters [6]. Also, eco-DSM for treating medical waste was constructed by involving the fuzzy method as the main part of the model [7]. Then, the model for determining the amount of production, especially in the business world, functioned the fuzzy Sugeno technique [8].
In addition, [9] created DSM to measure the performance of logistical companies based on various indicators performance. In [10], the author created a model to calculate the exact number of goods ordered, this affects the level of inventory and the sales of goods. The determination of the venue for the national multi-sport event or called the national sport week (NSW). The determination of the best location was carried out in Indonesia with thirty-four provinces that had various distinctive features and cultural uniqueness [11].
This paper is DSM development in fulfilling research objectives for the assessment of student academic performance which is implemented in the education area (universities), exclusively operated in a calculation using the fuzzy logic method as well as using the data asset for 100 students at the faculty of Teacher Training and Education (FKIP) at the University of Mulawarman, East Kalimantan. Fuzzy logic (FL) has been widely used in various fields in the real world. FL is technically the principal method used in calculating mathematics as well as it is used to assess uncertainty in various fields. FL plays an important role in changing the complex symptoms of problems and cannot easily be translated into mathematical models, with the aim of providing a best solution approach to problems [12]. The assessment result can provide early warning to academics to be able to pay attention in taking quick steps to improve student academic performance in bad conditions.
2. Related Works
The concept of fuzzy logic is a popular method used in decision-making support. In [13], the author was applying the fuzzy method in engineering asset management (EAM), checking the condition of assets is an important aspect of EAM because it is able to identify symptoms of potential failure and suggest corrective actions before operational disruptions. In [14], the author was creating a conceptual model for evaluating the performance of social sustainability and has been tested for later implementation in India in automotive component manufacturing organizations.
In addition, from year to year, various researchers conduct research on the issue of academic performance (AP) appraisal as the main topic in their research [15]-[17]. In [15], the author chose to take AP as the main topic of their research. They observed twenty student data based on three characteristics in the one academic period involving, exam 1, exam 2 (theoretical), and exam3 (practical). The results of the study were compared with traditional evaluation methods and gave similar results. They concluded that the evaluation results with the proposed approach could be a practical method in evaluating AP.
In [16], the author introduced the new fuzzy expert system (NFES) to be used in evaluating student AP based on the concept of FL by considering two parameters, semester 1 and semester 2 scores. In order to make decisions about learning in the next period. In [17], the author applied the fuzzy method in the evaluation of AP control of twenty students in the engineering laboratory at the faculty of Engineering Education Marmara University, department of Electricity Education. The semester 1 and semester 2 grades are used as the input that counts. In [17], the author concluding that there are variations in the evaluation results from the results of comparisons made to classical evaluation methods. The fuzzy method provided the advantage of flexibility in AP evaluation and provides many evaluation options.
3. Prepare Your Paper before Styling
As mentioned in the introduction part, the purpose of the assessment is part of a big task in the process of evaluating academic performance. Figure 1 describes the step by step of the whole study.
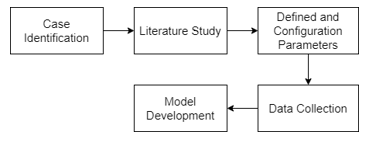 Figure 1: Research Stages
The first step we take is to study real case (in the case is academic performance measurement) supported by reviewing several scientific manuscripts. Two these stages operated to enrich our knowledge of case we face. Furthermore, we define the parameters related to the assessment of academic performance based on the study results of the related research literature involving 17 validated ones (Table 1) and are taken into account in influencing the AP assessment. Then the parameters will be configured which include; parameter grouping and parameter weighting. The preparation process for the parameters is successfully carried out, then data collection is carried out for further preparation as a dataset for this study.
Then, the construction of the model is carried out. The model is built with FL method to be operated as the main method, in addition to conventional methods used. The concept of FL (fuzzy – inference – de fuzzy) begins with building membership functions (MF) and linguistic variables (LV) as calculation scales. The LV definition of the fuzzy parameter is used to describe the input value in the form of the condition level of each academically calculated fuzzy parameter. It is then designed via MF fuzzy triangle-trapezium on each fuzzy parameter. Further preparing the vague ground rules as reference engine rules in determining the results of considerations so that we found 3,456 basic rules. The final stage of FL is de fuzzy, the result of FL decision is determined using the centroid method of sugeno technique.
Table 1: Parameters and their Value
| Variable | Parameters | Parameter Value |
| P1 | Gender | Male (M), Female (F) |
| P2 | Hometown | Town (T), Out of town (OT) |
| P3 | Sibling | 1, 2, 3, 4, 5 |
| P4 | Family Status | Living together (L),
Divorce (D), Died (DE) |
| P5 | Residence | With parents (P), Hostel/Rental (H) |
| P6 | Father Education | Not Education (0), Primary School (1), Junior High School (2), Senior High School (3), Undergraduate (4), Graduate (5), Postgraduate (6) |
| P7 | Mother Education | Not Education (0), Primary School (1), Junior High School (2), Senior High School (3), Undergraduate (4), Graduate (5), Postgraduate (6) |
| P8 | Family Income | 0-5000000
(in Million rupiah) |
| P9 | Motivation | Dream (D), Association (A) |
| P10 | Mileage | 1-20 (in KM) |
| P11 | Traveled Time | 1-60 (in Minute) |
| P12 | Transportation | Private (PR), Public (PB) |
| P13 | Scholarship | No (N), Yes (Y) |
| P14 | Community | No (N), Yes (Y) |
| P15 | Social Media | 1, 2, 3 ,4, 5, 6, 7, 8, 9, 100 (in Hours/day) |
| P16 | Hangout | 1, 2, 3 ,4, 5, 6, 7, 8, 9, 100 (in Hours/day) |
| P17 | Grade Point Average (GPA) | 0.00-2.50 (Poor),
2.51-2.99 (Good), 3.00-3.59 (Very Good) and 3.60-4.00 (Excellent) |
3.1. Data Collection
Collecting data as a research dataset using a combination of data collected through two methods; 1) online questionnaire is applied in collecting actual information from student personal data, 2) list of GPA scores from the academic database for the five initial periods of learning downloaded from the academic database for 100 data from FKIP to be studied.
The collected data is prepared for research. The dataset is combined and prepared by eliminating defective data samples and by manually adding missing pieces of data to the data sample.
3.2. Grouped Parameters
Seventeen parameters configured to prepare the entire parameter can be used on the model. Parameter configuration is done through two stages, grouping and weighting parameters. The first configuration is done by grouping parameters based on the calculation operation to be used in each parameter group. The grouping was successfully formed into fuzzy groups (ax) and conventional groups (bx). Parameter grouping shapes described in Table 2.
Table 2: Parameter Grouping Based on Calculation Method
| Grouped Parameters | Parameters |
| Fuzzy (ax) | Sibling (P3), Father Education (P6), Mother Education (P7), Family Income (P8), Mileage (P10), Traveled Time (P11), Social Media (P15), Henge Out (P16), Grade Point Average (GPA) (P17). |
| Conventional (bx) | Gender (P1), Hometown (P2), Family Status (P4), Residence (P5), Motivation (P9), Transportation (P12), Scholarship (P13), Community (P14). |
Some researchers stated that there were several parameters in the bx section that only had a small effect on the achievement of AP. According to [18], there is no significant result for the effect given by the gender parameter on student AP results. From the results of the study in [19], the author stated that three other parameters also had a small effect on the PA results including; number of siblings, mileage from faculty and gender. At bx each attribute of the parameter contains a nominal value, where in the conventional group concept (stated as bx) the shape of the attribute effect of the parameter is stated in integer form (0 and 1) represented by conventional values (VC) and shown in Table 3.
Table 3: Conventional Group Value
| Parameters | Parameter Value | VC |
| Gender | Male (M) | 0 |
| Female (F) | 0 | |
| Hometown | Town (T) | 1 |
| Out of town (OT) | 0 | |
| Family Status | Living together (L) | 0 |
| Divorce (D) | 1 | |
| Died (DE) | 1 | |
| Residence | With parents (P) | 0 |
| Hostel/Rental (H) | 1 | |
| Motivation | Dreams (D) | 0 |
| Association (A) | 1 | |
| Transportation | Private (PR) | 0 |
| Public (PB) | 1 | |
| Scholarship | Yes (Y) | 1 |
| No (N) | 0 | |
| Community | Yes (Y) | 1 |
| No (N) | 0 |
3.3. Weighted Parameters
The second configuration of the parameters is done by weighting the parameters. The weighting technique is carried out in two stages; 1) the initial stage is carried out by using the Rapid Miner tool to determine the weight level of each parameter in giving an effect on student academic performance based on the case data used in this study, 2) the next stage is to normalize the initial weighting results. The normalization process aims to avoid systematic technical effects in the form of sufficient data gaps between parameters to ensure that technical bias has minimal impact on the results [20]. The normalization process uses a formula as in equation (1).
![]() The results of normalized weights are shown in Table 4. Where is the fuzzy group (referred to as ax) and the conventional group (referred to as bx), and the weight value of the parameter (referred to as W). The total weight value for ax is represented by (∑W Fuzzy) and the total weight value for bx is represented by (∑W Conventional). The total weight value ax produces a greater total weight value than conventional parameter groups in influencing the final calculation results in the AP.
The results of normalized weights are shown in Table 4. Where is the fuzzy group (referred to as ax) and the conventional group (referred to as bx), and the weight value of the parameter (referred to as W). The total weight value for ax is represented by (∑W Fuzzy) and the total weight value for bx is represented by (∑W Conventional). The total weight value ax produces a greater total weight value than conventional parameter groups in influencing the final calculation results in the AP.
Table 4: Normalize the Parameter Weights
| No | ax | W | No | Bx | W |
| 1 | CGPA | 0.32969 | 1 | Scholarship | 0.03398 |
| 2 | Traveled Time | 0.27696 | 2 | Transportation | 0.02487 |
| 3 | Mileage | 0.06018 | 3 | Family Status | 0.02296 |
| 4 | Mother Education | 0.05371 | 4 | Motivation | 0.01871 |
| 5 | Father Education | 0.04136 | 5 | Gender | 0.01552 |
| 6 | Family Income | 0.03585 | 6 | Hometown | 0.00177 |
| 7 | Sibling | 0.03308 | 7 | Community | 0.00081 |
| 8 | Hang-Out | 0.02721 | 8 | Residence | 0.00026 |
| 9 | Social Media | 0.02308 | |||
| ∑W Fuzzy | 0.88100 | ∑W Conventional | 0.12000 | ||
3.4. Fuzzy Logic Model
After getting the data collected, we create a fuzzy set by determining the LV of each fuzzy parameter (FP) shown in Table 5. Where FP is a fuzzy parameter of academic performance parameters, LV is a linguistic variable, and then MF domain are domain membership functions based on the LV of each FP. After the LV is determined successfully. It is then designed to create a MF.
The degree of membership is obtained by first making a graph of each selected FP. The parameters for the number of siblings, father and mother education, social media, and traveling have 2 fuzzy sets, namely: low and high. The parameters of family income, mileage, and travel time have 3 LV, namely: low, medium and high. CGPA parameter has 4 LV, namely: poor, good, very good, and excellent. All MFs are determined in Figure 2 to Figure 10.
Table 5: Membership Function Value
| FP | LV | Domain |
| Sibling | Low (L) | [0, 3] |
| High (H) | [2, 5] | |
| Father Education | Low (L) | [0, 4] |
| High (H) | [3, 6] | |
| Mother Education | Low (L) | [0, 4] |
| High (H) | [3, 6] | |
| Family Income | Low (L) | [0, 2000000] |
| Medium (M) | [1500000, 3500000] | |
| High (H) | [3000000, 5000000] | |
| Mileage | Low (L) | [0, 8] |
| Medium (M) | [6, 14] | |
| High (H) | [12, 20] | |
| Traveled Time | Low (L) | [0, 20] |
| Medium (M) | [15, 45] | |
| High (H) | [30, 60] | |
| Media Social | Low (L) | [0, 6] |
| High (H) | [4, 10] | |
| Henge Out | Low (L) | [0, 5] |
| High (H) | [4, 10] | |
| Grade Point Average (GPA) | Poor (P) | [0,00, 2,75] |
| Good (G) | [2,50, 3,25] | |
| Very Good (VG) | [3,00, 3,75] | |
| Excellent (E) | [3,50, 4,00] |
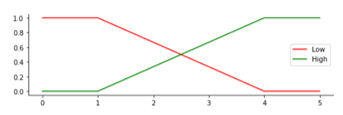 Figure 2: Membership Function for Parameter Sibling
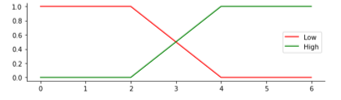 Figure 3: Membership Function for Parameter Father Education
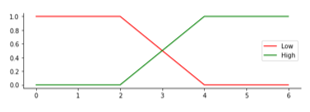 Figure 4: Membership Function for Parameter Mother Education
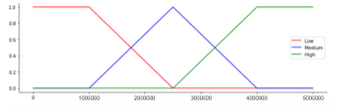 Figure 5: Membership Function for Parameter Family Income
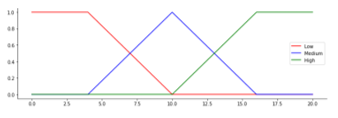 Figure 6: Membership Function for Parameter Mileage
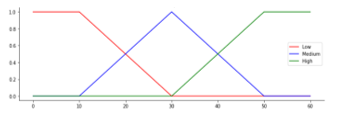 Figure 7: Membership Function for Parameter Traveled Time
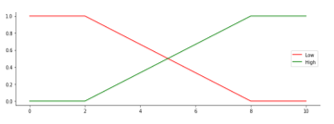 Figure 8: Membership Function for Parameter Social Media
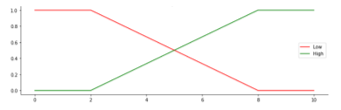 Figure 9: Membership Function for Parameter Henge Out
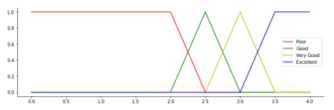 Figure 10: Membership Function for Parameter CGPA
Academically, fuzzy rules are defined to be characterized as fuzzy academic performance (FAP) values based on fuzzy input parameters. The number of fuzzy rules has as many as 3,456 rule bases. It is based on parameters and linguistics. Thus, that can be validated based on the study of related research literature (shown in Table 6) is used to obtain the FAP value.
Table 6: Fuzzy Rules
| Rule 1 | IF P1(Low) AND P2(Low) AND P3(Low) AND P4(Low) AND P5(Low) AND P6(Low) AND P7(Low) AND P8(Low) AND P9(Poor) THEN Performance Bad |
| Rule 2 | IF P1(Low) AND P2(Low) AND P3(Low) AND P4(Low) AND P5(Low) AND P6(Low) AND P7(Low) AND P8(Low) AND P9(Good) THEN Performance Bad |
| … | … |
| Rule 3455 | IF P1(High) AND P2(High) AND P3(High) AND P4(High) AND P5(High) AND P6(High) AND P7(High) AND P8(High) AND P9(Very Good) THEN Performance Good |
| Rule 3456 | IF P1(High) AND P2(High) AND P3(High) AND P4(High) AND P5(High) AND P6(High) AND P7(High) AND P8(High) AND P9(Excellent) THEN Performance Good |
3.5. Calculation Academic Performance
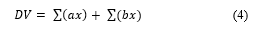
In building the model, we apply two separate calculation operations with the Sugeno technique fuzzy method as the main counting operation on the model, specifically in producing the decision value for the final score of academic performance appraisal. The application of the FL Sugeno method provides a systematic approach to generate fuzzy rules from a given input to the output. To calculate the resulting output, Sugeno technique uses weighted average where the resulting output can be a separate characteristic with the final result not in the form of a fuzzy set but a linear or constant equation [21], [22].
From each of the total weight values of ax and bx that were found. Later it will be used to operate as a multiplier index for each calculation operation in the parameter group. The value of (∑WFuzzy) is used as a multiplier index to multiply the total value of the FAP value calculation operation to produce the total value of the effect of ax on academic performance ((∑(ax)) which is mathematically written in equation 2.
![]() whereas the value (∑W Conventional) used as a multiplier index to multiply the total value of the simple CV addition calculation operation to produce the total effect value of bx on academic performance (∑(bx)) which is mathematically written in equation 3.
whereas the value (∑W Conventional) used as a multiplier index to multiply the total value of the simple CV addition calculation operation to produce the total effect value of bx on academic performance (∑(bx)) which is mathematically written in equation 3.
![]() The final calculation stage for the assessment of academic performance, equation (4) is used in calculating the results of the value of academic performance decisions, where each calculation result of the coefficients (∑(ax)) and (∑(bx)) is added up to obtain the final score for the assessment of academic performance. Where the final assessment results as a decision value (DV) in this model produce a decision value in the form of a firm value to assess the results of student academic performance.
The final calculation stage for the assessment of academic performance, equation (4) is used in calculating the results of the value of academic performance decisions, where each calculation result of the coefficients (∑(ax)) and (∑(bx)) is added up to obtain the final score for the assessment of academic performance. Where the final assessment results as a decision value (DV) in this model produce a decision value in the form of a firm value to assess the results of student academic performance.
 4. Result and Discussion
4.1. Experiment Results
The DSM model built for academic performance appraisal using the FL method Sugeno technique which is a popular method in the DSM field. It is also quite elastic in dealing with complex problems in the real world in the form of linear or nonlinear systems. It works by mapping problems into the form of fuzzy reasoning to obtain a decision. The complete flow of activity in the model is depicted in Figure 11.
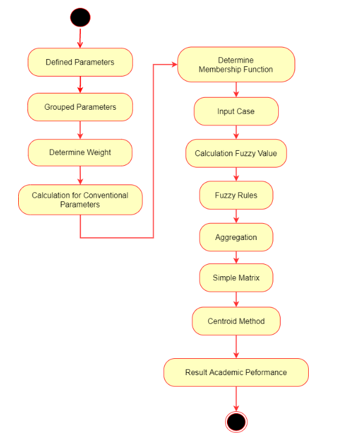 Figure 11: Model for Assessing Academic Performance
The initial activity begins by configuring all the parameters used as model input. The configuration at the initial stage is done by grouping the existing parameters into fuzzy groups (ax) and conventional groups (bx). Furthermore, the configuration for weighting is carried out to identify each weight value (W) of each parameter and the total weight value for axis represented by (∑WFuzzy) and the total weight value for bx is represented by (∑W Conventional).
Furthermore, the counting operation for bx is carried out separately from the FL Sugeno method. The calculation is done by multiplying the number of CV against the (∑W Conventional) value to produce the total effect value of bx on academic performance (∑(bx)).
The counting operation using the FL Sugeno method for ax is carried out in the next step. The main concept of the FL method includes the “fuzzy – inference – defuzzy” stage which is carried out sequentially based on the fuzzy rules created. The rules then produce a FAP value based on fuzzy input parameters. At the end of the Sugeno FL method, the FAP value is used to multiply the (∑WFuzzy) value to produce the total effect of on academic performance (∑(ax)).
The final process of assessing academic performance is carried out by adding up the respective values of (∑(ax)) and (∑(bx)) that were successfully obtained in the previous stage. The final result of the academic performance appraisal is formed as a DV which is in the form of a linear or constant equation. DV based on the determination of the index value for the performance criteria is determined. Where the good performance criteria have an index value of 80 while the bad performance criteria have an index value of 50. The sample results from our calculations are shown in Figure 12.
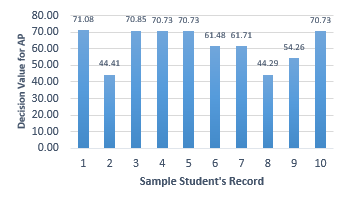 Figure 12: Result Assessing for Academic Performance
The bar graph in Figure 11, represents the 10 data cases used. The visualization on the bar graph in Figure 11 shows that our 5 test data resulted in good academic performance scores with the highest score at 71.08, 2 data are poor academic performance scores with the lowest score at 44.29, with an average of 62.03 results for the assessment of academic performance that we have done.
4.2. Discussion
The measurement of AP results in the classical method is usually expressed in numerical form (GPA) obtained at the end of the learning period [15]. Therefore, it can be said that the classical method is a form of presentation based on the comparison of student performance results with the predetermined standard performance value category.
The academic performance assessment of FKIP students at Mulawarman University focuses more on the indication of the achievement of GPA. Policymakers tend to focus more on the GPA score. That makes various policies focused on increasing the GPA over a period of time.
One shortcoming is found for the classical method used in the current AP assessment. Where it only focuses on increasing the GPA score in a certain period without any criteria instead of using the GPA indicator for the final result [16]. While the GPA indicator is an assessment of university accreditation as well. However, the supporting factors of achieving GPA scores are not used such as; gender, hometown, sibling, family status, residence, father education, mother education, family income, motivation, mileage, traveled time, transportation, scholarship, community, social media, and hang-out. The results of the model assessment of AP from the GPA of the results of the conventional method are compared and displayed in Table 7. It is proven academically, that PA produced by the constructed DSM does not has similar rank (priority) to PA measured based on GPA.
Table 7: Comparison of Assessing Performance
| No | Performance
(Fuzzy Logic Sugeno Method) |
Performance
(Classical Method) |
| 1 | 71.08 | 3.56 |
| 2 | 70.85 | 3.15 |
| 3 | 70.73 | 2.98 |
| 4 | 70.73 | 3.46 |
| 5 | 70.73 | 3.56 |
| 6 | 61.71 | 2.96 |
| 7 | 61.48 | 2.97 |
| 8 | 54.26 | 2.89 |
| 9 | 44.41 | 2.41 |
| 10 | 44.29 | 2.46 |
Table 7 shows that the results of the academic performance assessment using the model we built can be a solution. That can be used practically. As well as it can give freedom to academics as policymakers to be able to assist in the process of academic performance evaluation by providing the results of an effective approach. The final results of the assessment are carried out using various parameters outside of the educational factors for the family, economic, social, and environmental factors that we calculated on the model.
We identify the influence great value of each parameter from the fuzzy group (ax) and the conventional group (bx) on our AP assessment (Figure 12). The symbolized parameters refer to Table 1. The Traveled Time (P11) parameter has a significant effect by being the second largest influencer (0.27696) on ax after the CGPA parameter (P17) which has an effect of (0.32969), which simultaneously is the main indicator in making an assessment AP, while the social media parameter (P15) is the smallest one (0.2308).
In (bx), each parameter does not seem to have much influence on the AP assessment, with the Scholarship parameter (P13) as the biggest influencer (0.03398) and the Residence parameter (P5) giving an effect of (0.00026). Figure 12 shows that the AP assessment process is heavily influenced by various parameters on ax with the influence great value of is (0.88100) and the parameter on (bx) has little effect (0.12000) on the AP assessment.
Besides the various parameters that we use, which are parameters related to academic performance from various factors such as social, family, economic, and educational environments. Many studies have been carried out related to academic performance by proposing to use parameters derived from educational factors themselves.
According to research that has been done [16], [17], and [18], the assessment of academic performance is influenced by factors originating from the educational side which includes, record of student semester scores. [8] stated that the use of the parameter of semester scores is relevant in conducting performance appraisals. Where the semester scores in learning period 1 60% affect performance results while 40% of semester scores in periods 2 affect academic performance results.
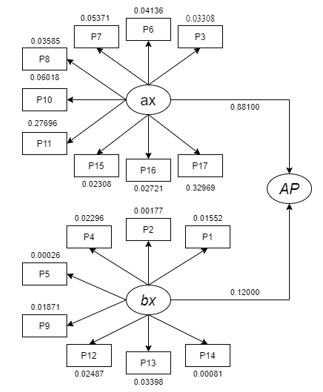 Figure 13: Similarity Structure of Assessing Academic Performance
5. Conclusion
The process of assessing the results of student academic performance is generally applied to universities using the classical method (based on performance categories). The DSM model is built using the FL method Sugeno technique which is a form of practical solution that can be used in the world of education to assess academic performance which is part of the AP evaluation process.
As the model using the FL Sugeno method provides advantages with the elastic properties. Thus, it can be adjusted to the needs of the study while still providing sharp outputs as an effective form of decision approach based on a series of fuzzy rules from the input given to the output.
The academic performance appraisal process is carried out by involving relevant seventeen parameters to the performance appraisal based on validated previous research. Parameters are grouped into fuzzy groups (ax) and conventional groups (bx). The fuzzy group (ax) is identified to have a significant effect on the assessment of academic performance compared to the conventional group (bx) with only a slight influence on the assessment process.
- A. Mueen, B. Zafar, U. Manzoor, “Modeling and Predicting Students’ Academic Performance Using Data Mining Techniques,” International Journal of Modern Education and Computer Science, 8(11), 36–42, 2016, doi:10.5815/ijmecs.2016.11.05.
- H. Almarabeh, “Analysis of Students’ Performance by Using Different Data Mining Classifiers,” International Journal of Modern Education and Computer Science, 9(8), 9–15, 2017, doi:10.5815/ijmecs.2017.08.02.
- H. Mousa, A. Maghari, “School Students ’ Performance Predication Using Data Mining Classification,” International Journal of Advanced Research in Computer and Communication Engineering, 6(8), 136–141, 2017, doi:10.17148/IJARCCE.2017.6824.
- Y.K. Salal, S.M. Abdullaev, M. Kumar, “Educational data mining: Student performance prediction in academic,” International Journal of Engineering and Advanced Technology, 8(4C), 54–59, 2019.
- A.D. Kumar, R.P. Selvam, V. Palanisamy, “Prediction of Student Performance using Hybrid Classification,” International Journal of Recent Technology and Engineering, 8(4), 6566–6570, 2019, doi:10.35940/ijrte.D8241.118419.
- D.N. Utama, Y.S. Triana, M.M. Iqbal, M. Iksal, I. Fikri, T. Dharmawan, “Decision Support Model for Mosque Renovation and Rehabilitation (Case Study: Ten Mosques in Jakarta Barat, Indonesia),” Journal of Physics: Conference Series, 978, 012057, 2018, doi:10.1088/1742-6596/978/1/012057.
- D.N. Utama, E. Rustamaji, A. Fauziyah, “Fuzzy eco-DSM for treating medical waste,” IOP Conference Series: Earth and Environmental Science, 195(1), 012050, 2018, doi:10.1088/1755-1315/195/1/012050.
- Y. Indrianingsih, “Decision Support System to Determine the Number of Production Tofu using the Fuzzy Sugeno Method (Case Study: Home Industries Tofu in Seyegan District),” Conference SENATIK STT Adisutjipto Yogyakarta, 2018, doi:10.28989/senatik.v4i0.216.
- B. Kucukaltan, Z. Irani, E. Aktas, “A decision support model for identification and prioritization of key performance indicators in the logistics industry,” Computers in Human Behavior, 2016, doi:10.1016/j.chb.2016.08.045.
- A. Setyono, S.N. Aeni, “Development of Decision Support System for Ordering Goods using Fuzzy Tsukamoto,” International Journal of Electrical and Computer Engineering (IJECE), 8(2), 1182, 2018, doi:10.11591/ijece.v8i2.pp1182-1193.
- D.N. Utama, “Fuzzy based Decision Support Model on Determining the Most Eligible Location of National Multi-Sport Event,” International Journal of Advanced Trends in Computer Science and Engineering, 9(4), 6140–6146, 2020, doi:10.30534/ijatcse/2020/286942020.
- D.N. Utama, U. Taryana, “Fuzzy logic for simply prioritizing information in academic information system,” International Journal of Mechanical Engineering and Technology, 2019.
- H.C.W. Lau, R.A. Dwight, “A fuzzy-based decision support model for engineering asset condition monitoring – A case study of examination of water pipelines,” Expert Systems with Applications, 38(10), 13342–13350, 2011, doi:10.1016/j.eswa.2011.04.158.
- S. Rajak, S. Vinodh, “Application of fuzzy logic for social sustainability performance evaluation: a case study of an Indian automotive component manufacturing organization,” Journal of Cleaner Production, 108, 1184–1192, 2015, doi:10.1016/j.jclepro.2015.05.070.
- S.H. Jafari Petrudi, M. Pirouz, B. Pirouz, “Application of fuzzy logic for performance evaluation of academic students,” in 2013 13th Iranian Conference on Fuzzy Systems (IFSC), IEEE: 1–5, 2013, doi:10.1109/IFSC.2013.6675615.
- R.S. Yadav, A.K. Soni, S. Pal, “A study of academic performance evaluation using Fuzzy Logic techniques,” in 2014 International Conference on Computing for Sustainable Global Development (INDIACom), IEEE: 48–53, 2014, doi:10.1109/IndiaCom.2014.6828010.
- G. Gokmen, T.Ç. Akinci, M. Tektaş, N. Onat, G. Kocyigit, N. Tektaş, “Evaluation of student performance in laboratory applications using fuzzy logic,” in Procedia – Social and Behavioral Sciences, 2010, doi:10.1016/j.sbspro.2010.03.124.
- V.K. Pal, V.K.K. Bhatt, “Performance prediction for post graduate students using artificial neural network,” International Journal of Innovative Technology and Exploring Engineering, 8(7), 446–454, 2019.
- L. Dole, J. Rajurkar, “A Decision Support System for Predicting Student Performance,” International Journal of Innovative Research in Computer and Communication Engineering, 02(12), 7232–7237, 2015, doi:10.15680/IJIRCCE.2014.0212015.
- M.D. Robinson, A. Oshlack, “A scaling normalization method for differential expression analysis of RNA-seq data,” Genome Biology, 11(3), 2010, doi:10.1186/gb-2010-11-3-r25.
- F. Cavallaro, “A Takagi-Sugeno Fuzzy Inference System for Developing a Sustainability Index of Biomass,” Sustainability, 7(9), 12359–12371, 2015, doi:10.3390/su70912359.
- L.C. Nikmatul Kamila, “Fuzzy Sugeno Algorithm for Clustering Document Management,” International Journal of Advanced Trends in Computer Science and Engineering, 9(1), 26–30, 2020, doi:10.30534/ijatcse/2020/05912020.
Citations by Dimensions
Citations by PlumX
Google Scholar
Scopus
Crossref Citations
- V V Izvozchikova, T E Tlegenova, V V Markovin, "Development of an intelligent learning system based on fuzzy logic." IOP Conference Series: Materials Science and Engineering, vol. 1227, no. 1, pp. 012007, 2022.
- Ditdit Nugeraha Utama, Siti Sumiyati, Irmawan Rahyadi, Norhaslinda Zainal Abidin, Norazura Ahmad, Aida Mauziah Benjamin, Wan Laailatul Hanim Binti Mat Desa, "A simple student appraisal evaluation model based on multi-stage rule fuzzy logic." In WOMEN IN PHYSICS: 7th IUPAP International Conference on Women in Physics, pp. 040010, 2023.
- Dedi Setiawan, Ditdit Nugeraha Utama, "ENHANCED DECISION SUPPORT MODEL FOR CUSTOMERS’ FUTURE PURCHASE BEHAVIOR." Journal of Southwest Jiaotong University, vol. 59, no. 3, pp. , 2024.
- Sergii Babichev, Aleksander Spivakovsky, Serhii Omelchuk, Vitaliy Kobets, "A Model for Assessing the Rating of Higher Education School Academic Staff Members Based on the Fuzzy Inference System." In Lecture Notes in Computational Intelligence and Decision Making, Publisher, Location, 2022.
No. of Downloads Per Month
No. of Downloads Per Country