
Driving Behaviour Identification based on OBD Speed and GPS Data Analysis
Volume 6, Issue 1, Page No 550-569, 2021
Author’s Name: Hussein Ali Ameen1,2,a), Abd Kadir Mahamad1,a), Sharifah Saon1, Mohd Anuaruddin Ahmadon3, Shingo Yamaguchi3
View Affiliations
1Faculty of Electrical and Electronic Engineering, Universiti Tun Hussein Onn Malaysia, Parit Raja 86400, Malaysia
2Department of Computer Engineering Techniques, Al-Mustaqbal University College, Babil 51001, Iraq
3Graduate School of Science and Technology for Innovation, Yamaguchi University, Japan
a)Author to whom correspondence should be addressed. E-mail: hussain.a.ameen@gmail.com, kadir@uthm.edu.my
Adv. Sci. Technol. Eng. Syst. J. 6(1), 550-569 (2021); ![]() DOI: 10.25046/aj060160
DOI: 10.25046/aj060160
Keywords: OBD, Vehicle-to-vehicle (V2V), GPS, Speed, Acceleration

Export Citations
Vehicle accidents, particularly in small and large urban areas, are rising tremendously day by day worldwide. As a recent research subject in automaton transportation, the subsequent collision has become a vital issue and emergency. Internet of things (IoT) and the Internet of Vehicles (IoV) have become very popular these days because of their versatility, and robust cybersecurity underpin these new connected services. Aggressive driving among improper driving behaviours is a mainly responsible cause of traffic accidents that endanger human safety and property. Identifying dangerous driving is a significant step in changing this situation by analyzing data recorded through different gathering devices. The focus of aggressive recognition research has recently shifted to the use of vehicle motion data, which has emerged as a new technique for understanding the phenomenon of traffic. As aggressive driving refers to abrupt changes in actions, it is possible to classify them based on the vehicle’s movement data. This paper presents a method to identify driving behaviours categorized into four groups: dangerous, aggressive, safe and normal behaviour to reduce the risk of accidents based on real-time data recorded from vehicles and reference data provided by previous researchers. Comparison and statistical methods have been done to determine the best way to collect driving data based on independent-samples t-test using Statistical Package for the Social Sciences (SPSS) statistics to compare the means between groups on the same continuous, dependent variable. Results have also shown that a small difference of speed between the mobile application and the On-Board Diagnostics (OBD-II) speed with t(4024.1)=1.8, p=.071, which can be considered acceptable. Furthermore, the OBD-II adapter and mobile application speed were significantly different from the independent GPS device with t(3184.9) = 10.8,p= 0 and t(4416.5)= 13.2,p= 0. Consequently, it is expected to improve drivers’ awareness of their driving behaviours.
Received: 04 December 2020, Accepted: 21 January 2021, Published Online: 28 January 2021
- S. Jiao, S. Zhang, B. Zhou, Z. Zhang, L. Xue, “An Extended Car-Following Model Considering the Drivers’ Characteristics under a V2V Communication Environment,” Sustainability, 12(4), 1552, 2020, doi:10.3390/su12041552.
- W.H. Lee, C.Y. Chiu, “Design and Implementation of a Smart Traffic Signal Control System for Smart City Applications,” Sensors, 20(2), 508, 2020, doi.org/10.3390/s20020508.
- H.A. Ameen, A.K. Mahamad, B.B Zaidan, A.A. Zaidan, S. Saon, D.M. Nor, R.Q. Malik, Z.H. Kareem, S. Garfan, R.A. Zaidan, A. Mohammed, “A Deep Review and Analysis of Data Exchange in Vehicle-to-Vehicle Communications Systems: Coherent Taxonomy, Challenges, Motivations, Recommendations, Substantial Analysis and Future Directions,” IEEE Access, 7, 158349-158378, 2019, doi:10.1109/ACCESS.2019.2949130.
- A. Memon, F.K. Shaikh, E. Felemban, “Experimental evaluation of vehicle-to-vehicle based data transfer,” in 2015 International Conference on Information and Communication Technology Research (ICTRC), 274-277, 2015, doi: 10.1109/ICTRC.2015.7156475.
- M.A. Lebre, F.Le Mouel, E. Menard, “Resilient, Decentralized V2V Online Stop-free Strategy in a Complex Roundabout,” in 2016 Ieee 83rd Vehicular Technology Conference (IEEE Vehicular Technology Conference Proceedings, 1-5, 2016, doi: 10.1109/VTCSpring.2016.7504449.
- D. Farooq, S. Moslem, R.F. Tufail, O. Ghorbanzadeh, S. Duleba, A. Maqsoom, T. Blaschke, “Analyzing the importance of driver behavior criteria related to road safety for different driving cultures,” International Journal of Environmental Research Public Health, 17(6), 1893, 2020, doi.org/10.3390/ijerph17061893.
- T. Zinchenko, Reliability Assessment of Vehicle-to-Vehicle Communication, Ph.D thesis, Technical University of Braunschweig, 2015.
- Y. Ma, Z. Zhang, S. Chen, Y. Yu, K. Tang, “A comparative study of aggressive driving behavior recognition algorithms based on vehicle motion data,” IEEE Access, 7, 8028-8038, 2019, doi: 10.1109/ACCESS.2018.2889751.
- W. Alghamdi, E. Shakshuki, T. R.Sheltami, “Context-Aware Driver Assistance System,” Procedia Computer Science, 10, 785-794, 2012, doi.org/10.1016/j.procs.2012.06.100.
- B. Yu, M. Wu, S. Wang, W. Zhou, “Traffic simulation analysis on running speed in a connected vehicles environment,” International Journal of Environmental Research Public Health, 16(22), 4373, 2019, doi: 10.3390/ijerph16224373.
- H.A. Ameen, A. K.Mahamad, S. Saon, D.M. Nor, K. Ghazi, “A review on vehicle to vehicle communication system applications,” Indonesian Journal of Electrical Engineering and Computer Science, 18(1), 188-198, 2020, doi.org/10.11591/ijeecs.v18.i1.pp188-198.
- H. Tchouankem, “Characterization of Intersection Topologies in Urban Areas for Vehicle-to-Vehicle Communication,” in 2016 IEEE 84th Vehicular Technology Conference (VTC-Fall), 1-5, 2016, doi: 10.1109/VTCFall.2016.7880931.
- F. Cardoso, A. Serrador, T. Canas, “Algorithms for Road Safety Based on GPS and Communications Systems WAVE,” Procedia Technology, 17, 640-649, 2014, doi.org/10.1016/j.protcy.2014.10.187.
- A. M. Orozco, S. Cespedes, R. Michoud, G. Llano, “Design and simulation of a collision notification application with geocast routing for car-to-car communications,” European Transport Research Review, 7(36), 2015, doi.org/10.1007/s12544-015-0185-1.
- M. El-Said, V. Bhuse, A. Arendsen, “An Empirical Study to Investigate the Effect of Air Density Changes on the DSRC Performance,” Procedia Computer Science, 114, 523-530, 2017, doi.org/10.1016/j.procs.2017.09.025.
- L. Dorn, Driver behaviour and training, Routledge, 2017.
- M. G. Jasinski, F. Baldo, “A Method to Identify Aggressive Driver Behaviour Based on Enriched GPS Data Analysis,” in the GEOProcessing 2017: The Ninth International Conference on Advanced Geographic Information Systems, Applications, and Services, 97-102, 2017
- J. H. Ogle, Quantitative assessment of driver speeding behavior using instrumented vehicles, Ph.D thesis, Civil Engineering, Georgia Institute of Technology, 2005.
- G. Mantouka, E.N. Barmpounakis, E.I. Vlahogianni, “Identifying driving safety profiles from smartphone data using unsupervised learning,” Safety Science, 119, 84-90, 2019, doi.org/10.1016/j.ssci.2019.01.025.
- O. Bagdadi, A. Várhelyi, “Jerky driving—An indicator of accident proneness?,” Accident Analysis & Prevention, 43(4), 359-1363, 2011, doi.org/10.1016/j.aap.2011.02.009.
- A.B. Ellison, S.P. Greaves, M.C.J. Bliemer, “Driver behaviour profiles for road safety analysis,” Accident Analysis & Prevention, 76, 118-132, 2015, doi.org/10.1016/j.aap.2015.01.009.
- C.M. Martinez, M. Heucke, F. Wang, B. Gao, D. Cao, “Driving Style Recognition for Intelligent Vehicle Control and Advanced Driver Assistance: A Survey,” IEEE Transactions on Intelligent Transportation Systems, 19(3), 666-676, 2018, doi: 10.1109/TITS.2017.2706978.
- O. Raz, H. Fleishman, I. Mulchadsky, System and method for vehicle driver behavior analysis and evaluation, ed: Google Patents, 2008.
- E.M. Carboni, V. Bogorny, “Inferring Drivers Behavior through Trajectory Analysis,” Advances in Intelligent System and Computing, 837-848, 2015, doi.org/10.1007/978-3-319-11313-5_73.
- F. Tango, M. Botta, “Real-Time Detection System of Driver Distraction Using Machine Learning,” IEEE Transactions on Intelligent Transportation Systems, 14(20), 894-905, 2013, doi: 10.1109/TITS.2013.2247760.
- A. Aksjonov, P. Nedoma, V. Vodovozov, E. Petlenkov, M. Herrmann, “A Novel Driver Performance Model Based on Machine Learning,” IFAC-PapersOnLine, 51(9), 267-272, 2018, doi.org/10.1016/j.ifacol.2018.07.044.
- A. Daniel, D. C. Popescu, S. Olariu, “A Study of Beaconing Mechanism for Vehicle-to-Infrastructure Communications,” in 2012 IEEE International Conference on Communications (ICC), 7146-7150, 2012, doi: 10.1109/ICC.2012.6364667.
- F. Visintainer, L. Altomare, A. Toffetti, A. Kovacs, A. Amditis, “Towards Manoeuver Negotiation: AutoNet2030 Project from a Car Maker Perspective,” Transportation Research Procedia, 14, 2237-2244, 2016, doi.org/10.1016/j.trpro.2016.05.239.
- S. Eckelmann, T. Trautmann, H. Ußler, B. Reichelt, O. Michler, “V2V-Communication, LiDAR System and Positioning Sensors for Future Fusion Algorithms in Connected Vehicles,” Transportation Research Procedia, 27, 69-76, 2017, doi.org/10.1016/j.trpro.2017.12.032.
- J.E. Meseguer, C.T. Calafate, J.C. Cano, P. Manzoni, “DrivingStyles: A smartphone application to assess driver behavior,” in 2013 IEEE Symposium on Computers and Communications (ISCC), 000535-0005402013, 2013, doi: 10.1109/ISCC.2013.6755001.
- J. Zaldivar, C. T. Calafate, J. C. Cano, P. Manzoni, “Providing accident detection in vehicular networks through OBD-II devices and Android-based smartphones,” in 2011 IEEE 36th Conference on Local Computer Networks, 813-819, 2011, doi: 10.1109/LCN.2011.6115556.
- S.H. Lee, S. Lee, M.H. Kim, “Development of a Driving Behavior-Based Collision Warning System Using a Neural Network,” International Journal of Automotive Technology, 19(5), 837-844, 2018, doi.org/10.1007/s12239-018-0080-6.
- S.H. Chen, J.S. Pan, K. Lu, “Driving behavior analysis based on vehicle OBD information and adaboost algorithms,” in Proceedings of the international multiconference of engineers and computer scientists, 1, 18-20, 2015.
- Freematics. (2017). Freematics ESP32 OBD Kit. Available: https://freematics.com/store/index.php?route=product/product&product_id=87
- Adafruit. (2017). Adafruit ultimate gps breakout – 66 channel w/10 hz updates. Available: https://www.adafruit.com/product/746
- M. Rohani, Bus driving behaviour and fuel consumption, Ph.D thesis, Faculty of Engineering, Science & Mathematics University of Southampton, 2012.
- S.G. Klauer, T.A. Dingus, V.L. Neale, J.D. Sudweeks, D.J. Ramsey, “The impact of driver inattention on near-crash/crash risk: An analysis using the 100-car naturalistic driving study data,” U.S. Dept. Transp., Nat. Highway Traffic Saf. Admin., 2006, doi:10.1037/e729262011-001.
1.Introduction
Population growth and the rapid promotion of the new urban motorization process have led to a rise in vehicles in recent years. The lack of efficient traffic management has led to traffic problems such as traffic congestion, traffic accidents, air pollution and energy consumption, which become an ever-increasing problem in the worldwide [1-5]. The challenges that a driver faces every day are growing dramatically due to the increasing worldwide demand for transportation. The situation review states that those significant casualties are due to improper driving behaviours. According to study figures for injuries, 75% of lethal accidents are caused by human factors like lack of attention, loss of orientation, tiredness, stress and medical condition. The unexpected behaviour is the cause of the 24% of total accidents, and only 0.7% of injuries are attributed to technological failures (Figure 1) [6-9]. Vehicle to Vehicle (V2V) Communication plays an important role in smart transportation services, be the main factor for the success of Intelligent Transportation Systems (ITSs), and able to exchange a variety of information including acceleration, speed, direction and location forthwith with nearer vehicles and connected infrastructure [2, 10]. Connected vehicle technologies are nearly able to take off, commercially viable and used by the overall public in a vast selection of conditions. Technological advancements are
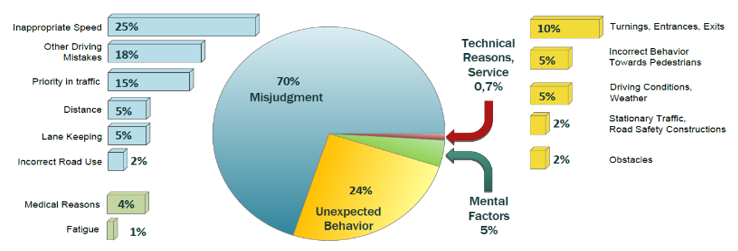 Figure 1: Accident causes, adapted from [7]
rushing on the automated technology time toward this destination [11].
Safety-based V2V applications can generate high-interest applications in road safety as a mechanism for prevention in critical circumstances. Implementing intersection collision avoidance coupled with driver assistance systems, could help provide a look around the corner effect, even in highly obstructed channel conditions [12-14]. The National Highway Traffic Safety Administration (NHTSA) sets out guidance on how different levels of vehicle automation can minimize vehicle accidents and how the use of short-range on-board sensors coupled with V2V technologies can help facilitate contact between vehicles [15]. Driver behaviour modelling is an important part of understanding the driver and evaluating traffic flow within the traffic system. The interactions with time and space between the main components of vehicular traffic can be seen as a traditional human-machine system [16, 17]. A significant aspect that quickly contributes to unsafe driving is violent driving behaviour. The press and the public have also given ample attention to this dangerous conduct [8]. In the last ten-year period, speeding has consistently been cited as a contributing factor in most fatal crashes which have been wholly or partially the fate of speeding behaviour. With real-time information, forthcoming driving behaviour could be predicted [17, 18]. Monitoring driving behaviour is not enough for ensuring driver safety. On the contrary, the achievement of safe and efficient driving needs to recognize reckless or “accident-prone” drivers who could encourage more successful traffic safety work coupled with the most appropriate incentives to avoid them [19, 20]. In this paper, we try to use a method for modelling drivers’ acceleration to quantify and analyse individual driver behaviour using online data recorded from instrumented vehicles using different data collection devices. Experimental results are presented using graphs and analysis for multiple scenarios. The major contributions of this work are summarized as follows:
- Defining desired safe behaviours through direct observation
- Observing behaviour and quantifying safe/unsafe or at-risk behaviour
- Monitoring and evaluating changes in safe behaviour, performance; and providing feedback.
This paper is organized as follows. Section 2 presents related work while in Section 3, along with the system description, we present tools and software used for driving behaviours data collection using the instrumented vehicle. In Section 4, show study sites and research participants. In Section 5, the main system workflow explained. In contrast, in Section 6, we introduce the numerical results and statistical analysis of speed and acceleration data on the relaying strategies and the optimization results. Finally, we conclude in Section 7.
2. Related Work
Driving behaviour is the subject of comprehensive research. A growing number of studies have used technological advancements and gained particular attention to enhance our understanding of driver behaviour due to the advent of emerging technologies to gather more accurate and richer data [17, 21]. Driving event is generally understood as maneuvers occurring during the driving task, such as acceleration or deceleration, lane change and turning, which can be used to identify driving style [22]. Reference [23] indicated that data obtained from a collection of vehicle sensors could be analyzed to recognize a series of driving maneuvers using certain recognition methods and that the parameters of these driving maneuvers could be extracted and then used to classify driver characteristics or determine the abilities of the driver. In [24], the authors suggest a method to classify driver behaviours that take into account three acceleration and direction anomalies: a) sudden movements (acceleration and deceleration); b) shifts in lanes; c) excessive speed. Therefore, the algorithm classifies drivers into the following categories: cautious, distracted, hazardous and very risky. A non-intrusive method for a real-time framework to detect and identify driver distraction was presented in reference [25], using Machine Learning (ML) algorithms and dynamic vehicle data as inputs to the model. Authors in [26] developed a driver model capable of predicting each normal driver driving on a specific road segment with a reasonable degree of accuracy based on nonlinear regression methods using Artificial Neural Network (ANN). The primary benefit of this form of experiment is the tremendous degree of control over the factors that may impact driving behaviour. In a designed environment, however, controlled experiments are most often conducted. That makes it more difficult for the effects of real traffic to be transferred [6].
Several works about the data exchange efficiency between vehicles and roadside infrastructure are investigated in [27] using a beaconing mechanism in the connection setup. Studies in [21] have employed GPS, accelerometers, video cameras and distance sensors. Authors in [4] assessed WiFi-based V2V data collection experiments to communicate with other vehicles. Experiments conducted on very slow speed vehicles with a maximum range of 100 ft. Reference [28] introduces the AutoNet2030 system used to drive convoys.
Furthermore, [29] presents an inquiry into V2V contact and data collection based on commercial on-board units (OBU) and incorporated into two research vehicles for light detection and ranging (LiDAR). Some existing services are already seeking to use the OBD interface for various purposes. The Driving Styles approach is provided in [30]. The proposed architecture incorporates data mining techniques and neural networks, classification of driving style is produced by studying driver activity along each path. Specifically, based on OBD parameters such as engine rpm, acceleration and revolutions per minute (RPM). A neural network based algorithm was introduced by the authors that can characterize the type of road on which the vehicle is traveling, as well as the degree of aggression of each driver. In [31], authors propose an Android application that tracks the vehicle via an OBD interface, allowing accidents to be detected.
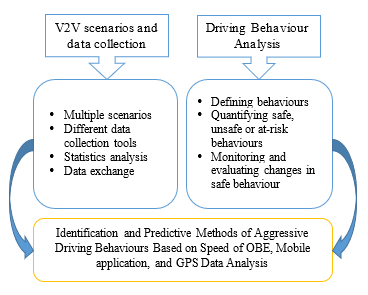 Figure 2: Study of gap from the related articles
Experimental findings using a real vehicle show that in less than 3 seconds, the application is able to respond to incidents in a very short time, validating the effectiveness of smartphone-based solutions to improve road safety. Moreover, [32] proposed a driving behaviour-based Collision Warning System (CWS) study to determine the collision risk level, according to its driving behaviour. In this experiment, the radar used was the ESR 1.0 model (Delphi), the capacity to output up to 174 m. The driving vehicle’s speed, acceleration pedal, and brake pedal values were recorded using the OBD. Data output from the radar and OBD, through the Vector and the CANoe programs via the VN5610 network interface. These important studies have shown that the stability, protection, and efficiency of traffic flow are dramatically improved based on driving behavior communication technology. Based on the literature review, it can be seen that the assessment of drivers’ behaviours using their trajectory data is a fresh and open research field. Most studies related to driving behaviours in terms of acceleration and deceleration are concluded after making an experimental trip where drivers’ behaviour is calculated and recognized. Furthermore, as far as searching was feasible, it was a lack of studies that address the identification of aggressively driving based on real time data collection and analysis using different devices in a near real time. In our paper, we aimed to clarify the difference between OBD, GPS and mobile application to provide real measurements for further study and solutions that can be used (Figure 2).
3. Driving Behaviour Data Collections Tools
Driving behaviour recognition is a fundamental prerequisite for traffic studies and generates benefits, especially in three main areas: analysis of road safety; simulation of microscopic traffic; and ITSS. For various tasks in transport engineering, driving behaviour studies are of great benefit. That involves the collection of data both for statistical analysis and for driving model recognition and modelling parameter estimation.
Driving data are collected using an instrumented vehicle, as shown in Figure 3, equipped with GPS, microcontroller and other sensors. Many instruments are available to monitor driving behaviour, some of which work on the roadside and others on board. First, while driving on an instrumented location, an unconscious driver is tracked in the case of roadside sensors; different technologies can be used to track driving behaviours. Second, in the case of on-board sensors mounted on an instrumented vehicle, more extended measurements are allowed under more versatile experimental conditions, with the prospect of observing those maneuvers of particular interest in a controlled manner. An instrumented vehicle can be defined as a standard vehicle, the kinematics of which are registered for the study. In this system, the driving behaviours data collection have been gathered and analysed using on-board sensors.
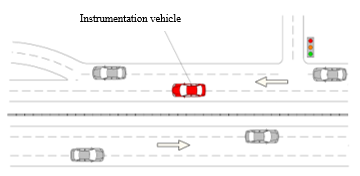 Figure 3: Instrumented vehicle for data collection
3.1. On-board Diagnostics Adapter
On-Board Diagnostics OBD-I refers to the self-diagnostic and reporting capacity of a vehicle used in modern vehicles compliant with standard computer protocols. This adapter enables the vehicle network to be accessed by a computer. In service, it is similar to a computer modem or a gateway, that transfers messages from one protocol to another; the data normally flows both ways to and from the Electronic Control Unit (ECU). Current OBD system, or called OBD-II replaces the deficient former system, namely OBD-I. The main advantage of OBD-II is its standardization. In other words, only one set of OBD-II scanning instruments can perform the diagnosis and can search for a number of vehicles fitted with and assisted by this adapter [33]. There are 16 pins in the system socket which are normally mounted below the driving plate. Nine of these 16 pins have fixed functions, and the remaining pins are left at the discretion of the car’s manufacturer. Since the OBD-II interface is not a normal general computer system, Bluetooth and Wi-Fi adapters were built for data collection to accommodate the PC to obtain vehicle status as shown in Figure 4 which used in the data collection phase.
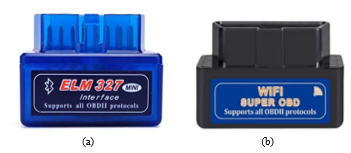 Figure 4: OBD-II adapter, (a) ELM327 Bluetooth, (b) ELM327 Wi-Fi
Besides, the proposed system also uses the Freematics ESP32 OBD-II Package. “This kit, together with the 1.3” OLED monitor and Freematics OBD-II UART Adapter, is based on Freematics Esprit, the Arduino compatible ESP32 dev board, as shown in Figure 5. This kit is simple to start yet has a lot of potential for prototyping advanced connected car applications. The board is completely plug-and-play. Freematics Esprit is in the same form of Arduino UNO board with additional pinouts for I2C and two serial UARTs [34].
 Figure 5: Freematics ESP32 OBD kit
3.2. Torque Mobile Application
Torque is a software used as a diagnostic tool for any device that runs the Android operating system. When used in conjunction with OBD-II Bluetooth or Wi-Fi adapters for Android (Figure 6), it allows to access the many sensors within a vehicle management system and enable to view and clear trouble codes. This device is a cutting-edge Android Mobile diagnostic and performance scanner application for vehicles. This application can use internal cell phone GPS systems along with other sensors that graph useful acceleration, braking and overall vehicle performance data.
 Figure 6: Torque pro’s data logging and uploading window
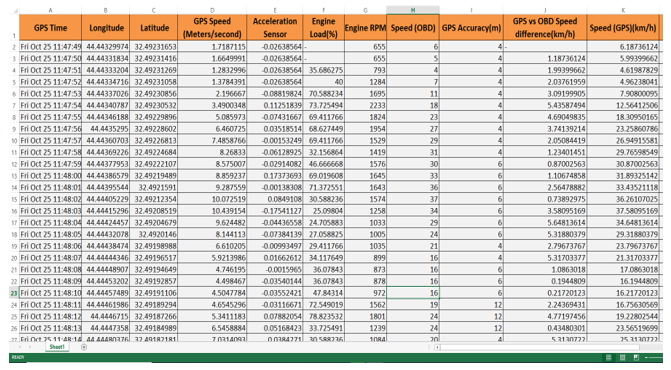 Figure 7: Data recorded with Torque pro’s application
Different parameters added to the Torque software such as GPS Time, longitude, latitude, GPS speed (Meters/second), acceleration, engine load, engine RPM, speed (OBD), GPS Accuracy (m), GPS vs OBD Speed difference (km/h) and finally GPS speed (km/h). All these parameters are used in the analysis phase of the proposed system to monitor each trip. After setting everything in the application, Torque begins creating logs of the data by click Start Logging on the display screen to track the information and log all Parameter Identifications (PIDs) that were selected. Eventually, to save all logs recorded click Stop Logging on the display screen, choose the CSV (Comma Separated Values) format as shown in Figure 7. These data are used for further analysis and subsequent comparisons to determine the drivers’ behaviours based on the information recorded from the acceleration of the drivers.
3.3. Digital Dashboard GPS Pro Application
Digital Dashboard is a performance tool for any device that runs the Android operating system. It can track speed, distance, time, location, and get start time, time elapsed, average speed, maximum speed, altitude and longitude. This software is the second type of software used in the design of the proposed system and the Torque software to compare the information obtained from mobile GPS and OBD-II adapter to determine the best way to extract data to predict the behaviour of the driver. The main features of this application are to save tracking information with map integration of any trip without the need for direct connection to the vehicle as shown in Figure 8.
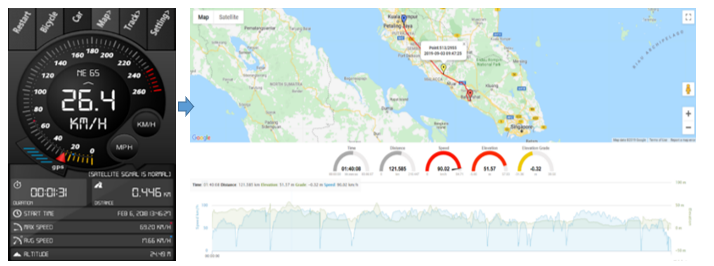 Figure 8: Map integration of digital dashboard GPS Pro software
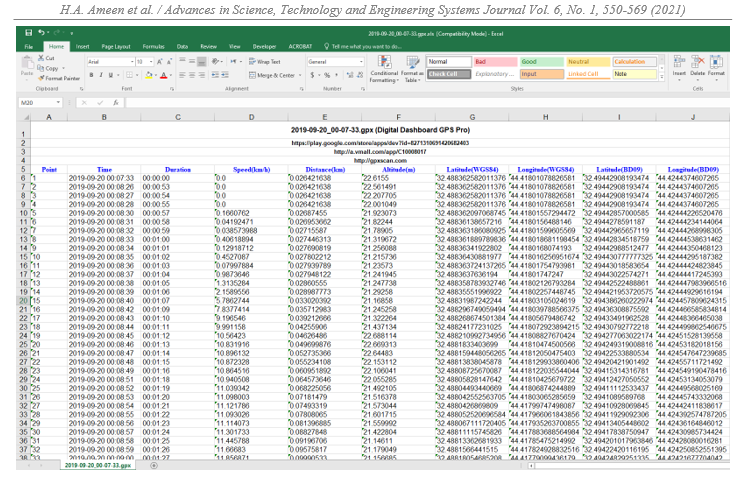 Figure 9: Data recorded with digital dashboard GPS pro application
This application also provided complete information related to the experiments (time, speed, distance, Latitude and Longitude) as shown in Figure 9. The main difference between dashboard GPS Pro application and the Torque does not use the OBD-II adapter to record and save the data since it depends on the GPS signal available in the smartphone. The goal is to compare the data recorded in terms of accuracy and efficiency to use it in the proposed system to define drivers’ behaviours.
3.4. Adafruit Ultimate GPS Breakout System
The Global Positioning System (GPS) is a radio navigation system based on satellites which provide a GPS receiver with geolocation and time information. The GPS does not require the user to send any data and functions independently of any telephonic or internet reception. However, these technologies can enhance the utility of GPS positioning information. The GPS provides military, civil, and commercial users around the world with essential positioning capabilities. An Adafruit Ultimate GPS Breakout – 66 channel w/10 Hz updates – Version 3 used in the data collection phase for further research designed around the MTK3339 chipset, a high-quality GPS module with an outstanding high-sensitivity receiver that can track up to 22 satellites on 66 channels (-165 dBm tracking), and a built-in antenna [35]. The system can build up to 10 position updates a second for high speed, high sensitivity logging, or tracking. Next, we can go forward and wired up the GPS device with the microcontroller as shown in Figure 10.
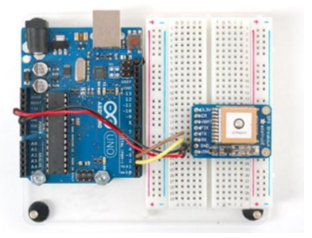 Figure 10: Adafruit ultimate GPS breakout Arduino wiring
Each GPS satellite transmits a radio signal continuously containing the current time and its location data. GPS receiver tracks and uses several satellites to assess their positions and the time it takes for the signals to reach them. At a minimum, four satellites must view the receiver for it to get a location fix. We used the Adafruit Ultimate GPS Breakout connected to an Arduino as our GPS receiver. It’s very easy to set up by installing the Adafruit GPS library on the Arduino then proceed with parsing sketch which gave us all information required for the experiments to define driving behaviours as shown in Figure 11.
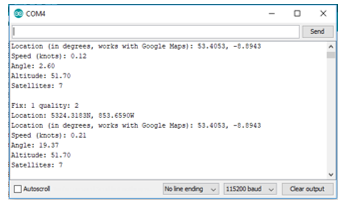 Figure 11: Arduino serial monitor for the Adafruit ultimate GPS breakout
4. Sites Study and Research Participants
In driving behaviour experiments, data are collected and extracted using different devices to quantitatively described and discussed for implementing in the proposed system. An instrumented vehicle was used to collect data on actual roads fitted with different sensors that detect the vehicle’s speed, position, acceleration or deceleration, the RPM and total distance travelled by the vehicle. Data for driver behaviours were continuously observed in different periods of time. Ten drivers who participated in this study during data collection with different types of vehicles and scenarios using two periods for gathering driving data. Figure 12 shows the road layout examples with varying sites of study from Google maps.
The first data collection was carried out in Malaysia for two months from mid of July to September 2019 recorded in Batu Pahat and Kuala Lumpur. In these experiments three drivers in three vehicles with a total of eight experiments done using (i) Perodua MyVi, 1.3 EZI – Facelift – 4 SP automatic, manufacture year is 2009, (ii) Toyota Estima X – 6 SP automatic, manufacture year is 2007 and (iii) Proton WAJA 1.6 – 5 SP automatic, manufacture year is 2006) (Figure 13).
The second data collection was carried out in Iraq for two months from December 2019 until end of January 2020 recorded in Baghdad and Babylon. Involve of seven drivers, three vehicles with a total of fifteen experiments; (i) Hyundai Sonata 2.4 – 6 SP automatic, manufacture year is 2015, (ii) Hyundai Santa Fe 3.5 – 6 SP automatic, manufacture year is 2011, (iii) Renault Safrane 2.0 – 5 SP automatic, manufacture year is 2010 (Figure 14). Drivers rode along a predetermined route and calculated and reported data on the driver’s normal driving behaviour. In Batu Pahat, Malaysia, field experiments were carried out using mobile software to record driving styles to collect data for vehicle speeds of 10 and 20 km/h. Moreover, tests at an intersection on an urban road with a speed limit of 30 km/h extracted the vehicle’s deceleration rate when the driver followed a lead vehicle and slowed down and then stopped at a stoplight. We conducted field experiments within UTHM to collect data for vehicle speeds between 30 and 50 km/h.
 Figure 12: Several study sites for data of driving behaviours.
- Produa MyVi (b) Toyota Estima
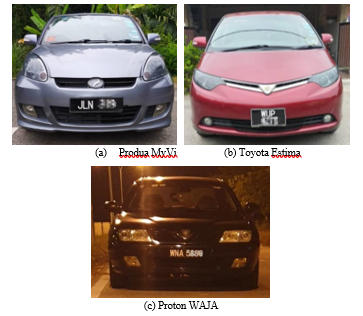 Figure 13: Vehicles used in this research in Malaysia
As with the previous studies, the experimental procedures were the same. At the time that, it slowed down behind a lead vehicle and stopped at a predefined point, we extracted the deceleration rates of the driver’s vehicle. An intersection on a rural road with a speed limit of 40 km/h (one lane in each direction) was selected. Next, vehicle’s speed to more than 60 km/h. The data collection process took place on the highway between Batu Pahat, Johor and Kuala Lumpur in Malaysia to collect data that represent high speed for analysis and definition of drivers’ behaviours.
Moreover, all experimental procedures were repeated the same as the previous experiments, using different data collection types and done in other places. In the second period of the experiments that were in Iraq, we carried out the same scenarios as in Malaysia with different drivers, vehicles and devices used, noting that the steering wheel in the two countries is different. Still, this point emphasized in our experiments since the main goal is to collect driving data using different devices to reach the best, fastest and least expensive device to build the final system in the next steps, as it is mainly based on integrating drivers’ behaviours with the V2V system. Several types of data collection devices were used for drivers in different places, as shown in Table 1. It is found that drivers tend to be more unstable and sometimes aggressive in some situations, depending on the vehicles and the road. We propose an assessment method of driver behaviour to overcome these disadvantages. We evaluate the driver behaviour based on real behaviour observed in an experiment (Figure 15) instead of using estimated experimental data since the use of field experiment data for the driving behaviour can be fully reproduced which can be collected from different road environment.
In different road traffic scenarios, driving activity data may be obtained from one participant, which is used for the calculation, since the participant does not receive feedback about his/her exposure to the target situation. During a brief period of driving, an experiment was carried out to observe the driving profile. The behavior discussed in this study relates to speed, acceleration and driver control of the accelerator pedal. The data available from the OBD-II adapter used in the study are date, time, vehicle speed using an OBD adapter (km/h), vehicle speed using GPS (km/h), engine RPM (r/min), distance travelled (m), and vehicle position (latitude, longitude).
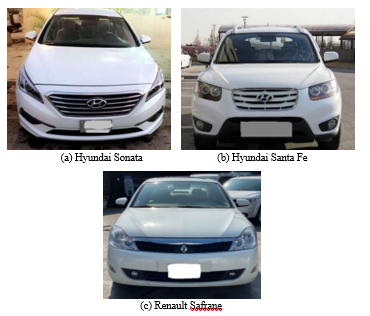 Figure 14: Vehicles used in this research in Iraq
Table 1: Devices used for driving behaviours data collection
| Data provided from devices | ||||||||||
| Device type | Required mobile application | Speed (OBD-II) | Speed (GPS) | Engine RPM | Engine Load (%) | Acceleration Sensor | Time Duration | Longitude | Latitude | Distance travelled |
| ELM327 Bluetooth or Wi-Fi | P | P | P | P | P | P | P | P | P | P |
| Freematics ESP32 OBD Kit | P | P | P | P | P | P | ||||
| Arduino + OBD-II cable | P | P | P | P | P | P | ||||
| Arduino + Adafruit GPS | P | P | P | P | P | P | P | P | ||
| Digital Dashboard GPS Pro | P | P | P | P | P | P | P | |||
| Arduino + Adafruit GPS+ OBD-II Cable | P | P | P | P | P | P | P | P | P | |
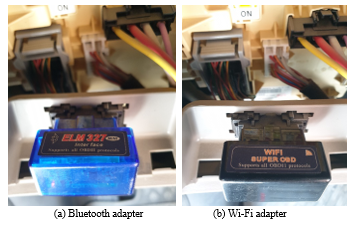 Figure 15: Installation of OBD-II adapter inside the vehicle
An accelerator pedal position (%) referring to a percentage of pedal movement from an existing position is secondary data required to validate the OBD-II adapter’s data. The zero percent of the accelerator pedal position means that the pedal was disengaged, while the 100 percent pedal position indicates that the accelerator pedal was completely pressed (Figure 16). Since it is possible to obtain the acceleration and deceleration during the driving period using engine diagnostic and by analyzing the speeds that obtained, it is possible to determine the driver’s general behaviour, whether it is dangerous or safe. The accelerator pedal is closely related to the fuel used, as it is related to the engine’s fuel flow control. This project does not clarify the mechanical components’ specifications, as it is out of the analysis scope.
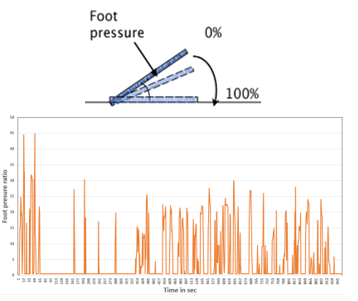 Figure 16: Accelerator pedal position diagram recorded from OBD-II adapter
5. Data Processing
The driver’s behaviour described in this work refers to an individual driving operation using various test vehicles. The behaviour mentioned was the usual feat that the driver often controls (speed, acceleration, accelerator pedal press). Initially, it should mention the following three concepts regarding the final design: speed, velocity, and acceleration to use in the proposed system to determine the driver’s behaviour while driving. Speed refers to the distance travelled during a period of time. Speed is a scalar quantity, and it is measured in units of distance divided by time. The commonly used formula for speed calculates average speed rather than instantaneous speed. In contrast, the instantaneous speed shows the speed at any given moment of the trip, as shown on the vehicle’s speedometer. Therefore, in the proposed system, we rely on the current speed. Velocity refers to the rate at which, in a certain direction, an object changes location. It is determined by the displacement of space in a specific direction per unit of time. Directional velocity matters in the short term, but speed does not. In the equation, the instantaneous velocity shown in (1).
![]() represents the change in distance (final – initial), and represents the change in time. Acceleration is a measure of how speed shifts rapidly. Acceleration is a vector quantity, like velocity, so any change in a moving body’s direction is an acceleration, too. An increase in the magnitude of a moving body’s velocity called a positive acceleration; a decrease in speed called negative acceleration. The acceleration expression is shown in (2).
represents the change in distance (final – initial), and represents the change in time. Acceleration is a measure of how speed shifts rapidly. Acceleration is a vector quantity, like velocity, so any change in a moving body’s direction is an acceleration, too. An increase in the magnitude of a moving body’s velocity called a positive acceleration; a decrease in speed called negative acceleration. The acceleration expression is shown in (2).
![]() is the change of the velocity, which is equal to the difference between the initial speed and the final speed over time , representing a change in time. To calculate the instantaneous behaviour of each driver, different OBD-II PIDs codes are used to request data from a vehicle to define driving style. The most commonly PIDs are defined in OBD library and used in the proposed system presented in Table 2. The adapter used can be plugged directly into the OBD-II port of the vehicle, providing a high efficiency module serial data interface (UART or I2C) and easy (up to 100Hz) access to all OBD-II PIDs available in the vehicle ECU.
is the change of the velocity, which is equal to the difference between the initial speed and the final speed over time , representing a change in time. To calculate the instantaneous behaviour of each driver, different OBD-II PIDs codes are used to request data from a vehicle to define driving style. The most commonly PIDs are defined in OBD library and used in the proposed system presented in Table 2. The adapter used can be plugged directly into the OBD-II port of the vehicle, providing a high efficiency module serial data interface (UART or I2C) and easy (up to 100Hz) access to all OBD-II PIDs available in the vehicle ECU.
Table 2: OBD-II PIDs details used in the system
| Mode (hex) | PID (hex) | Data bytes returned | PID command | Unit | Description |
| 01 | 0C | 2 | PID_RPM | RPM | Engine RPM |
| 01 | 0D | 1 | PID_SPEED | Km/h | Vehicle speed |
| 01 | 1F | 2 | PID_RUNTIME | Sec | Engine run time |
| 01 | 21 | 2 | PID_DISTANCE | Km | Distance traveled |
Engine start date and time, second-by-second vehicle location (latitude and longitude), heading, and speed are monitored by the onboard equipment. The equipment also provides up to ten engine and emission-related parameters directly connected to the OBD-II engine computer port from the onboard diagnostic system. For each engine ignition event, the equipment starts and saves a trip
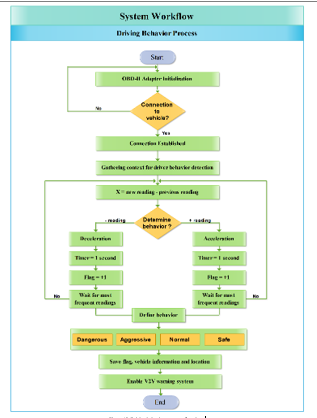 Figure 17: Driving behaviours system flowchart
file. The trip file remains open recording second-by-second operations data until the vehicle operation stops and the driver shuts off the engine. This phase is done to check the research requirement, the restriction and the time needed to complete the research, then to develop a method to select the destination vehicle for the transmission of information gathered by the proposed system using wireless communication to exchange information between vehicles and to notify the driver of the aggressive drivers on the road. The first requirement for this calculation is to identify the subject driver with some certainty. The second requirement is to obtain valid and reliable measurements of speeding behaviour performance. Now to test the proposed method, firstly, the system defines drivers’ immediate behaviour whether in acceleration or deceleration by taking a set of readings (5, 10 or any predefined value) in each second based on sensors used where Δt between any consecutive readings is one second. Next, the microcontroller converts vehicle speed (km/h) to acceleration values (m/s2) by taking advantage of the instantaneous values in Δt. After that, these values are stored with a special identifier to compare with the reference table to classify the behaviour according to the recorded values. Next, these data forwarded and stored in a matrix to find out the most frequent values and weighted as a momentary behaviour for that driver during the time period that passed (Figure 17).
The main program workflow represents the procedure of the driving behaviours data collection and identification process. Since the OBD does not have the User Interface (UI) to communicate with the driver, the proposed system would use an LCD screen to display the driving information and provide a driver-based V2V system collision warning. If the nearby vehicle can pass safely, the ‘safe’ signal is displayed. If the passing vehicle need to be aborted because it is unsafe, a ‘not safe’ signal displayed. This system gets the driving information of the surrounding vehicles using wireless transceiver device. We choose the nRF24L01+ PA LNA wireless transceiver. The nRF24L01+ PA LNA is common in the market and can be obtained at a very low price. It provides much better coverage than other devices. It can communicate over a four-pin serial peripheral interface with a maximum data rate of 10 Mbps. The power amplifier (PA) enhances the power of the signal, whereas the low-noise amplifier (LNA) amplifies the weak signal from the antenna to a more useful level to expand the transmission range of the antenna (to approximately 1000 m). Furthermore, all readings also stored in the form of flags in the Secure Digital (SD) card connected to the microcontroller to save all driving data for each day. As a result, drivers are required to increase awareness of their driving behaviour, as well as to alert transport and insurance providers of each driver’s way of driving.
6. Numerical Results and Discussions
6.1. Speed collection and analysis
The speed collector devices used in experimental vehicles are the Freematics ESP32 OBD-II kit, ELM327- OBD-II Bluetooth and Wi-Fi adapter, Adafruit ultimate GPS breakout system and Digital dashboard GPS based on the mobile application. Based on the rotation speed of the vehicle wheels, the OBD-II speed is reported directly from the vehicle engine, while the speed recorded by a GPS system and mobile application based on sequential vehicle positions are used to validate the OBD-II speed. The investigation found a delay in speed data from location-based devices (Adafruit ultimate GPS breakout system and digital dashboard GPS pro application) compared to OBD-II adapter speed. This delay is known as the ‘transit-time delay’ which is used to triangulate location by the ground-based GPS receiver. The comparison between speeds was plotted graphically as shown in Figure 18.
 Figure 18: Comparison of OBD-II adapter, mobile application and GPS device speed
The independent-samples t-test using Statistical Package for the Social Sciences (SPSS) statistics compares two groups’ means on the same continuous, dependent variable. In SPSS Statistics, we separated the groups for analysis by creating a grouping variable called a type of device used together with the recorded speed in real time. Descriptive statistical analysis was performed in SPSS and used to determine the extent of any differences between OBD-II adapters, GPS device and mobile application speed for all vehicles used in these experiments as shown in Table 3. It was found that the trend in OBD-II adapter speed was similar to that of mobile application speed data with some differences compared to the GPS device. As can be seen from the Table 3, the mean, standard deviation and skewness of the speed recorded by OBD-II adapter ( ) and mobile application ( , , ) which it can be observed that the results are close, with some variations from the GPS device ( , , ). Moreover, from observations the highest speed recorded by the OBD-II adapter (124 km/h) while the highest speed recorded by the remaining devices is almost the same (116.56 km/h and 117 km/h) for mobile application and GPS device respectively.
Table 3: Descriptive statistics of speed factor of OBD-II adapter, mobile application and GPS
| Speed factor | OBD-II adapter | Mobile application | GPS |
| Mean | 42.26727273 | 40.06415152 | 31.62424242 |
| Standard Error | 0.75732929 | 0.708743157 | 0.62654144 |
| Median | 35 | 34.585 | 26 |
| Mode | 0 | 0 | 24 |
| Standard Deviation | 30.76286118 | 28.78928315 | 25.45023361 |
| Sample Variance | 946.3536281 | 828.8228242 | 647.7143907 |
| Kurtosis | -0.227014659 | -0.221509659 | 2.041838842 |
| Skewness | 0.75352705 | 0.738426854 | 1.489783928 |
| Range | 124 | 116.56 | 117 |
| Minimum | 0 | 0 | 0 |
| Maximum | 124 | 116.56 | 117 |
| Sum | 69741 | 66105.85 | 52180 |
| Count | 1650 | 1650 | 1650 |
Furthermore, a detailed analysis was performed to find the similarities and differences between each of the devices used in the data collection of driving behaviour experiments. The analysis was carried out by comparing the OBD-II adapter speed and digital dashboard pro to find the individual value errors between them, as shown in Figure 19. Descriptive statistics and an independent T-test analysis were performed to determine the similarity of the OBD-II adapter and mobile application based speed profiles. The results are shown in Table 4 and Table 5. There was no significant difference in speeds recorded from experiments between OBD-II adapter speed ( , ) and digital dashboard pro ( , ); .
Results show that device type in these experiments does not affect speed profiles at .05 level of significance. A small difference in the mean speed of OBD-II adapter and mobile application can be considered acceptable.
Table 4: OBD-II adapter and mobile application speed statistics
| Statistics | |||||
| Device type | N | Mean | Std. Deviation | Std. Error Mean | |
| Speeds recorded | OBD-II adapter | 2042 | 39.0984 | 28.80644 | .61485 |
| Digital dashboard pro | 2037 | 37.4984 | 27.76627 | .63953 | |
 Figure 19: Comparison of OBD-II adapter and mobile application speed
Table 5: OBD-II adapter and mobile application speed independent T-test
| Independent Samples Test | ||||||||||
| Levene’s Test for Equality of Variances | t-test for Equality of Means | |||||||||
| F | Sig. | t | df | Sig. (2-tailed) | Mean difference | Std. Error difference | 95% Confidence Interval of the Difference | |||
| Lower | Upper | |||||||||
| Speeds recorded | Equal variances assumed | 5.431 | .020 | 1.798 | 4078 | .072 | 1.59999 | .88964 | -.14418 | 3.34417 |
|
Equal variances not assumed |
1.804 | 4024.147 | .071 | 1.59999 | .88716 | -.13933 | 3.33931 | |||
Different experiments and detailed analysis were performed to determine the extent of the differences between speeds for the OBD-II adapter and GPS device. The comparison between speeds was plotted graphically, as shown in Figure 20. It found that at certain times the OBD-II adapter speed was slightly different from the GPS speed. This can be clarified by the fact that the GPS estimates speed is based on position and the accuracy which depends on the number of satellites available to the receiver.
(a) differences points
(b) comparison between speeds
 Figure 20: OBD-II adapter speed and GPS device speed
A descriptive statistics and an independent T-test analysis were performed to determine the extent of any differences between the OBD-II adapter and Adafruit Ultimate GPS based on speed profiles. The results are shown in Table 6 and Table 7.
There was a significant difference in the mean and standard deviation of speeds recorded from experiments between OBD-II adapter speed ( , ) and Adafruit Ultimate GPS ( , ); These results are shown that device type in these experiments affects speed profiles at .05 level of significance.
Further experiments were carried out to compare digital dashboard pro application with Adafruit Ultimate GPS to determine the extent of any differences based on speed profiles. The comparison between speeds was plotted graphically as shown in Figure 21. Descriptive statistics and an independent T-test analysis were performed as presented in Table 8 and Table 9. This showed that at certain times the Mobile application speed was slightly different from the GPS speed. There was a significant difference in speeds recorded from experiments between digital dashboard pro speed (M=41.3, SD=27.1) and Adafruit Ultimate GPS (M= 31.3, SD=23.9); t(4416.5) = 13.2, p= 0. Results have also shown that device type in these experiments has an effect on speed profiles at .05 level of significance.
Table 6: OBD-II adapter and GPS device speed statistics
| Statistics | |||||
| Device type | N | Mean | Std. Deviation | Std. Error Mean | |
| Speeds recorded | OBD-II adapter | 1649 | 42.2662 | 30.77216 | .75779 |
| GPS device | 1650 | 31.6242 | 25.45023 | .62654 | |
Table 7: OBD-II adapter and GPS device speed statistics
| Independent Samples Test | ||||||||||
| Levene’s Test for Equality of Variances | t-test for Equality of Means | |||||||||
| F | Sig. | t | df | Sig. (2-tailed) | Mean difference | Std. Error difference | 95% Confidence Interval of the Difference | |||
| Lower | Upper | |||||||||
| Speeds recorded | Equal variances assumed | 116.733 | 0 | 10.824 | 3297 | 0 | 10.64198 | .98320 | 8.71423 | 12.5697 |
|
Equal variances not assumed |
10.823 | 3184.18 | 0 | 10.64198 | .98326 | 8.71410 | 12.5698 | |||
Table 8: Mobile application and GPS device speed statistics
| Statistics | |||||
| Device type | N | Mean | Std. Deviation | Std. Error Mean | |
| Speeds recorded | Digital dashboard pro | 2247 | 41.33 | 27.081 | .571 |
| GPS device | 2232 | 31.25 | 23.915 | .506 | |
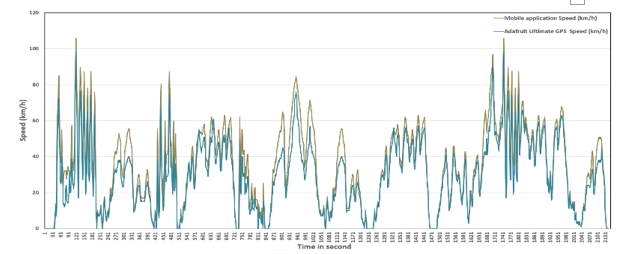 Figure 21: Comparison of mobile application and GPS device speed
Table 9: Mobile application and GPS device speed independent T-test
| Independent Samples Test | ||||||||||
| Levene’s Test for Equality of Variances | t-test for Equality of Means | |||||||||
| F | Sig. | t | df | Sig. (2-tailed) | Mean difference | Std. Error difference | 95% Confidence Interval of the Difference | |||
| Lower | Upper | |||||||||
| Speeds recorded | Equal variances assumed | 79.104 | .000 | 13.194 | 4477 | .000 | 10.075 | .764 | 8.578 | 11.572 |
|
Equal variances not assumed |
13.199 | 4416.51 | .000 | 10.075 | .763 | 8.578 | 11.571 | |||
For each of the measured parameters, the on-board data obtained in this research constructs a set of time series. However, the pace was still vulnerable to errors that were clearly seen once the acceleration was measured. In the GPS system, the speed was estimated based on the position of the vehicle. The efficiency of GPS speed data is highly affected by numerous factors, as presented in Table 10. The speed dissimilarity with a GPS device commonly occurred upon reaching high speeds (high acceleration) and once the vehicle stopped (high deceleration); while the OBD-II speed is logged directly from vehicle engine based on the rotation speed of the vehicle wheels. According to these points of view, the OBD-II adapter’s speed was used for all analysis and the proposed system. To validate the OBD-II speed, the speed reported by a GPS system and mobile application was used based on sequential vehicle locations.
Table 10: Factors affecting the accuracy of GPS speed [36]
| Factor | Description |
| Atmospheric effect | GPS precision can degrade atmospheric effects from satellite signals passing through the troposphere and ionosphere |
| Multipath effects | Multipath is when an item is bounced off by a GPS satellite signal and then hits a receiver. This influence distinguishes the time of signal arrival from what it would have been without reflection |
| Pit configuration | Shallow mines are perfect GPS candidates because they appear to have an open view of the sky. |
| Satellite geometry | When the overhead satellites have good spatial distribution instead of being clustered together in a portion of the sky, the best positional readings occur |
6.2. Acceleration and RPM collection and analysis
The prediction of the driving style based on the analysis of the drivers’ behaviour and environmental data was one of this research’s objectives. Acceleration and Engine RPM define a vehicle’s motion. These parameters are also important for determining a driver’s behaviour. To this end, the study of instantaneous vehicle parameters recorded by actual road tests is useful. Because of the developments in mobile sensing technologies and the technological capabilities of these devices, a variety of objective car and driving style data can be obtained, which can be used for driver style recognition based on OBD-II adapters. During a real test on the road, longitudinal and lateral accelerations on the y and x-axes can be reported on a vehicle. Through the study of parameters correlated with their driving, these parameters were used to classify the driver. To gather data for driving activities, we conducted a real-world experiment. In these experiments, while a driver carried out specific driving events, an Android application captured vehicle engine data. To produce the ground-truth for the experiment, the beginning and end timestamps of the driving events were recorded. When all the information was obtained, it was exported to the excel sheet. Each data form was placed on a separate table with the “acceleration and deceleration” key field, referring to the time of the case. Once the pre-processing was done, the data was prepared according to the actions of the drivers for the analysis phase. Several researchers discussed thresholds of acceleration linked to causality and a high risk of crash participation. The risk of collision start from -4.0m/s2 according to [20] while in [32, 37] similar results were obtained with a risk accident involvement around -5.0m/s2. In [17], the author proposed an acceleration/deceleration intensity stratification focused on numerous publications to provide an overview about the driving styles. In case of acceleration present the following parameters (dangerous (7.0 m/s2 – 12.0 m/s2), aggressive (3.5 m/s2 – 7.0 m/s2), normal (1.5 m/s2 – 3.5 m/s2) and safe (0 m/s2 – 1.5 m/s2)) and for deceleration (dangerous ((-9.0 m/s2) – (-14.0 m/s2)), aggressive ((-5.5 m/s2) – (-9.0 m/s2)), normal ((-3.0 m/s2) – (-5.5 m/s2)) and safe (0 m/s2 – (-3.0 m/s2)). Considering the mentioned works, we try to suggest an acceleration stratification consisting of a number of groups to test driver acceleration and braking based on our experiments to create a driving style table to enable the V2V alert system based on driving behaviours. It is possible to categorize driving behaviour into four major classes by calculating in-vehicle acceleration based on real time experiments: safe or non-aggressive drivers, normal, aggressive and dangerous drivers as shown in Figure 22.
 Figure 22. Driving behaviour analysis based on acceleration data: (a) Safe acceleration, (b) Normal acceleration, (c) Aggressive acceleration, (d) Dangerous acceleration
Furthermore, in driving behaviour data collection, different drivers and vehicles used to record the engine rotation represent Revolutions per minute (RPM) using the OBD-II adapter located below the driving panel. The pedal position test was carried out by pressing the accelerator pedal during different trips. The drivers informed when they had pressed the pedal as far as possible, and the duration was recorded. Furthermore, the accelerator pedal position over the time scatter plot as clarified in Figure 23 demonstrate that the maximum accelerator pedal ratio ranging from 1000 RPM to 4500 RPM recorded from different trips.
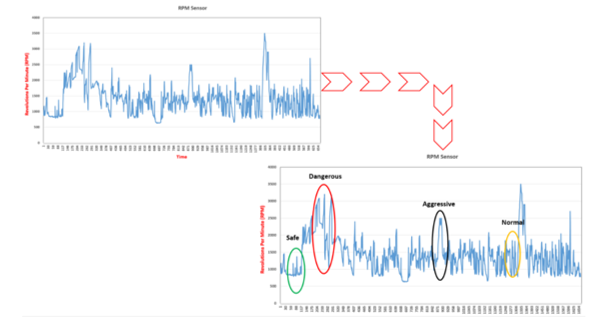 Figure 23: The visualization of Revolutions Per Minute (RPM) statistics
6.3. System deployment based on driving behaviours
The system algorithm provides an alert message and estimation distance for the vehicles about drivers’ behaviour within the coverage area provided by the proposed system. Recognition of driving behaviour is a subjective mechanism that relies on the driver’s interpretation and response to the changing external pressures of time. It is well known that the driving environment and behaviour are founded on a high degree of variability in individual experience and calculation. A high-level architectural framework that incorporates current technology and cognitive structures to build a new approach to the identification of trends in driving behaviour is, therefore a critical question. The results obtained from the different experiments (Figure 22), present accelerations data close to the values provided by previous researchers with some minor differences. These data have been injected into the proposed system to classify the driving performance as shown in Figure 24.
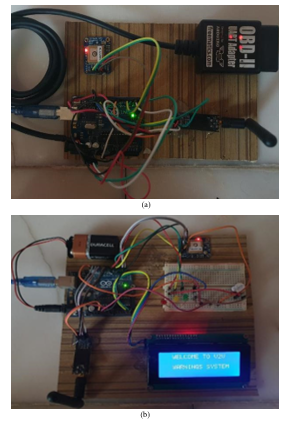 Figure 24: Network layout of point-to-point link: (a) transmitter, and (b) receiver
In this study a stratification of acceleration proposed in Table 11 with four main groups in acceleration and deceleration speed which represent one of the most reference tables used in the proposed V2V system.
Table 11: Defining behaviours based on experiments
| Deceleration data (m/s2) | Type of driving | Acceleration data (m/s2) |
| 0 to -2 | Safe | 0 to 2 |
| -2 to -4 | Normal | 2 to 4 |
| -4 to -7 | Aggressive | 4 to 7 |
| Less than -7 | Dangerous | More than 7 |
The safe driving behaviour is characterized by acceleration value that ranges from about ±2 m/s2. Normal driving, however, can also require more efficient but still planned braking, leading to more intense acceleration values ranging from 2 m/s2 to 4 m/s2. The risk of collision starts from 4 m/s2, which represented in this study the aggressive drivers. The dangerous evaluation indicates that the driver applies sudden movements in term of speeding starting from 7 m/s2. In the deceleration process and during these start and stop phases the lowest value of deceleration derivatives of safe and normal braking registered between -1 m/s2 and -3 m/s2, while conflict situations showed derivatives ranging from -3 m/s2 down to -8 m/s2 which represent the aggressive and dangerous driving style respectively. These differences in the acceleration data were observed for potential conflicts because of the difference of the drivers who carried out the experiments, as we note that some of them were driving in a natural way and the other was somewhat aggressively. The test results are successful, where it can be seen that the driver’s behaviours were displayed based on the real-time acceleration readings taken from the OBD-II device connected to the vehicles as shown in Figure 25.
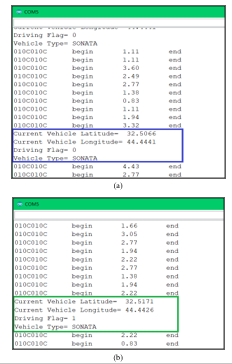
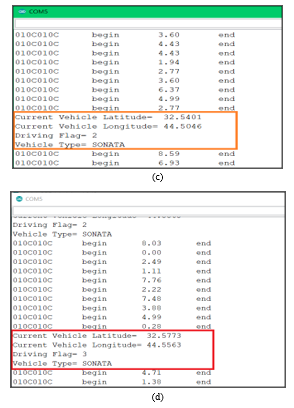 Figure 25: Test results of the proposed methods: (a) safe and (b) Normal. (c) Aggressive and (d) dangerous driving
The proposed algorithm uses OBD-II and nRFL24L01 transceiver, which can be installed in the passing vehicle. These sensors may give information such as the speed, position, and distance of the impeding and opposing vehicles. At each interval Δt, the sensors send a signal to search the lane for any oncoming traffic. Using a reading sensor and a processing unit with a driver-vehicle interface (DVI) unit, the algorithms follow the procedures to determine whether or not a “safe” message should be displayed for the driver of the passing vehicle. Furthermore, when the behaviour of the transmitted vehicle change, such as speed or acceleration, the system starts to calculate the accumulated behaviour for the last ten seconds then extract the most frequent values. The risk of collision starts from 4 m/s2, which represents the aggressive drivers which indicates that the driver’s behaviour starts to shift from the normal to the aggressive behaviours. These values in the acceleration data were observed for potential conflicts because of the difference of the drivers who carried out the experiments, as we note that some of them were driving in a natural way and the other was somewhat aggressively. Based on these data, the warning system is activated taking the advantages of the GPS device connected to the main board to extract the vehicle’s current location in the term of longitudes and latitudes values then calculate these values in degrees. Moreover, these data were sent to the neighbouring vehicles and vehicle type and the flag status through the nRF24L01. On the other side at the receiving vehicle, the system displays the transmitted flag and use the GPS unit mounted on the receiving board to measure the distance between the two moving vehicles then switch on the orange LED with a continuous updating of the distance between the two vehicles whether the threat is approaching or drifting away as long as the sending vehicle is within coverage range of the receiving vehicle. An example of a warning signal displayed by the LCD is shown in Figure 26.
 Figure 26: Test results of the proposed method for aggressive driving warning
![]() (a) Safe driving (87% total safe flags) (b) Dangerous driving (40% total safe flags)
(a) Safe driving (87% total safe flags) (b) Dangerous driving (40% total safe flags)
 Figure 27: Test results of the proposed methods: (a) Safe flag and (d) dangerous flag driving
Recall from the introduction section, that behavioural safety programs operate based on measuring and monitoring safe behaviour performance. The opposite of safe behaviour in at-risk behaviour, which can be defined as behaviour that has been identified as critical to safe performance. A key concept for the research, taken from behavioural safety analysis, is the calculation of safe behaviour performance using a percent safe value calculated as (3).
Generally, in driving behaviours data collection experiments, multiple drivers participated in this study during the period of data collection using the proposed system with different types of vehicles and scenarios using. Figure 27 show the results of different examples with varying sites of study.
7. Conclusions
Despite the increasing research interest in V2V communication, limitations remain in existing studies in this area. Studies indicate that further research and development are needed to address these limitations, especially in driving behaviour. This work introduces a real-time V2V warning system based on driving behaviour. Comparison of the OBD-II and GPS data streams became available during the measurement on the smartphone screen with charts and other views. The independent data from mobile application and GPS device speed were used to validate and check the data collected from OBD-II adapter speed. Considering the mentioned works, we used the OBD-II adapter attached to the vehicle to trigger the V2V alert system based on driving actions, and we suggest a stratification of acceleration consisting of a variety of classes to test driver speed and braking based on our experiments. A severity stratification of acceleration/deceleration presented with the following parameters (dangerous (more than 7 m/s2), aggressive (4 m/s2 – 7 m/s2), normal (2 m/s2 – 4 m/s2) and safe (0 m/s2 – 2 m/s2)). In future studies, we would like to use the obtained data sets as input values for a machine learning environment to forecast parameter values in the future with prediction algorithms, decision trees, or time series analysis. Future studies could also use different communication modules such as Wi-Fi, Bluetooth and ZigBee. Different data types can be used during the test scenarios, including videos and voices data. In addition to that, the network can be tested up to the capacity of the transceiver. Such improvement would help to produce more understanding towards the purpose of the V2V installation, usage, cost, and the equipment of the developed system.
Conflict of Interest
The authors declare no conflict of interest.
Acknowledgment
The financial support received from Research Fund E15501, Research Management Centre, Universiti Tun Hussein Onn Malaysia are gratefully acknowledged.