Enterprise Resource Planning Readiness Assessment for Determining the Maturity Level of ERP Implementation in the Industry in Indonesia
Volume 6, Issue 1, Page No 538-549, 2021
Author’s Name: Santo Fernandi Wijaya1,a), Harjanto Prabowo2, Ford Lumban Gaol3, Meyliana1
View Affiliations
1Information Systems Department, School of Information System, Bina Nusantara University, Jakarta, 11480, Indonesia
2Management Department, BINUS Business School Undergraduate Program, Bina Nusantara University, Jakarta, 11480, Indonesia
3Computer Science Department, BINUS Graduate Program, Bina Nusantara University, Jakarta, 11480, Indonesia
a)Author to whom correspondence should be addressed. E-mail: santofw@binus.ac.id
Adv. Sci. Technol. Eng. Syst. J. 6(1), 538-549 (2021); ![]() DOI: 10.25046/aj060159
DOI: 10.25046/aj060159
Keywords: ERP readiness, Assessment, Maturity level, Textile industry

Export Citations
The textile industry is one of the prioritized industries, because it contributes to the country’s foreign exchange, absorbs a large number of workers, and fulfills the need for national clothing. To increase work efficiency and productivity, the textile industry must use ERP. However, ERP implementation still has a relatively high failure rate. ERP readiness assessment is one of the main issues to achieve success in implementing ERP. Previous research is still limited to research about readiness for achieving success in ERP implementation. The research results have indicated that the maturity of the organization is a very significant dimension with a weight of 43.51%. By knowing the maturity level of the organization for ERP implementation can identify factors that become weaknesses for organizations to take corrective steps, so as to reduce the failure rate of ERP implementation in the industry. This research methodology uses a quantitative approach using R software to determine the principal component analysis and uses the Order Preference Technique with the Ideal Solution to weighted the identified factors. This research aims to determine organization readiness by developing the maturity level of ERP implementation in the industry in Indonesia which conducted a case study experiment in the textile industry in Indonesia. The result of this research is the development of an ERP readiness assessment to assess the maturity level of the organizations in ERP implementation.
Received: 16 November 2020, Accepted: 19 January 2021, Published Online: 28 January 2021
1. Introduction
The textile industry is one of the industries that is prioritized for development because it has a strategic role in the national economy, namely as a contributor to foreign exchange, absorbing large numbers of workers, and to meet national clothing needs. To increase work efficiency and productivity, the textile industry must use ERP. ERP can improve the performance of an organization, but until now the ERP implementation for the industry still has complexity with a high failure rate, so this causes implementation costs to be expensive. Referring to previous research, the ERP readiness assessment can assess the readiness of an organization in implementing ERP. ERP readiness assessment can be reviewed from the perspective of top management, project management, people, change management, technical requirements [1]. By identifying the weaknesses factors of the organization, management can develop ERP readiness assessment and make an evaluation to increase the organizational maturity level according to best practice [2-5]. The contribution of this research is the development of an ERP readiness measurement tool to increase the effectiveness of ERP implementation strategies for the industry, so that management can know the level of company readiness before making decisions for ERP implementation. Based on previous reseach, ERP implementations have a failure rate of 60% to 90%. The problem solution is to identify critical success factors in ERP implementation with a focus on organization, technology adaptation, and business processes [6, 7]. Also, by assessing the readiness of the organization, it can be evaluated the weaknesses and strengths of the organization to adapt to change, so that the company can achieve organizational agility and ERP implementation success [8-10]. Previous research shows that there is still little research that discusses the maturity assessment of an organization before top management decides to implement ERP. The development of ERP readiness assessment is one of the main issues related to achieving success in implementing ERP. This research can help the top management of an organization or consultant party to assess the maturity level before deciding to implement ERP with a discussion of four perspectives such as processes, people, organizational, and technology which based on the development of the Leavitt Diamond Model [11]. The four components of Leavitt Diamond Model are people, tasks or processes, technology, and structure or organization prominent success factors for improving industry performance. This matter is considered for organizations to assess the readiness level of an organization in implementing ERP, so that top management of the organization can find out the factors that are the weaknesses and strengths of the organization, to be able to make improvements, so that the relatively expensive investment value can achieve successful ERP implementation for an industry. This research explain identify the factors of ERP readiness assessment and the characteristics of the maturity level of the organization in ERP implementation. This is the novelty of this research which is the development of previous research to help the top management of the industry to find out the readiness of a company to adapt to a change in order to achieve the best practices and agile organizations..
2. Experimental procedure
The experimental procedure of this research uses a study case in the textile industry in Indonesia by using a quantitative approach technique with R software to determine the Principal Component Analysis (PCA) [12]. The objective of PCA is to reduce the data dimension by eliminating the correlation of variables by transforming the original variable into a new uncorrelated variable so that the data can be interpreted. PCA is a non-parametric method that uses linear algebra to extract relevant information or patterns from a dataset with multivariate attributes. This research also use of Technique for Order Preference Technique with the Ideal Solution (TOPSIS) method to identify the weight factors. The TOPSIS method approach can be used as an ERP assessment tool to determine the weighting and ranking of factors for the main weight, the weight of sub-factors, and the final weight. TOPSIS is a decision-making method for ranking and prioritizing Multi Criteria Decision Making (MCDM). The stages of weighting the TOPSIS method are as follows [13]:
- Building a normalized weighted matrix using the following formula:
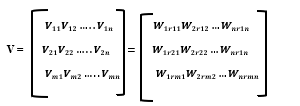
 Building a weighted normalized matrix by multiplying the normalized matrix with the weighting value of entropy weighting, with the normalization formula for the weighting matrix v as follows:
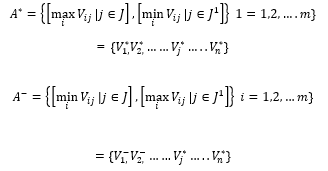
 Determine the matrix for positive and negative ideal solutions. The positive ideal solution is denoted by A +, while the negative ideal solution is denoted by A-. With the following formula:
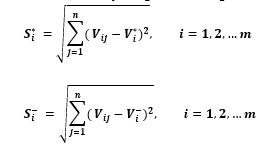
 Calculate the distance between the value of each alternative solution with a positive ideal solution matrix and a negative ideal solution matrix. By using the following formula:
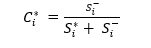
 Calculating the preference value to an alternative ideal solution, with the following formula:
 Ranking the value of Ci +. The best solution is to have the shortest distance to the ideal solution and the farthest distance to the ideal negative solution.
In processing the data of this study, the authors collected data from respondents using a questionnaire method. Then based on the results of the questionnaire, the authors validated the data using PCA. The results of data processing from PCA are to develop indicators as a basic concept in developing the ERP readiness assessment model. Based on the literature survey, the authors classify be indicators associated with these four dimensions. Based on the literature survey, the authors mapped the main variable (processes, people, organizational, and technology) with sub-variables and indicators related to the readiness of ERP implementation [14-18]. From the results of the literature survey, it was found that 24 sub-variables and 61 indicators affect organizational readiness in ERP implementation. Then the authors define indicators and make questionnaire statements, then the authors distribute data to respondents using a questionnaire method. A list of sub-variables, defining indicators and questionnaire statements can be seen in Table 1.
Table 1: Sub-variables, Indicators, Definition and Questionnaire Statement
| No | Sub-variables | No | Indicators | Code | Definition | Questionnaire statement |
| 1 | Business processes | 1 | Committed to change | PR01 | Business process change need the organization commitment to change to be standardized, understood and documented. | The role of management’s commitment to standardized, understood, and documented changes to business processes |
| 2 | Business processes change | PR02 | Implementation success requires a change of business processes. | Changes in business processes to achieve successful ERP implementation. | ||
| 3 | Business processes redesign | PR03 | Redesigning the business processes of an organization to best practice processes. | It is necessary to redesign business processes based on best practice business processes. | ||
| 2 | Process standarized based on industry best practice | 4 | Integrated business process | PR04 | Integrate business process and operations for improving organization business. | The integration of business processes and operations is necessary to improve the organization’s business. |
| 5 | Work processes standarized and documentation | PR05 | Standarization of work processes and documentation. | Standardization of work processes and complete documentation are essential in ERP implementation. | ||
| 3 | Change Management | 6 | Cultural change management | PR06 | Cultural change management is a concern to successfully implement. | Cultural change management must be done to ensure the change process runs well. |
| 7 | Open minded for changes | PR07 | Open minded for changes. | An open mind from all parties involved in accepting the change process. | ||
| 4 | Skill and competency | 8 | Management’s skill and competency | PE08 | Management’s skills determines the strategy of utilizing ERP usage for business development. | Management expertise in determining strategies for utilizing ERP for business development. |
| 9 | User’s skill and competency | PE09 | Skilled user to understand of process business of system used. | User expertise in understanding the business processes of the system used. | ||
| 10 | IT staff’s skill and competency | PE10 | Specialized skills and competency of the IT team will increase the ERP implementation success. | The expertise and special abilities of the IT team in improving the success of ERP implementation. | ||
| 5 | Project Manager | 11 | Adequate ERP project experience | PE11 | Project manager has adequate ERP project experience. | The project manager has sufficient ERP project experience. |
| 12 | High level overview | PE12 | Have a thorough understanding of the knowledge, experience, ability, and coordinate all the processes of the ERP Project. | Project Managers have a thorough understanding of the knowledge, experience, capabilities, and coordinate all processes in ERP implementation. | ||
| 6 | Training | 13 | Delivered to all parties | PE13 | Training is obliged to be delivered to all parties, including program, mechanism, material. | Mandatory training is delivered to all parties involved, including programs, mechanisms and materials. |
| 14 | Users adaptation to new process | PE14 | Users can adapt to new processes from taking ERP implementation training. | Users can adapt well to the new process from taking ERP implementation training. | ||
| 15 | Understand the overall concepts | PE15 | Training goal to understand the overall concepts of the ERP system. | Training is useful for understanding the overall concept of an ERP system. | ||
| 16 | Transfer knowledge | PE16 | Transfer of knowledge to improve the quality of employees. | Knowledge transfer for users to improve the quality of employees is very necessary. | ||
| 7 | Project team | 17 | Formed project team | PE17 | Formed project team accordingly to project the scope. | The project team must be formed according to the scope of the ERP project. |
| 18 | Technical expertise | PE18 | Technical expertise, understanding for business processes, processes knowledge, and ERP project experience. | There is a project team that has technical expertise, understanding of business processes, knowledge of ERP processes, and ERP project experience. | ||
| 19 | Involved Business Process Owner | PE19 | The involvement of a Business Process Owner in the project team to map and manage business processes according to ERP selected. | The involvement of a Business Process Owner in the project team to map and manage business processes according to the ERP that will be implemented. | ||
| 8 | Human Resource Management | 20 | Available Human Resource | PE20 | Ensure the availability of adequate Human Resources to involved the ERP implementation process. | Ensuring the availability of adequate human resources to carry out the ERP implementation process. |
| 21 | Development of competent human | PE21 | Development, utilization, and maintenance of competent human force to achieve goals of an organization. | The process of developing, utilizing, and maintaining competent human resources to achieve organizational goals in ERP project implementation. | ||
| 9 | Clear roles and responsibi lites | 22 | Clear roles of project | PE22 | Clear roles of project stakeholders should be clearly defined, fully documented and understood. | The clear roles of project stakeholders must be clearly defined, documented and fully understood by all teams involved. |
| 23 | Clear responsibilities of project | PE23 | Determination of the responsibilities of the tim involved in ERP implementation. | It is very important to determine the responsibility of the team involved in ERP implementation. |
| No | Sub-variables | No | Indicators | Code | Definition | Questionnaire statement |
| 10 | Employee /staf/user involvement | 24 | Employee commitment | PE24 | Commitment of employees to implement ERP projects. | Employee commitment in implementing ERP projects is very necessary. |
| 25 | Employee involvement | PE25 | Employees are actively involved in the process of ERP implementation stages. | Employees are actively involved in participating in ERP implementation activities. | ||
| 11 | Shared values | 26 | Project champion | OG26 | Project champion is a reliable person and trusted to regarding implementation. | Project champions are needed in ERP implementation, because project champions are people who can be relied on and trusted in ERP implementation activities. |
| OG27 | Project champion can ensure implementation processes run or the possibility of project success. | The project champion is needed to ensure the implementation process runs well and also determines the success of the ERP project. | ||||
| OG28 | Project champion in an ERP implementation is fundamental in implementation. | Project champion is fundamental in ERP implementation. | ||||
| 27 | Shared beliefs | OG29 | Belief to benefits of using ERP in organizations. | All parties involved must have confidence in the benefits of using ERP in the organization. | ||
| 28 | Cross functional support | OG30 | Get support all function of organization. | Support from all organizational functions in achieving successful ERP implementation is needed. | ||
| OG31 | Cross department cooperation. | Cross-departmental collaboration is essential in achieving a successful ERP implementation. | ||||
| 12 | Project Management | 29 | Measurement of performance specific, measurable, achievable, relevant, time bound | OG32 | Performance measurement of ERP projects specifically in the planning, implementation, and post-ERP implementation processes. | Specific ERP project performance measurement in the planning, implementation, and post-ERP implementation processes is essential. |
| OG33 | Performance measurement of ERP projects that the measurable results of each stage of implementation. | Measurable ERP project performance measurement at each stage of ERP implementation is needed | ||||
| OG34 | Performance measurement of ERP projects that the ERP implementation is achieved. | ERP project performance measurement that pays close attention to the target of achieving ERP implementation must be considered. | ||||
| OG35 | Performance measurement of ERP projects that the relevant results according to the company’s vision and mission. | ERP project performance measurement must pay attention to the results that are relevant to the company’s vision and mission. | ||||
| OG36 | Performance measurement of ERP projects that the performance of the ERP project in accordance with a predetermined target time. | ERP project performance measurement must be in accordance with a predetermined time schedule. | ||||
| 30 | Monitoring of performance | OG37 | Focused on customer need. | ERP project performance measurement results should focus on customer needs. | ||
| OG38 | Controlling for implementation schedule. | The performance control process is indispensable in ERP implementation. | ||||
| 31 | IT Governance | OG39 | Focus on IT governance with concerned to information quality. | IT governance must pay attention to the quality of information generated by ERP. | ||
| 13 | Knowledge Management | 32 | Knowledge sharing process | OG40 | Knowledge sharing process can greatly improve employees’ ability to learn and manage knowledge. | The process of knowledge sharing is needed in an effort to improve employee learning skills and manage their knowledge. |
| 33 | Data and information standarized | OG41 | Ensure information standarized in all business operations. | Data and information standarizedon all business operations supports the use of ERP. | ||
| 14 | Organizatio nal structure | 34 | Centralization | OG42 | Activities of an organisation, planning and decision-making are controlled by the top management and project manager. | Planning and decision-making activities that are controlled by top management and project managers are required in ERP projects. |
| 35 | Specialization | OG43 | Specialization is a business strategy that focuses on specialized production for increasing productivity with ERP use. | A business strategy that focuses on specialized production is needed to increase productivity with the use of ERP. | ||
| 36 | Formalization | OG44 | Formalization as a process to define procedures, standardization processes, responsibilities, and completely documented. | Organizational formalization is needed in ERP implementation as a process in determining procedures, standardizing work processes, and fully documented responsibilities. | ||
| 37 | Size of organization | OG45 | The success of ERP projects may be impacted by organization size. | The size of the organization affects the success of an ERP project. | ||
| 38 | CIO position | OG46 | CIO’s role is to determine the alignment of business and technology, ensure the availability, accuracy, accuracy and security of information as needed to achieve the organizational goals. | The role of the Chief Information Officer (CIO) is needed to determine the alignment of business and technology, ensuring the availability, accuracy, accuracy, and security of information according to management needs to achieve organizational goals. | ||
| 39 | Top management commitment | OG47 | Involved in every step of ERP project, monitor the progress ERP. | Top management must be involved in every process and monitor the progress of the ERP project. | ||
| OG48 | Focusing on top management’s commitment and willingness to provide sufficient resources. | Top management commitment is needed to provide adequate resources and achieve a successful ERP implementation. |
| No | Sub-variables | No | Indicators | Code | Definition | Questionnaire statement |
| 15 | Organizati onal style | 40 | Communication | OG49 | Communicate all activities in the ERP implementation process to all parties involved. | Communicating all activities in the ERP implementation process to all parties involved is very important. |
| OG50 | Sign off as proof of the communication and agreement on project work. | Sign off as proof of communication and agreement on ERP project work must be approved by the parties involved. | ||||
| 41 | Organizational culture | OG51 | Organizational culture determines the right way to attitude and make changes, including with regard to ERP implementation. | Organizational culture determines the right way to behave and make changes in ERP implementation. | ||
| 42 | Vision and mission | OG52 | The clear of vision and mission as a guide ERP implementation. | A clear organizational vision and mission guides the implementation of ERP implementation. | ||
| OG53 | A clear vision and mission must be revealed and communicated into an important part that will support the ERP project. | A clear organizational vision and mission must be revealed and communicated to all parties involved to support the implementation of the ERP project. | ||||
| 16 | Organizati onal strategy | 43 | Goals and objectives | OG54 | Identification of measurable goals, the formation of the project organization, and the motivation of the project team. | The process of identifying measurable goals, establishing a project organization, and the motivation of the ERP project team are important factors in supporting ERP implementation. |
| OG55 | Define and must be communicated effectively among stakeholders involved. | Project objectives and objectivity must be defined and communicated effectively to the stakeholders involved. | ||||
| 44 | Project planning (scope, time, budget, risk, other resources) | OG56 | Determine the scope of the ERP project. | Determination of a clear ERP project scope will determine the success of ERP implementation. | ||
| OG57 | Confirming the ERP project for determine target of go live time. | All ERP project activities must be confirmed with all parties involved in order to determine the target time to go live. | ||||
| OG58 | Budget usage needs to be controlled rigorously throughout the ERP implementation. | Budget usage needs to be strictly controlled during ERP implementation. | ||||
| OG59 | Project planning implementation can reduce the risk for the failure. | The implementation of project planning can reduce the risk of failure in ERP implementation. | ||||
| OG60 | Project planning implementation requires the availability of complete resources. | ERP implementation project planning must have complete resource availability. | ||||
| 17 | System rollout | 45 | Rollout system | TH61 | Rollout system is a structured set of processes to anticipate events that cause ERP implementation setbacks. | A system rollout function to anticipate things that cause ERP implementation setbacks must be available. |
| configuration | 46 | Configuration system | TH62 | A configuration refers to the hardware and software that greatly affect ERP implementation success. | Correct configuration of hardware and software affects the success of ERP implementation. | |
| 18 | System integration | 47 | IT infrastructure | TH63 | Determine the software, hardware, and network infrastructure that will be needed for the ERP system. | Determining the correct software, hardware and network infrastructure is needed in ERP implementation. |
| TH64 | Adequate IT infrastructure, hardware and networking for ERP implementation. | It is necessary to conduct an assessment of the adequacy of IT infrastructure, hardware and networks before implementing ERP. | ||||
| 48 | Processes improvement | TH65 | Process improvements need to be identified before the implementation of ERP. | Identification of process improvements must be done prior to ERP implementation. | ||
| TH66 | Information usable that provides benefits that support decision making related to ERP projects. | Useful information is needed to support decision making in ERP projects. | ||||
| 49 | Data management | TH67 | Data comprehensive that supports decision making related to ERP projects. | Complete data comprehensively supports decision making in ERP projects. | ||
| TH68 | Data availability as needed to support decision making related to ERP projects. | The availability of data that is suitable for management needs for decision making in ERP projects is needed. | ||||
| 19 | IT structure and legacy systems | 50 | IT structure | TH69 | IT team structure to coordinate ERP project activities from planning to post-go live. | Good IT team structure to coordinate ERP project activities from planning to post-go live. |
| 51 | Legacy systems | TH70 | Good integration with legacy systems. | Integration with old systems in ERP implementation must be done well. | ||
| 20 | Technology selection & adaptation (Technolo gical readiness) | 52 | Technology selection | TH71 | The company’s readiness in selection, providing, and implementing technology that supports business strategies. | An assessment of the company’s readiness in selecting, providing, and implementing technology that supports business strategies must be carried out. |
| 53 | Technology adaptation | TH72 | Adaptation of technology used to support optimal ERP implementation strategy. | Adaptation of the technology used to support the ERP implementation strategy is needed. | ||
| 21 | System acceptance and usage | 54 | System acceptance | TH73 | Acceptance of users to use ERP in completing work will increase the work more effective and efficient. | Acceptance of users to use ERP in completing work and improving a more effective way of working is very important |
| 55 | System usage | TH74 | The use of information technology can improve the performance of the organization. | The optimal use of information technology can improve overall organizational performance. | ||
| 22 | Trouble shooting | 56 | Helpdesk system | TH75 | The available of a helap system to help users in providing fast response in troubleshooting related to ERP use. | The availability of a helpdesk system will help users quickly solve problems related to the use of ERP. |
| 57 | Service to users | TH76 | The available of an IT team to serve users in providing troubleshooting related to ERP use. | The availability of an IT team that provides services for users and provides solutions to problems related to the use of ERP is very much needed. |
| No | Sub-variables | No | Indicators | Code | Definition | Questionnaire statement |
| 23 | External consultant / expertise | 58 | Functional consultant | TH77 | Analyzes running business processes and provides directions for following ERP business processes that can be implemented. | Consultants can analyze running business processes and provide directions for following ERP business processes so that they can be implemented properly. |
| 59 | Technical consultant | TH78 | Consultant expertise in providing directions and solutions for technical matters related to ERP implementation. | Consultants can provide direction and solutions for technical matters related to ERP implementation. | ||
| 24 | Vendor relationship and support | 60 | Vendor engagement | TH79 | Relationships and angagement with vendors will speed up problem solving related to the ERP implementation process. | Relationships and agreements with vendors can speed up problem solving related to the ERP implementation process. |
| 61 | Supply Chain Management | TH80 | Network of interconnected department for fulfilling the material required by the other departments or by the customers. | Inter-departmental networks that are interconnected to meet material requirements for other departments or for customers are very necessary in ERP. |
The characteristic of CMMI is initial, defined, managed, measured, and optimized [19]. Initial: Unpredicable, uncontrolled, no-automation. Defined: Some shared decision-making. Managed: Collaboration, analyze trend, and portfolios. Measured: Central automated process, standardized across the organization. Optimized: Focused on continuous improvement, stability provides a platform for agility and innovation. The related between characteristic of maturity level with readiness of ERP readiness assessment module, which can be seen in Figure 1.
| Level 1 Initial | Level 2 Defined | Level 3 Managed | Level 4 Measured | Level 5 Optimized |
| PROCESSES READINESS | ||||
| PEOPLE READINESS | ||||
| ORGANIZATIONAL READINESS | ||||
| TECHNOLOY READINESS | ||||
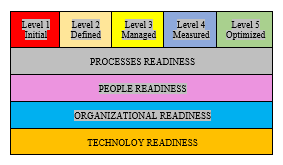 Figure 1: ERP Readiness Assessment model
Based on these main variables (processes readiness, people readiness, organizational readiness, and technology readiness), it is derived into 24 sub-variables and 61 indicators. The grouping of processes readiness variables is derived into 3 sub-variables and 7 indicators can be seen in Figure 2.
| Var | Sub-variable | Indicators | ||
| Processes readiness | Business processes | Committed to change | ||
| Business processes change | ||||
| Business processes redesign | ||||
| Process standarization based on industry best practice | Integrated business process | |||
| Work processes standarize & documentation | ||||
| Change Management | Cultural change management | |||
| Open minded for changes |
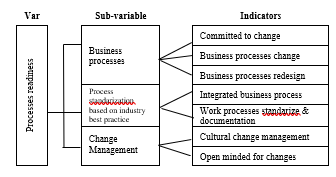 Figure 2: Processes readiness of ERP Readiness Assessment
The grouping of people readiness variables is derived into 7 sub-variables and 18 indicators can be seen in Figure 3.
The grouping of organizational readiness variables is derived into 9 sub-variables and 25 indicators can be seen in Figure 4.
| Var | Sub-variable | Indicators | |||
| People readiness | Skill and competency | Management’s skill & competency | |||
| User’s skill & competency | |||||
| IT staff’s skill & competency | |||||
| Project Manager | Adequate ERP project experience | ||||
| High level overview | |||||
| Training | Delivered to all parties | ||||
| Users adaptation to new process | |||||
| Understand the overall concepts | |||||
| Transfer knowledge | |||||
| Project team | Formed project team | ||||
| Technical expertise | |||||
| Involved Business Process Owner | |||||
| Human Resource Management | Available Human Resource | ||||
| Development of competent human | |||||
| Clear roles & responsibilities | Clear roles of project | ||||
| Clear responsibilities of project | |||||
| Employee/ staf /user involvement | Employee commitment | ||||
| Employee involvement |
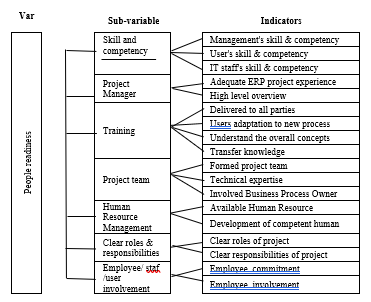 Figure 3: People readiness of ERP Readiness Assessment
| Var | Sub-variable | Indicators | ||
| Organizational readiness | Shared values | Project champion | ||
| Shared beliefs | ||||
| Cross functional support | ||||
| Project Management | Measurement of performance specific, measurable, achievable, relevant, time bound | |||
| Monitoring of performance | ||||
| IT Governance | ||||
| Knowledge Management | Knowledge sharing process | |||
| Data & information standarization | ||||
| Organizational structure | Centralization | |||
| Specialization | ||||
| Formalization | ||||
| Size of organization | ||||
| CIO position | ||||
| Organizational style | Top management commitment | |||
| Communication | ||||
| Organizational culture | ||||
| Vision and mission | ||||
| Organizational strategy | Goals and objectives | |||
| Project planning (scope, time, budget, risk, other resources) |
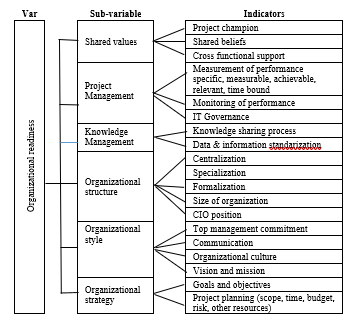 Figure 4: Organizational readiness of ERP Readiness Assessment
The grouping of technology readiness variables is derived into 8 sub-variables and 17 indicators. The grouping of technology readiness for each sub-variables and indicator can be seen in Figure 5.
| Var | Sub-variable | Indicators | ||
| Technology readiness | System rollout & configuration | Rollout system | ||
| Configuration system | ||||
| System integration | IT infrastructure | |||
| Processes improvement | ||||
| Data management | ||||
| IT structure & legacy systems | IT structure | |||
| Legacy systems | ||||
| Technology selection & adaptation (technological readiness) | Technology selection | |||
| Technology adaptation | ||||
| System acceptance & usage | System acceptance | |||
| System usage | ||||
| Trouble shooting | Helpdesk system | |||
| Service to users | ||||
| External consultant/ expertise | Functional consultant | |||
| Technical consultant | ||||
| Vendor relationship & support | Vendor engagement | |||
| Supply chain management |
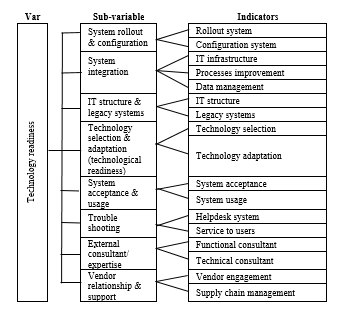 Figure 5: Technology readiness of ERP Readiness Assessment
3. Result and discussion
3.1. Data processing of the questionnaires
As a result of distributing questionnaires to respondents, Authors made a characteristics profile of respondents which can be seen in Table 2.
Table 2: Characteristics profile of respondents
| Respondent profile | Frequency | % | |
| Gender | Male | 96 | 73% |
| Female | 35 | 27% | |
| 131 | 100% | ||
| Age | 20-30 years | 38 | 29% |
| 31-40 years | 34 | 26% | |
| 41-50 years | 36 | 27% | |
| > 51 years | 23 | 18% | |
| Level of education | Strata-1 (bachelor) | 90 | 69% |
| Strata-2 (undergraduate) | 36 | 27% | |
| Strata-3 (doctoral) | 5 | 4% | |
| Work experience | 1-2 years | 34 | 26% |
| 2-3 years | 6 | 5% | |
| 3-4 years | 16 | 12% | |
| > 4 years | 75 | 57% | |
| Educational background | Information technology | 68 | 52% |
| Finance/Accounting | 43 | 33% | |
| Marketing | 5 | 4% | |
| Production | 3 | 2% | |
| Others | 12 | 9% | |
| Level | Staff | 57 | 44% |
| Manager | 60 | 46% | |
| Director | 14 | 11% | |
| Industry type | Textile industry | 67 | 51% |
| Garment industry | 39 | 30% | |
| Consultant | 25 | 19% | |
The authors grouping indicators the data collection to organizational readiness in ERP implementation, by determining the following components to Gender: The authors included gender components because it can influence in emotions in decision making in the data collection according the character of the respondents. Age: The authors included age components because it can influence decision making in the data collection according to work experience from respondents. Work experience: Authors included work experience components because it can influence maturity in decision making in the data collection according the work experience using ERP from respondents. Educational background: The authors included educational background components in the data collection because it can affect the level of maturity in decision making. Position: Authors included a position components because it can influences the maturity level in decision making. Industry type: Authors included industry type components in data collection because it can be comparison of the data processing result. The authors forward to test of 61 indicators using the multivariate Principal Component Analysis (PCA) statistical approach using R software, which meets the following requirement, namely the p-value must be less than 0.05, and the Measure of Sampling Adequacy(MSA) value must be greater than 0.5. The results of PCA data processing using software R show that Kaiser-Meyer Olkin (KMO) = 0.866, where all indicators have ”KMO > 0.5”, so it can be interpreted that the KMO value has requirement. The results of data processing from the PCA test show that 61 indicators from into 24 Release Candidate (RC) with the sum of the squared loadings (SS Loadings) achieve contributes 83% cumulative variable. The SS loading value is the result of automatic calculation from the R software. Based on RC results of PCA data processing using R software by calculation for more than one of eigen value (SS Loading > 1) achieved at a cumulative variable 83% with RC is 24, this is the optimum value calculated achieve cumulative proportion 100%. The release Candidate result can be seen in Table 3.
Table 3: Release Candidate results
| No | RC | SS Loading | Proportion variable | Cumulative variable | Proportion Explained | Cumulative Proportion |
| 1 | RC1 | 5.73 | 7% | 7% | 10,00% | 10% |
| 2 | RC21 | 4.68 | 6% | 13% | 7,00% | 17% |
| 3 | RC4 | 4.62 | 6% | 19% | 7,00% | 24% |
| 4 | RC2 | 4.06 | 5% | 24% | 6,00% | 30% |
| 5 | RC24 | 3.53 | 4% | 28% | 5,00% | 35% |
| 6 | RC13 | 3.43 | 4% | 32% | 5,00% | 40% |
| 7 | RC22 | 3.37 | 4% | 36% | 5,00% | 45% |
| 8 | RC3 | 2.86 | 4% | 40% | 4,00% | 49% |
| 9 | RC7 | 2.85 | 4% | 44% | 4,00% | 53% |
| 10 | RC19 | 2.82 | 4% | 48% | 4,00% | 57% |
| 11 | RC17 | 2.66 | 3% | 51% | 4,00% | 61% |
| 12 | RC15 | 2.63 | 3% | 54% | 4,00% | 65% |
| 13 | RC5 | 2.46 | 3% | 57% | 4,00% | 69% |
| 14 | RC9 | 2.45 | 3% | 60% | 4,00% | 73% |
| 15 | RC10 | 2.30 | 3% | 63% | 3,00% | 76% |
| 16 | RC16 | 2.21 | 3% | 66% | 3,00% | 79% |
| 17 | RC8 | 2.16 | 3% | 69% | 3,00% | 82% |
| 18 | RC12 | 2.11 | 3% | 72% | 3,00% | 85% |
| 19 | RC6 | 1.96 | 2% | 74% | 3,00% | 88% |
| 20 | RC20 | 1.86 | 2% | 76% | 3,00% | 91% |
| 21 | RC23 | 1.77 | 2% | 78% | 3,00% | 94% |
| 22 | RC11 | 1.54 | 2% | 80% | 2,00% | 96% |
| 23 | RC18 | 1.52 | 2% | 82% | 2,00% | 98% |
| 24 | RC14 | 1.05 | 1% | 83% | 2,00% | 100% |
| SS Loading is the sum of the squared loadings | ||||||
| RC is Release Candidate | ||||||
Based on the results of R software data processing for 24RC, the authors analyze for finding the highest value of each indicator, then the authors classify according to each of RC with create a new group for 24RC. The PCA result of data processing using R software can be seen in Table 4.
Table 4: Principal Component Analysis
| RC | Indicator | RC1 | RC2 | RC3 | RC4 | RC5 | RC6 | RC7 | RC8 |
| RC1 | OG26 | 0.80 | 0.10 | 0.06 | 0.17 | 0.15 | 0.05 | 0.12 | 0.14 |
| OG27 | 0.82 | 0.05 | 0.11 | 0.13 | 0.09 | 0.05 | 0.11 | 0.04 | |
| OG28 | 0.72 | 0.03 | 0.06 | 0.20 | -0.10 | 0.15 | 0.06 | -0.11 | |
| OG43 | 0.46 | 0.12 | 0.15 | 0.09 | -0.05 | -0.03 | 0.17 | 0.17 | |
| PE22 | 0.41 | 0.39 | 0.04 | 0.18 | 0.13 | 0.05 | 0.06 | 0.10 | |
| OG38 | 0.36 | 0.23 | -0.02 | 0.23 | -0.03 | 0.17 | 0.19 | 0.16 | |
| TH61 | 0.34 | 0.07 | 0.34 | 0.23 | 0.03 | 0.04 | 0.03 | 0.03 | |
| RC2 | PR06 | 0.11 | 0.4 | -0.13 | 0.12 | 0.40 | -0.11 | 0.03 | 0.21 |
| OG29 | 0.09 | 0.4 | 0.12 | 0.17 | -0.01 | 0.03 | 0.03 | 0.05 | |
| OG30 | -0.02 | 0.79 | 0.14 | 0.10 | 0.05 | 0.16 | 0.01 | 0.12 | |
| OG31 | 0.15 | 0.53 | 0.12 | 0.11 | 0.37 | -0.14 | 0.23 | 0.08 | |
| OG32 | 0.34 | 0.43 | 0.09 | 0.18 | 0.14 | 0.2 | 0.27 | -0.01 | |
| OG33 | 0.12 | 0.46 | 0.18 | 0.09 | 0.10 | 0.18 | 0.18 | 0.03 | |
| OG34 | 0.29 | 0.45 | 0.15 | 0.30 | 0.04 | 0.16 | 0.07 | 0.03 | |
| OG36 | 0.20 | 0.47 | 0.22 | 0.11 | 0.07 | 0.13 | 0.14 | -0.19 | |
| RC3 | TH62 | 0.09 | 0.16 | 0.78 | 0.14 | 0.08 | 0.07 | 0.11 | 0.10 |
| TH63 | 0.13 | 0.10 | 0.68 | 0.25 | 0.11 | 0.20 | 0.23 | 0.06 | |
| RC4 | TH74 | -0.02 | 0.09 | 0.3 | 0.5 | -0.01 | 0.10 | 0.34 | 0.22 |
| TH77 | 0.14 | 0.08 | 0.07 | 0.81 | 0.07 | -0.08 | 0.11 | -0.02 | |
| TH78 | 0.22 | 0.08 | 0.16 | 0.82 | 0.12 | 0.03 | 0.08 | 0.05 | |
| TH79 | 0.20 | 0.23 | 0.23 | 0.62 | -0.03 | 0.28 | -0.01 | 0.07 | |
| RC5 | PR01 | 0.03 | 0.11 | 0.18 | 0.11 | 0.74 | 0.08 | 0.02 | 0.18 |
| PR04 | 0.36 | 0.16 | 0.02 | 0.02 | 0.49 | 0.07 | 0.09 | 0.05 | |
| PR05 | 0.15 | 0.17 | -0.22 | 0.34 | 0.36 | 0.16 | 0.32 | 0.09 | |
| RC6 | OG58 | 0.13 | 0.15 | 0.16 | 0.05 | 0.05 | 0.81 | – | 0.01 |
| RC7 | TH75 | 0.25 | 0.11 | 0.23 | 0.12 | 0.06 | 0.07 | 0.69 | 0.05 |
| TH76 | 0.17 | 0.04 | 0.22 | 0.20 | – | -0.16 | 0.61 | 0.14 | |
| RC8 | OG41 | 0.07 | 0.25 | 0.01 | 0.17 | 0.16 | 0.08 | 0.37 | 0.44 |
| OG42 | 0.04 | – | 0.12 | 0.09 | 0.11 | 0.04 | 0.21 | 0.56 | |
| OG48 | 0.17 | 0.17 | 0.16 | 0.06 | 0.23 | -0.01 | 0.03 | 0.7 |
| RC | Indicator | RC9 | RC10 | RC11 | RC12 | RC13 | RC14 | RC15 | RC16 |
| RC9 | PR07 | 0.54 | 0.14 | 0.09 | 0.21 | 0.28 | -0.10 | -0.01 | 0.09 |
| PE11 | 0.68 | -0.01 | 0.05 | 0.04 | 0.14 | 0.06 | 0.08 | 0.02 | |
| PE12 | 0.5 | 0.19 | 0.11 | 0.07 | 0.02 | 0.17 | 0.19 | 0.27 | |
| RC10 | PE20 | 0.05 | 0.51 | 0.09 | -0.06 | -0.03 | 0.19 | 0.13 | 0.19 |
| PE21 | 0.11 | 0.62 | 0.11 | 0.16 | 0.21 | – | 0.14 | 0.12 | |
| PE25 | 0.06 | 0.45 | 0.01 | 0.09 | -0.03 | 0.09 | 0.03 | 0.16 | |
| RC11 | PE08 | 0.09 | 0.08 | 0.78 | 0.08 | 0.16 | 0.13 | 0.07 | 0.10 |
| RC12 | PR02 | 0.08 | 0.12 | 0.09 | 0.78 | 0.15 | 0.04 | 0.18 | – |
| PR03 | 0.17 | -0.22 | -0.10 | 0.47 | 0.18 | 0.1 | 0.03 | 0.14 | |
| RC13 | OG49 | 0.08 | 0.23 | 0.17 | -0.08 | 0.54 | -0.01 | 0.26 | 0.10 |
| OG57 | 0.24 | 0.05 | 0.2 | – | 0.64 | -0.11 | 0.07 | 0.07 | |
| OG60 | 0.19 | 0.17 | 0.06 | 0.1 | 0.39 | 0.02 | 0.17 | -0.28 | |
| TH67 | -0.18 | 0.04 | 0.2 | 0.08 | 0.47 | 0.16 | 0.25 | 0.10 | |
| TH68 | 0.08 | 0.11 | -0.03 | 0.16 | 0.57 | 0.22 | -0.10 | 0.09 | |
| TH73 | 0.02 | 0.13 | 0.06 | 0.1 | 0.45 | 0.1 | 0.31 | 0.06 | |
| RC14 | PE19 | 0.22 | 0.1 | 0.01 | -0.02 | 0.15 | 0.51 | -0.04 | 0.09 |
| RC15 | OG44 | 0.09 | 0.05 | 0.06 | -0.09 | 0.03 | 0.08 | 0.55 | 0.16 |
| OG45 | 0.15 | 0.19 | 0.1 | 0.24 | 0.24 | -0.15 | 0.35 | 0.10 | |
| OG51 | 0.11 | – | 0.07 | -0.02 | 0.13 | -0.07 | 0.69 | -0.07 | |
| RC16 | PE23 | 0.17 | 0.21 | 0.1 | 0.2 | -0.04 | 0.21 | 0.03 | 0.46 |
| PE24 | 0.01 | 0.04 | 0.14 | – | 0.10 | -0.01 | 0.05 | 0.81 |
| RC | Indicator | RC17 | RC18 | RC19 | RC20 | RC21 | RC22 | RC23 | RC24 |
| RC17 | OG46 | 0.65 | -0.10 | 0.16 | 0.15 | 0.21 | 0.09 | 0.11 | 0.12 |
| OG47 | 0.79 | 0.15 | 0.04 | -0.04 | 0.12 | 0.13 | -0.01 | 0.09 | |
| RC18 | TH69 | 0.14 | 0.54 | 0.22 | 0.10 | 0.16 | 0.10 | 0.13 | 0.15 |
| TH72 | 0.04 | 0.47 | 0.36 | 0.06 | 0.21 | 0.12 | -0.02 | 0.18 | |
| RC19 | OG40 | 0.17 | 0.08 | 0.53 | 0.18 | 0.20 | 0.21 | 0.10 | 0.24 |
| OG56 | 0.06 | 0.21 | 0.39 | 0.10 | 0.07 | 0.25 | 0.08 | 0.37 | |
| TH70 | 0.21 | 0.06 | 0.49 | 0.18 | 0.19 | 0.15 | 0.24 | -0.08 | |
| TH71 | 0.03 | 0.09 | 0.75 | 0.05 | 0.17 | 0.06 | 0.05 | 0.17 | |
| RC20 | PE15 | 0.11 | 0.10 | 0.16 | 0.61 | 0.11 | 0.14 | 0.09 | 0.05 |
| PE13 | 0.02 | 0.09 | 0.26 | 0.43 | 0.13 | 0.10 | 0.30 | 0.24 | |
| RC21 | OG35 | 0.05 | 0.01 | 0.27 | 0.22 | 0.45 | 0.17 | 0.15 | 0.15 |
| OG37 | 0.04 | 0.02 | 0.10 | 0.40 | 0.49 | 0.25 | 0.13 | 0.03 | |
| OG52 | 0.17 | 0.08 | 0.16 | – | 0.77 | 0.12 | 0.08 | 0.04 | |
| OG53 | 0.08 | 0.10 | 0.12 | 0.06 | 0.80 | 0.11 | -0.01 | 0.17 | |
| OG54 | 0.03 | -0.17 | 0.01 | – | 0.47 | 0.17 | 0.19 | 0.22 | |
| OG55 | 0.18 | -0.07 | 0.22 | 0.09 | 0.37 | 0.11 | 0.11 | 0.08 | |
| RC22 | PE09 | 0.13 | -0.07 | 0.23 | 0.05 | 0.01 | 0.60 | 0.09 | 0.21 |
| PE16 | -0.08 | -0.11 | 0.22 | 0.36 | -0.01 | 0.43 | 0.18 | 0.27 | |
| PE17 | 0.18 | 0.12 | 0.04 | 0.09 | 0.28 | 0.67 | 0.14 | 0.05 | |
| PE18 | 0.05 | 0.14 | 0.13 | 0.10 | 0.25 | 0.54 | -0.04 | 0.08 | |
| OG50 | 0.20 | – | -0.02 | 0.10 | 0.25 | 0.36 | -0.01 | 0.18 | |
| TH64 | 0.16 | 0.25 | 0.15 | -0.13 | 0.25 | 0.40 | 0.22 | 0.01 | |
| RC23 | PE10 | 0.18 | 0.24 | 0.10 | 0.16 | 0.15 | 0.21 | 0.49 | -0.03 |
| TH65 | 0.04 | – | 0.16 | 0.12 | 0.12 | 0.15 | 0.66 | 0.16 | |
| RC24 | PE14 | -0.03 | -0.05 | 0.03 | 0.33 | 0.19 | 0.28 | 0.19 | 0.36 |
| OG39 | 0.13 | 0.03 | 0.25 | -0.02 | 0.41 | 0.01 | 0.06 | 0.49 | |
| OG59 | 0.17 | 0.01 | 0.11 | 0.08 | 0.08 | 0.19 | 0.14 | 0.66 | |
| TH66 | 0.12 | 0.12 | 0.10 | 0.06 | 0.19 | 0.08 | -0.03 | 0.52 | |
| TH80 | 0.08 | 0.16 | 0.26 | 0.05 | 0.24 | 0.06 | 0.06 | 0.54 |
3.2. ERP readiness assessment factors
Based on the results of PCA data processing using R software, the authors identify a new name for the sub-variable of each RC can be seen in Table 5. Then the authors continue to analysis with the weighting of 61 indicators using TOPSIS method where the name of the grouping for 24 sub-variables is based on the highest score for the preference score. The results of the TOPSIS processing for 10 the readiness factors that affect the success of ERP implementation are as follows: cross functional support (9.87%), project champion (9.14%), communication (7.82%), vision and mission (6.98%), transfer knowledge (6.97%), process improvement (5.98%), project planning (5.19%), vendor engagement (5.13%), commited to change (4.12%), and open minded for changes (4.05%). The results of the weight of ERP readiness assessment can be seen in Table 5.
Table 5: The weight of ERP readiness assessment
| RC | No | Indica-tors | Sub-variables | Main weights | Final weights | Weights factors | Prefe rences |
| RC01 | 1 | OG28 | Project champion | 9.14% | 15.75 | 1.44 | 0.77 |
| 2 | OG27 | 15.43 | 1.41 | 0.75 | |||
| 3 | PE22 | 14.11 | 1.29 | 0.68 | |||
| 4 | OG26 | 14,00 | 1.28 | 0.68 | |||
| 5 | OG43 | 13.79 | 1.26 | 0.67 | |||
| 6 | TH61 | 13.46 | 1.23 | 0.66 | |||
| 7 | OG38 | 13.46 | 1.23 | 0.65 | |||
| RC02 | 8 | OG30 | Cross functional support | 9.87% | 13.98 | 1.38 | 0.73 |
| 9 | OG29 | 13.78 | 1.36 | 0.72 | |||
| 10 | OG36 | 13.48 | 1.33 | 0.71 | |||
| 11 | OG33 | 13.07 | 1.29 | 0.68 | |||
| 12 | OG31 | 12.56 | 1.24 | 0.66 | |||
| 13 | PR06 | 11.65 | 1.15 | 0.61 | |||
| 14 | OG32 | 11.04 | 1.09 | 0.58 | |||
| 15 | OG34 | 10.44 | 1.03 | 0.55 | |||
| RC03 | 16 | TH62 | Configuration system | 2.42% | 52.89 | 1.28 | 0.68 |
| 17 | TH63 | 47.11 | 1.14 | 0.60 | |||
| RC04 | 18 | TH79 | Vendor engagement | 5.13% | 28.07 | 1.44 | 0.77 |
| 19 | TH77 | 25.34 | 1.30 | 0.69 | |||
| 20 | TH78 | 25.15 | 1.29 | 0.69 | |||
| 21 | TH74 | 21.44 | 1.10 | 0.59 | |||
| RC05 | 22 | PR01 | Committed to change | 4.12% | 35.19 | 1.45 | 0.77 |
| 23 | PR04 | 33.98 | 1.40 | 0.74 | |||
| 24 | PR05 | 30.83 | 1.27 | 0.67 | |||
| RC06 | 25 | OG58 | Project planning (budget) | 1.24% | 100,00 | 1.24 | 0.66 |
| RC07 | 26 | TH75 | Helpdesk system | 2.43% | 53.09 | 1.29 | 0.69 |
| 27 | TH76 | 46.91 | 1.14 | 0.61 | |||
| RC08 | 28 | OG48 | Data & information standarization | 3.59% | 35.1 | 1.26 | 0.67 |
| 29 | OG41 | 32.87 | 1.18 | 0.63 | |||
| 30 | OG42 | 32.03 | 1.15 | 0.61 | |||
| RC09 | 31 | PR07 | Open minded for changes | 4.05% | 35.31 | 1.43 | 0.76 |
| 32 | PE11 | 33.58 | 1.36 | 0.72 | |||
| 33 | PE12 | 31.11 | 1.26 | 0.67 | |||
| RC10 | 34 | PE25 | Employee involvement | 3.38% | 33.73 | 1.14 | 0.60 |
| 35 | PE20 | 33.43 | 1.13 | 0.60 | |||
| 36 | PE21 | 32.84 | 1.11 | 0.59 | |||
| RC11 | 37 | PE08 | Management’s skill & competency | 1.27% | 100,00 | 1.27 | 0.68 |
| RC | No | Indica-tors | Sub-variables | Main weights | Final weights | Weights factors | Prefe rences |
| RC12 | 38 | PR02 | Business processes change | 2.7% | 50.37 | 1.36 | 0.72 |
| 39 | PR03 | 49.63 | 1.34 | 0.71 | |||
| RC13 | 40 | OG49 | Communica tion | 7.82% | 19.05 | 1.49 | 0.79 |
| 41 | OG57 | 17.14 | 1.34 | 0.71 | |||
| 42 | TH73 | 16.62 | 1.30 | 0.69 | |||
| 43 | OG60 | 16.37 | 1.28 | 0.68 | |||
| 44 | TH67 | 15.47 | 1.21 | 0.64 | |||
| 45 | TH68 | 15.35 | 1.20 | 0.64 | |||
| RC14 | 46 | PE19 | Involved Business Process Owner | 1.21% | 100,00 | 1.21 | 0.64 |
| RC15 | 47 | OG45 | Size of organization | 3.7% | 34.32 | 1.27 | 0.68 |
| 48 | OG51 | 32.97 | 1.22 | 0.65 | |||
| 49 | OG44 | 32.7 | 1.21 | 0.64 | |||
| RC16 | 50 | PE23 | Clear responsibilities of project | 2.36% | 48.73 | 1.15 | 0.61 |
| 51 | PE24 | 51.27 | 1.21 | 0.64 | |||
| RC17 | 52 | OG47 | Top management commitment | 2.58% | 50.78 | 1.31 | 0.70 |
| 53 | OG46 | 49.22 | 1.27 | 0.67 | |||
| RC18 | 54 | TH69 | IT structure | 2.58% | 50,00 | 1.29 | 0.69 |
| 55 | TH72 | 50,00 | 1.29 | 0.68 | |||
| RC19 | 56 | OG56 | Project planning (scope) | 5.19% | 27.17 | 1.41 | 0.75 |
| 57 | TH70 | 26.20 | 1.36 | 0.72 | |||
| 58 | TH71 | 25.24 | 1.31 | 0.70 | |||
| 59 | OG40 | 21.39 | 1.11 | 0.59 | |||
| RC20 | 60 | PE13 | Delivered to all parties | 2.66% | 54.51 | 1.45 | 0.77 |
| 61 | PE15 | 45.49 | 1.21 | 0.64 | |||
| RC21 | 62 | OG52 | Vision and mission | 6.98% | 18.62 | 1.30 | 0.69 |
| 63 | OG53 | 18.05 | 1.26 | 0.67 | |||
| 64 | OG37 | 17.77 | 1.24 | 0.66 | |||
| 65 | OG35 | 15.33 | 1.07 | 0.57 | |||
| 66 | OG55 | 15.19 | 1.06 | 0.56 | |||
| 67 | OG54 | 15.04 | 1.05 | 0.56 | |||
| RC22 | 68 | PE16 | Transfer knowledge | 6.97% | 19.80 | 1.38 | 0.73 |
| 69 | PE18 | 16.93 | 1.18 | 0.63 | |||
| 70 | TH64 | 16.50 | 1.15 | 0.61 | |||
| 71 | PE09 | 15.78 | 1.10 | 0.58 | |||
| 72 | OG50 | 15.49 | 1.08 | 0.58 | |||
| 73 | PE17 | 15.49 | 1.08 | 0.57 | |||
| RC23 | 74 | PE10 | IT staff’s skill & competency | 2.63% | 53.23 | 1.40 | 0.74 |
| 75 | TH65 | 46.77 | 1.23 | 0.65 | |||
| RC24 | 76 | TH66 | Processes improvement | 5.98% | 22.07 | 1.32 | 0.70 |
| 77 | OG59 | 21.91 | 1.31 | 0.69 | |||
| 78 | TH80 | 19.40 | 1.16 | 0.62 | |||
| 79 | PE14 | 18.90 | 1.13 | 0.60 | |||
| 80 | OG39 | 17.73 | 1.06 | 0.57 |
The results of data processing using TOPSIS, found that organizational variables have the main weight of 43.51%, variable technology has the main weight of 25.03%, variable people have the main weight of 22.06%, and variable processes have the main weight of 9.40%. Thus, the organizational variable is a very dominant variable that determines the level of readiness in implementing ERP for the textile industry in Indonesia. The main weight of variables can be seen in the Table 6.
Table 6: Main weight of variables
| No | Variable | Main Weight |
| 1 | Organizational | 43.51 |
| 2 | Technology | 25.03 |
| 3 | People | 22.06 |
| 4 | Processes | 9.40 |
| 100.00 |
Meanwhile, the teen sub-variables that have a significant main weight can be seen in the Table 7.
Table 7: Weight of sub-variables
| No | Sub-variables | Main weight |
| 1 | Cross functional support | 9.87 |
| 2 | Project champion | 9.14 |
| 3 | Communication | 7.82 |
| 4 | Vision and mission | 6.98 |
| 5 | Transfer knowledge | 6.97 |
| 6 | Processes improvement | 5.98 |
| 7 | Project planning (scope) | 5.19 |
| 8 | Vendor engagement | 5.13 |
| 9 | Committed to change | 4.12 |
| 10 | Open minded for changes | 4.05 |
3.3 Measuring the level of organizational maturity
Based on the weighting of 24 indicators which are the results of data processing using TOPSIS, the authors make a list of questions as a basis for designing an ERP readiness assessment module. The list of assessment questions is in the form of a rubric assessment with the maturity level of the Capability Maturity Model Integration (CMMI) model with being considered the characteristic of initial, defined, managed, measured, and optimized with the readiness of process, people, organizational and technology. The list of Rubric Maturity Assessments can be seen in Table 8.
This rubric assessment will be a reference for the top management or the consultant to test each department involved to get good feedback before implementing ERP for the industry.
Table 8: Rubric Maturity Assessment
| No | Sub-variables | MATURITY LEVEL | ||||
| INITIAL | DEFINED | MANAGED | MEASURED | OPTIMIZED | ||
| 1 | Project champion | The function of a Project Champion in project ERP has not been defined | The function of a Project Champion in project ERP has been defined | The function of a Project Champion in project ERP have been standardized in SOP | The function of a Project Champion in project ERP has been socialized | The function of a Project Champion in project ERP has been evaluated for improvement |
| 2 | Cross functional support | Support from organizational functions in ERP implementation is still informal | Support from organizational functions in implementing ERP has been standardized in SOPs | Support from organizational functions in implementing ERP has been disseminated | Support from organizational functions in implementing ERP has been integrated across departments | Support from organizational functions in implementing ERP has been evaluated for improvement |
| 3 | Configuration system | The system hardware and software configurations affecting the success of ERP implementation have not been identified | The system hardware and software configurations that affect the successful implementation of ERP have been identified | The configuration of the hardware and software systems that affect the success of ERP implementation has been standardized in the SOP | The configuration of hardware and software systems that affect the success of ERP implementation has been socialized | The hardware and software system configurations that affect the success of ERP implementation have been evaluated for improvement |
| 4 | Vendor engagement | Relationships and agreements with vendors that can speed up problem solving related to the ERP implementation process have not yet been identified | Relationships and agreements with vendors that can speed up problem solving related to the ERP implementation process have been identified | Relationships and agreements with vendors that can speed up problem solving related to the ERP implementation process have been standardized in the SOP | Relationships and agreements with vendors that can speed up problem solving related to the ERP implementation process have been integrated with the customer | Relationships and agreements with vendors that can speed up problem solving related to the ERP implementation process have been evaluated for improvement |
| 5 | Committed to change | Management’s commitment to change business processes is still informal. | Management’s commitment to changing business processes has been standardized in the SOP. | Management’s commitment to changing business processes has been socialized | Management’s commitment to change business processes has been synchronized with business strategy | Management’s commitment to changing business processes has been evaluated for improvement |
| 6 | Project planning (budget) | The budget usage that must be strictly controlled during ERP implementation has not been defined | The use of budgets that must be strictly controlled during ERP implementation has been determined | The use of budgets that must be strictly controlled during ERP implementation has been standardized in the SOP | The use of budgets that must be strictly controlled during ERP implementation has been socialized | The use of budgets that must be strictly controlled during ERP implementation has been evaluated for improvement |
| 7 | Helpdesk system | The availability of a helpdesk system can help users quickly solve problems related to the use of ERP that have not been identified | The availability of a helpdesk system can help users quickly solve problems related to the use of ERP that have been identified | The availability of a helpdesk system can help users quickly solve problems related to the use of ERP that have standardized in the SOP | The availability of a helpdesk system can help users quickly solve problems related to the use of ERP that have been socialized | The availability of a helpdesk system can help users quickly solve problems related to the use of ERP that have evaluated for improvement |
| 8 | Data & information standarization | Standardization of data and information on all business operations has not been identified | Standardization of data and information on all business operations has been identified | Standardization of data and information on all business operations has standardized in the SOP | Standardization of data and information on all business operations has been socialized | Standardization of data and information on all business operations has evaluated for improvement |
| 9 | Open minded for changes | Not all parties involved have an open mind in accepting the change process | All parties involved have an open mind in accepting the change process has been identified | All parties involved have an open mind in accepting the change process has been standardized in the SOP | All parties involved have an open mind in accepting the change process has been socialized | All parties involved have an open mind in accepting the change process has evaluated for improvement |
| 10 | Employee involvement | Being actively involved in ERP implementation has not been identified | Being actively involved in ERP implementation has been identified | Being actively involved in ERP implementation has been standardized in the SOP | Being actively involved in ERP implementation has been socialized | Being actively involved in ERP implementation has evaluated for improvement |
| No | Sub-variables | MATURITY LEVEL | ||||
| INITIAL | DEFINED | MANAGED | MEASURED | OPTIMIZED | ||
| 11 | Management’s skill & competency | Management does not yet have expertise in determining strategies for utilizing ERP for business development | Management already has expertise in determining ERP utilization strategies for business development | Management already has expertise in determining ERP utilization strategies for business development and has been standardized in SOPs | Management already has expertise in determining ERP utilization strategies for business development and has been socialized | Management already has expertise in determining ERP utilization strategies for business development and has evaluated for improvement |
| 12 | Business processes change | Changes in business processes are still informal. | Changes in business processes has been standardized in SOPs | Changes in business processes has been socialized | Changes in business processes has been integrated | Changes in business processes has evaluated for improvement |
| 13 | Communica tion | The objectives and objectivity of the project are communicated effectively to the stakeholders involved but have not been identified | The objectives and objectivity of the project are communicated effectively to the stakeholders involved, & have been identified | The objectives and objectivity of the project are communicated effectively to the stakeholders involved, & have been standardized in SOPs | The objectives and objectivity of the project are communicated effectively to the stakeholders involved, & have been socialized | The objectives and objectivity of the project are communicated effectively to the stakeholders involved, & have been evaluated for improvement |
| 14 | Involved Business Process Owner | ERP business process mapping has not been defined. | ERP business process mapping has been defined. | ERP business process mapping have been standardized in SOPs | ERP business process mapping have been socialized | ERP business process mapping have been evaluated for improvement |
| 15 | Size of organization | The organizational size that affects the success of an ERP project has not been defined | The organizational size that affects the success of an ERP project has been defined | The organizational size that affects the success of an ERP project has been standardized in SOPs | The organizational size that affects the success of an ERP project has been socialized | The organizational size that affects the success of an ERP project has been evaluated for improvement |
| 16 | Clear responsibilities of project | The roles of project stakeholders have not been defined | The roles of project stakeholders have been defined | The roles of project stakeholders have been standardized in SOPs | The roles of project stakeholders have been socialized | The roles of project stakeholders have been evaluated for improvement |
| 17 | Top management commitment | Top management has not been actively involved in every process and monitors the progress of the ERP project | Top management has been actively involved in every process and monitors the progress of the ERP project | Top management has been actively involved in every process and monitors the progress of the ERP project, & have been standardized in SOPs | Top management has been actively involved in every process and monitors the progress of the ERP project, & have been socialized | Top management has been actively involved in every process and monitors the progress of the ERP project, & have been evaluated for improvement |
| 18 | IT structure | The IT team structure to coordinate ERP project activities from planning to post-go live has not been identified | The IT team structure to coordinate ERP project activities from planning to post-go live has been identified | The IT team structure to coordinate ERP project activities from planning to post-go live has been identified, & have been standardized in SOPs | The IT team structure to coordinate ERP project activities from planning to post-go live has been identified, & have been socialized | The IT team structure to coordinate ERP project activities from planning to post-go live has been identified, & have been evaluated for improvement |
| 19 | Project planning (scope) | The scope of the ERP project in determining the success of ERP implementation has not been defined | The scope of the ERP project in determining the success of ERP implementation has been defined | The scope of the ERP project in determining the success of ERP implementation have been standardized in SOPs | The scope of the ERP project in determining the success of ERP implementation have been socialized | The scope of the ERP project in determining the success of ERP implementation have been evaluated for improvement |
| 20 | Delivered to all parties | Training activities have not been delivered to all parties involved. | Training activities have been delivered to all parties involved. | Training activities have been delivered to all parties involved, & have been standardized in SOPs | Training activities have been delivered to all parties involved, & have been socialized | Training activities have been delivered to all parties involved, & have been evaluated for improvement |
| 21 | Vision and mission | The vision and mission of the organization that was revealed and communicated to all parties involved to support the implementation of the ERP project has not been defined | The vision and mission of the organization that was revealed and communicated to all parties involved to support the implementation of the ERP project has been defined | The vision and mission of the organization that was revealed and communicated to all parties involved to support the implementation of the ERP project has been defined, & have been standardized in SOPs | The vision and mission of the organization that was revealed and communicated to all parties involved to support the implementation of the ERP project has been defined, & have been socialized | The vision and mission of the organization that was revealed and communicated to all parties involved to support the implementation of the ERP project has been defined, & have been evaluated for improvement |
| 22 | Transfer knowledge | There is no awareness from users and the benefits of knowledge transfer to improve the quality of users | There is awareness from users and the benefits of knowledge transfer to improve the quality of users | There is awareness from users and the benefits of knowledge transfer to improve the quality of users, & have been standardized in SOPs | There is awareness from users and the benefits of knowledge transfer to improve the quality of users, & have been socialized | There is awareness from users and the benefits of knowledge transfer to improve the quality of users, & have been evaluated for improvement |
| 23 | IT staff’s skill & competency | IT Staff does not have the expertise & experience in understanding the business processes of the system used. | IT Staff have the expertise & experience in understanding the business processes of the system used. | IT Staff have the expertise & experience in understanding the business processes of the system used, & have been standardized in SOPs | IT Staff have the expertise & experience in understanding the business processes of the system used, & have been socialized | IT Staff have the expertise & experience in understanding the business processes of the system used, & have been evaluated for improvement |
| 24 | Processes improvement | The identification of process improvements before ERP implementation has not been identified | The identification of process improvements before ERP implementation has been identified | The identification of process improvements before ERP implementation have been standardized in SOPs | The identification of process improvements before ERP implementation have been socialized | The identification of process improvements before ERP implementation have been evaluated for improvement |
4. Conclusion
The ERP implementation process for the industry has a high complexity, which will risk a high failure rate. However, the problem of the complexity of ERP implementation in the textile industry can be resolved by identifying readiness factors that focus on four main components such as processes, people, organizational, and technology before implementing ERP. Thus, the organizations can identify weaknesses and anticipate improvements, thereby increasing the success rate of ERP implementation. The research result shows that the score of organizational variable is 43.50% and the domain factors that influence ERP readiness assessment with significance factors are project champion (9.14%), cross-functional support (9.87%), project planning scope (5.19%), vision and mission (6.98%), and communication (7.82%). For this reason, it is necessary to develop of ERP readiness assessment, so that the managerial level can easily analyze the maturity level of the organization that need to be improved. The author realizes that this research has limitations in conducting case studies in the textile industry. For this reason, this research can be continued with case studies in the wider industry, and this research can also be developed by developing an ERP readiness assessment module as an information system for the management level in deciding to continue implementing ERP.
- M. Kirmizi, B. Kocaoglu, “The key for success in enterprise information systems projects: development of a novel ERP readiness assessment method and a case study,” Enterprise Information Systems, 14(1), 1–37, 2020, doi:10.1080/17517575.2019.1686656.
- J. Ram, D. Corkindale, M.L. Wu, “Examining the role of organizational readiness in ERP project delivery,” Journal of Computer Information Systems, 55(2), 29–39, 2015, doi:10.1080/08874417.2015.11645754.
- P. Hanafizadeh, A.Z. Ravasan, “A McKinsey 7S model-based framework for ERP readiness assessment,” International Journal of Enterprise Information Systems, 7(4), 23–63, 2011, doi:10.4018/jeis.2011100103.
- J. Razmi, M.S. Sangari, R. Ghodsi, “Developing a practical framework for ERP readiness assessment using fuzzy analytic network process,” Advances in Engineering Software, 40(11), 1168–1178, 2009, doi:10.1016/j.advengsoft.2009.05.002.
- S. De Soysa, J. Nanayakkara, “Readiness for ERP implementation in an organization: Development of an assessment model,” 2nd International Conference on Information and Automation, ICIA 2006, 00, 27–32, 2006, doi:10.1109/ICINFA.2006.374147.
- M. El Mariouli, J. Laassiri, “Information Systems and Technologies to Support Learning,” 111, 471–481, 2019, doi:10.1007/978-3-030-03577-8.
- J.R. Lavoie, T.U. Daim, “Technology readiness levels enhancing R&D management and technology transfer capabilities: insights from a public utility in Northwest USA,” International Journal of Transitions and Innovation Systems, 6(1), 48, 2018, doi:10.1504/ijtis.2018.10011690.
- S. Ahmadi, E. Papageorgiou, C.H. Yeh, R. Martin, “Managing readiness-relevant activities for the organizational dimension of ERP implementation,” Computers in Industry, 68, 89–104, 2015, doi:10.1016/j.compind.2014.12.009.
- K.P. Subramaniya, C. Ajay Guru Dev, V.S. Senthilkumar, “Critical Success Factors: A TOPSIS approach to increase Agility Level in a Textile Industry,” Materials Today: Proceedings, 4(2), 1510–1517, 2017, doi:10.1016/j.matpr.2017.01.173.
- S. Shiri, A. Anvari, H. Soltani, “Identifying and prioritizing of readiness factors for implementing ERP based on agility (extension of McKinsey 7S model),” European Online Journal of Natural and Social Sciences, 4(1), 56–74, 2015.
- Harold J. Leavitt, “Applied Organizational Change in Industry, Structural, Technological Humanistic Approaches,” Handbook of organizations, 1965.
- D. Sundiman, C.H. Wu, A. Mursidi, S.B.P. Johan, A. Indahingwati, “Knowledge management key factors: An empirical research on small and medium-sized enterprises in Indonesia,” 13(2), 139–161, 2019, doi:10.1504/IJBSR.2019.098650.
- C.L. Hwang, K. Yoon, “Methods for Multiple Attribute Decision Making,” 58–191, 1981, doi:10.1007/978-3-642-48318-9_3.
- A.N. Hidayanto, M.A. Hasibuan, P.W. Handayani, Y.G. Sucahyo, “Framework for measuring ERP implementation readiness in small and medium enterprise (SME): A case study in software developer company,” Journal of Computers (Finland), 8(7), 1777–1782, 2013, doi:10.4304/jcp.8.7.1777-1782.
- Meyliana, A.N. Hidayanto, E.K. Budiardjo, “The critical success factors for customer relationship management implementation: A systematic literature review,” International Journal of Business Information Systems, 23(2), 131–174, 2016, doi:10.1504/IJBIS.2016.078904.
- H. Sun, W. Ni, R. Lam, “A step-by-step performance assessment and improvement method for ERP implementation: Action case studies in Chinese companies,” Computers in Industry, 68, 40–52, 2015, doi:10.1016/j.compind.2014.12.005.
- W.H. Tsai, Y.W. Chou, J. Der Leu, D.C. Chen, T.S. Tsaur, “Investigation of the mediating effects of IT governance-value delivery on service quality and ERP performance,” Enterprise Information Systems, 9(2), 139–160, 2015, doi:10.1080/17517575.2013.804952.
- P.B. Tarigan, “Agile Enterprise Resource Planning Implementation: Improving ERP Implementation Success Rates,” Journal of Chemical Information and Modeling, 53(9), 1689–1699, 2013, doi:10.1017/CBO9781107415324.004.
- S. Abdelkebir, Y. Maleh, M. Belaissaoui, “An Agile Framework for ITS Management In Organizations,” 1–8, 2017, doi:10.1145/3167486.3167556.