Traffic Aggregation Techniques for Optimizing IoT Networks
Volume 6, Issue 1, Page No 509-518, 2021
Author’s Name: Amin S. Ibrahim1,2, Khaled Y Youssef3,a), Mohamed Abouelatta1
View Affiliations
1Faculty of Engineering, Electronics and Electrical Communication, Ain Shams University (ASU), Cairo, 11757, Egypt
2Institute of Engineering, Electronics and Electrical Communications, Thebes Higher Institutes, Cairo, 11757, Egypt
3Faculty of Navigation Science and Space Technology, Beni-Suef University (BSU), Beni Suef, 62511, Egypt
a)Author to whom correspondence should be addressed. E-mail: khalid_youssif@yahoo.com
Adv. Sci. Technol. Eng. Syst. J. 6(1), 509-518 (2021); ![]() DOI: 10.25046/aj060156
DOI: 10.25046/aj060156
Keywords: IoT, Smart City, Traffic Shaping Profile, Node Aggregation, Time Aggregation, Network Performance metrics

Export Citations
Internet of Things (IoT) is changing the world through a new wave of revolution for communications technologies that are no more limited to the human being. One of the main challenges that result from the exponential spread of IoT technology is the difference in the traffic characteristics between classical human communications and advanced things communications. The IoT traffic characteristics become essential for understanding and studying the parameters affecting the IoT traffic shape and thus all further studies related to traffic aggregation, topologies, and architecture designs. In this paper, a traffic aggregation in both the space domain and time domain is proposed whereas a matrix of traffic parameters is analyzed and simulated through building a practical lab case study to demonstrate the theoretical results. It is proven that the two proposed aggregation techniques could impact the traffic profile shaping existing IoT use cases for optimizing the network efficiency from several perspectives as 20% high throughput gain, 45% low collision probability, network congestion is limited to 800~1600 packets in the space domain and about 300~20 packets in the time domain, and overheads are minimized by about 50~27 Kbytes in the space domain and 9.5~0.59 Kbytes in the time domain.
Received: 20 November 2020, Accepted: 17 January 2021, Published Online: 28 January 2021
- Https://www.idc.com/getdoc.jsp?containerId=prUS45213219 last accessed September 2019.
- E. Fitzgerald, M. Pióro, A. Tomaszewski, “Energy-Optimal Data Aggregation and Dissemination for the Internet of Things,” IEEE Internet of Things Journal, 5(2), 2018, doi: 10.1109/JIOT.2018.2803792.
- H. Rahman , N. Ahmed, M.I. Hussain, “A hybrid data aggregation scheme for provisioning Quality of Service (QoS) in Internet of Things (loT),” Cloudification of the Internet of Things (CIoT), 2016, doi: 10.1109/CIOT.2016.7872917.
- Y. Li, Y. Huang, X. Su, J. Riekki, H. Flores, C. Sun, H. Wei, H. Wang, L. Han, “Gamma-modulated wavelet model for internet of things traffic,” IEEE International Conference (ICC), SAC Symposium Internet of Things Track, 2017, doi: 10.1109/ICC.2017.7996506.
- A.L.R. Madureira, F.R.C. Araújo, L. N. Sampaio, “On supporting IoT data aggregation through programmable data planes,” Computer Networks, 177, 2020, doi: 10.1016/j.comnet.2020.107330.
- S. Redhu, R.M. Hegde, “Multi-Sensor Data Fusion for Cluster-based Data Aggregation in IoT Applications,” IEEE International Conference on Advanced Networks and Telecommunications Systems (ANTS), 2020, doi: 10.1109/ANTS47819.2019.9117970.
- M. H. Homaei, E. Salwana, S. Shamshirband, “An Enhanced Distributed Data Aggregation Method in the Internet of Things,” MDPI Sensors, 19(3173), 2019, doi: 10.1109/ANTS47819.2019.9117970.
- A. Alkhamisi, M.S. Haja, S.M. Buhari, “A Cross-Layer Framework for Sensor Data Aggregation for IoT Applications in Smart Cities,” 2016 IEEE International Smart Cities Conference (ISC2), 2016, doi: 10.1109/ISC2.2016.7580853.
- N. Bradai, L.C. Fourati, L. Kamoun, “WBAN data scheduling and aggregation under WBAN/WLAN healthcare network,” Journal of Ad Hoc Networks, 25, 251–262, 2015, doi:10.1016/j.adhoc.2014.10.017.
- T. Hoßfeld, F. Metzger, P. E. Heegaard, “Traffic modeling for aggregated periodic IoT data,” 21st IEEE Conference on Innovation in Clouds, Internet and Networks and Workshops (ICIN), 2018, doi: 10.1109/ICIN.2018.8401624.
- H. Yoshino, K. Ota, T. Hiraguri, “Queueing delay analysis and optimization of statistical data aggregation and transmission systems,” IEICE Transactions Communication, E101-B(10), 2186–2195, 2018, doi: 10.1587/transcom.2018EBP3010.
- H. Yoshino, K. Ota, T. Hiraguri, “Adaptive Control of Statistical Data Aggregation to Minimize Latency in IoT Gateway,” 2018 Global Information Infrastructure and Networking Symposium (GIIS), 2018, doi: 10.1109/GIIS.2018.8635712.
- J.D.C. Silva, P.H.M. Pereira, L.L. De-Souza, C.N.M. Marins, G.A.B. Marcondes, J.J.P.C. Rodrigues, “Performance Evaluation of IoT Network Management Platforms,” IEEE International Conference on Advances in Computing, Communications and Informatics (ICACCI), 259–265, 2018, doi: 10.1109/ICACCI.2018.8554364.
- F. Ge, L. Tan, M. Zukerman, “Throughput of FAST TCP in Asymmetric Network,” IEEE Communication Letter, 12(2), 158–160, 2008, doi: 10.1109/LCOMM.2008.071623.
- A. Rizal, Y. Bandung, “Passive Available Bandwidth Estimation Based on Collision Probability and Node State Synchronization in Wireless Networks,” ITB Journal Publisher, J. ICT Res. Appl., 11(2), 131–150, 2017, doi: 10.5614/itbj.ict.res.appl.2017.11.2.2.
- A. Maheshwari, R.K. Yadav, “Analysis of Congestion Control Mechanism for IoT,” IEEE Cloud Computing, Data Science & Engineering Conference, 288–293, 2020, doi: 10.1109/Confluence47617.2020.9058058.
- H.A.A. Al-Kashoash, Y. Al-Nidawi, A. H.Kemp, “Congestion-Aware RPL for 6LoWPAN Networks,” IEEE Wireless Telecommunications Symposium (WTS), 2016, doi: 10.1109/WTS.2016.7482026.
- H. Verma , M. Jain , K. Goel , A. Vikram , G. Verma, “Smart home system based on Internet of Things,” 2016 3rd International Conference on Computing for Sustainable Global Development, 2016.
- B. Sarwar, I.S. Bajwa, N. Jamil, S. Ramzan, N. Sarwar, “An Intelligent Fire Warning Application Using IoT and an Adaptive Neuro-Fuzzy Inference System,” MDPI Sensors, 19(14), 2019, doi: 10.3390/s19143150.
- A.S. Ibrahim, K.Y. Youssef, H. Kamel, M. Abouelatta, “On Traffic Modelling of IoT Smart City Use Case,” IET Communication journal, 14(8), 1275–1284, 2020, doi: 10.1049/iet-com.2019.1252.
1.Introduction
Internet of things is the fabric that enables the exchange of information between people, things, and processes which in turn leads to a growing data sphere and sophisticated traffic models as a result of diversified sources of data. The number of IoT devices is in an increasing exponential increase that is expected to reach 41.6 billion devices in 2025 with a corresponding data growth that is expected to reach 79.4 Zettabyte in 2025 within a compound annual growth rate of 28.7% over 2018 to 2025 [1]. The expected growth in adoption of IoT is attributed to several factors including:
- The diversity of industries that is perceiving the IoT as a key solution for their existing problems as healthcare, manufacturing, agriculture as well as smart communities and smart cities.
- The advances in network technologies could carry efficiently the IoT traffic. 5G network technologies are a good example.
- Presence of new cost-effective surveillance techniques as low cost embedded integrated cameras, drones technologies etc. video surveillance data is expected to grow at a compound annual growth rate of 60% from 2018 to 2025.
Accordingly, traffic aggregation is becoming significant to shape the traffic generated by such a world of sensors and cameras efficiently. Traffic aggregation rules could be applied at different stages including sources, aggregators, routers, and gateways.
The data aggregation can accurately summarize and combine multiple stream data into one data chunk to reduce the number of packets to be sent in the large scale networks [2, 3].
In this paper, the main key IoT traffic challenges that are addressed by the aggregation techniques proposed are the massive number of terminal devices and a burst traffic profile of node with the massive amount of data transmissions (number of sent packets), Data volume (light or heavy), and payload size.
The paper contributed value is mainly in organizing the high network nodes (colocation) and the number of massive transmissions times (grooming time) using aggregation strategy as two main traffic aggregation techniques to shape and schedule several IoT traffic profiles of the IoT smart city nodes for efficient IoT network.
A proposed model for IoT traffic data control includes the following;
- Traffic parametric analysis (space and time)
- Key factors affecting the traffic profile shaping
- IoT smart city architecture model for optimized traffic profile shaping
- Building real-time experiments (case study) based on the IoT smart city nodes before and after the two proposed aggregation techniques.
The smart city case study is analyzed with an associated lab setup for results measurements. In the lab work, the effect of several parameters (node-multiplex, time multiplex, data grooming…etc.) is studied against the traffic profiles. Traffic models are built as a function of those parameters and a traffic aggregation approach is proposed to model and shape the IoT traffic for efficient and reliable network operation. The experimental pilot shall consider single and multiple IoT devices against space and time multiplexing using a proposed colocation and grooming methodologies.
The paper is organized as follows: a literature review is presented in section 2. The proposed traffic aggregation techniques are discussed in section 3 followed by explaining the dimensions of network performance metrics in section 4. The experimental setup and the results are presented in section 5. The discussion and conclusion are discussed afterward.
2. Related Work
The previous works studied technologies related to two main traffic aggregation approaches in the IoT networks that are complemented by the following studies:
2.1. The node-based aggregation
Authors in [3] proposed hybrid Quality of Service-Aware Data Aggregation (QADA) scheme that is a combination between the data aggregation of the cluster nodes and the aggregation of the tree nodes to overcome the limitations in both existing tree and cluster aggregation processes in order to reduce the power consumption and increase the network lifetime. QADA architecture model of the 101 nodes are designed and simulated using NS2.35 network simulator, compared to the existing tree and cluster aggregation techniques to prove the concept.
Authors in [4] discussed the IoT traffic characteristics in the smart city use case. The authors proposed the smart city network architecture for collecting IoT traffic data of the smart city nodes of different scenarios as Logistics goods tracking, university campus, smart hospital, smart homes, mobile payment, Smart Shopping Centre, Intelligent Transport, and smart grid. They also collected the IoT traffic aggregation from different scenarios on one or many gateways for modeling the overall collected traffic using the Gamma-Modulated Wavelet model.
The Internet of Things Protocol (IoTP) is introduced in the IoT communication layer to aggregate data of the massive number of IoT devices into one aggregator in such IoT scenario model. The protocol is programmed by using the P4 high-level language to be implemented on the switch aggregation that forwards the data aggregation into IoT gateway. The main findings in the IoTP are to improve the network efficiency, reduce the number of packets sent, total payload sent, control average aggregation delay, and average IoT device battery. However, the IoTP aggregation strategy is limited to handle 50 data blocks with a 200KB limit of the P4 register, also, to cover a very short-range communication technology as Bluetooth Low Energy (BLE) [5].
The authors in [6] grouped the sensors in the IoT network into different clusters using a fused resemblance matrix based on the sensor behavior as acoustic, light, and radio. The cluster-based data aggregation for IoT application is developed by multi-sensor data fusion workflow for obtaining the robust cluster that can provide an energy-efficient data aggregation over the IoT networks. However, the number of transmitted data packets is higher in the cluster-based aggregation than in other modalities.
The work in [7] proposed the dynamic aggregation approach based learning automata for the Routing Protocol for Low-power and Lossy-network (LA-RPL). The learning automata develops each node in the IoT hierarchical networks, including child nodes, parent nodes, and one Sink node to aggregate data on the parent nodes with the help of the Cooja emulator. The simulation results show that the LA-RPL routing algorithm outperforms other routing schemes (RPL, Adaptive RPL, Bounding Degree RPL, and Modified RPL) in terms of energy and the control overheads, average path length, average delay. Besides, the practice tests are implemented in this article to evaluate the drop packets, PDR, and aggregation percentage among the routing strategies.
The authors in [8] proposed the Cross-Layer Commit Protocol (CLCP) for data aggregation and its efforts for query-based search in the IoT smart city application. The NS2 simulator tests 50-nodes, deployed in the 600m×600m area and clustered into multiple groups to show an impact of CLCP based cluster head selection with or without aggregation on the network performance, compared to Energy Efficient Clustering Protocol (EECP) methods. It is noted that CLCP and EECP for data aggregation have the same actual residual energy values. However, the CLCP without aggregation outperforms other approaches in terms of the overheads and the throughput.
Compared to the Priority Queue Aggregation Scheduler (PQA) and Priority Queue Scheduler (PQ), the authors in [9] presented the Priority Frame aggregation (PFA) and the Priority Frame (PF) in the Wireless Body Area Network/ Wireless Area Network (WBAN/WLAN) healthcare system architecture. In the WBAN networks, a set of healthcare sensors are originated and deployed in the human body to be connected to the Personal Servers (PSs), which bridge with the WLAN Access Point (WLAN-AP) in the WLAN networks. The proposed PFA and PF schedulers perform scheduling of different data traffics, mapping between WBAN and WLAN, and data aggregation of WBAN sensors into WLAN frame. The PS device forwards it into the central server. The simulation results show that the two proposed PFA and PF schedulers outperform other techniques in terms of delay and throughput, and the dropped packets as the collision probability indicator.
2.2. The time-based aggregation
The authors in [10] presented the Aggregation Periodic Process (APP) to aggregate the periodic IoT data every sample time on the IoT gateway. The aggregated periodic IoT data characteristics are presented and compared to the Poisson Process (PP) to approximate the APP scheme by the PP scheme and then quantify an error between the periodic aggregation and Poisson aggregation.
In the previous study [11], the two statistical data aggregation schemes: the constant interval and constant number are analyzed and estimated to find the optimal aggregation parameters (optimal aggregation interval and the optimal aggregation number), which enable the aggregation model to minimize the mean total system time. But, the optimal aggregation results are suited for stationary arrival conditions.
Accordingly, the work-study in [12] proposed the adaptive aggregation number control based on the aggregation constant number scheme to minimize the latency for variation arrival rate conditions.
3. Proposed model
Despite the contributions of the related works aforementioned above, we explore the aggregation capabilities in the IoT smart city network for IoT traffic profile shaping on one side and optimizing the IoT network performance on the other side. The proposed traffic aggregation techniques can reap the benefits of the data aggregation approach in the WLAN network through the practical design methodology that had not been available yet.
As a key traffic shaping technique, two main IoT traffic multiplexing techniques are presented mainly (a) the space domain aggregation, and (b) the time domain aggregation. The two approaches play a significant role to shape the traffic profile to be optimum and efficient for carrier networks, compared to the present smart city networks. Accordingly, the composite traffic parameters shall include two main attributes, the space domain, and the time domain.
3.1. Space domain attribute
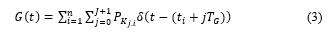
The space domain attribute or Colocation attribute indicates the number of the possible number of source nodes integrated into one hub node or more according to the network topology. Accordingly, the hub node could be modeled as a multiple-input (N) single (M) output node. In addition, the definition of the space domain attribute goes beyond the processing node down to the transducer level as the same source node could be connected to multiple transducer nodes for efficient operation. The number of transducer points (N) could be connected to one source node that in turn share with other numbers of nodes (M) a hub bandwidth. Thus, the N-sensor/M-node model is typed into Single-node type (N=M) and Multi-node type (N≠M, M=1) as seen in Figure 1. Like the previous works [3-9], the Single-node type collaborates the data traffic from M source nodes into the sink node. On the other hand, the Multi-node type can collect the data traffic from N sensors of the same source node into the sink node.
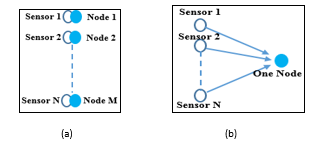 Figure 1: Colocation domain attribute (N sensor/M nodes model)
(a) Single node type(N=M), (b) Multi-node type (N≠M, M=1)
3.2. Time-domain attribute
As presented in the work [12], the time domain aggregation can aggregate data traffic every constant inter-arrival time from the Single-node/Multiple-node into the sink node to overcome the problem of the stationary arrival conditions in the related works [10, 11].
The time-domain attribute indicates the time aggregate of several data streams out of transducer level at the source node either aperiodic or periodic into one IoT output data stream including all protocols necessary to distinguish traffic from different sources and correlation of respective scenarios. In this paper, the term “grooming” will be used to describe the act of multiplexing to distinguish IoT traffic multiplexing concept against traditional multiplexing techniques. The concept is more towards aggregation buffering of data bytes sent at different random time slots into a periodic time slot with a minimal impact on the functional requirements of the applications.
It is assumed that number of source nodes in the grooming process is asynchronous and homogenous. the grooming process is a random process at any instantaneous time . Each source node sends multiplexed data packets uniformly every periodic inter-arrival time . Let the source node emits one message every second. A unique message has a fixed-length in bytes per node. For a constant sampling time duration, the data packets to be sent will be:
![]() The grooming time can be incremented by grooming index to be multiple times as . Where G represents the grooming index or a multiplier factor that produces multiple numbers of inter-arrival times. The grooming function for a unique node (e.g. ) becomes:
The grooming time can be incremented by grooming index to be multiple times as . Where G represents the grooming index or a multiplier factor that produces multiple numbers of inter-arrival times. The grooming function for a unique node (e.g. ) becomes:
![]() Where the packets generated by a source node times can be detected based on the experiment time and the waiting time as ( . The grooming function of finite number of nodes in the network scenario seems to be an impulse signal (e.g. delta function), having amplitude and appears every . It can be described as:
Where the packets generated by a source node times can be detected based on the experiment time and the waiting time as ( . The grooming function of finite number of nodes in the network scenario seems to be an impulse signal (e.g. delta function), having amplitude and appears every . It can be described as:
 4. Network Performance Metrics
Network performance enhancement is one of the key objectives behind the traffic aggregation approaches. The techniques proposed in this paper targets an improvement in five main key performance indicators mainly:
4.1. Traffic volume
Traffic volume is the amount of data exchanged between a 2-dimensional traffic matrix of node pairs (traffic profile) in the IoT network. It can be measured by two main forms: the average data rate (Kbps) and packets data values (Kbits).
4.2. Throughput
The throughput is the amount of successful data delivered between two IoT source nodes over the wireless communication channel for a specified period, resulting in kilobits per second (Kbps) [13].
Recently, the throughput of the source in the FAST TCP model is a source sending rate or multiplied by the forward packet size as:
 Throughput is improved by high when Asymmetry Factor (AF) is greater than one. Where represents a connection of asymmetric link between the two routers of a model. It is based mainly on asymmetry capacity ratio (ACR) and asymmetry packet ratio (APR) [14].
In the IoT technology, the asymmetry link has no effect on the wireless connectivity among IoT nodes in the same AP (router). the factor is ignored. and of the forward and backward packets could be addressed into the sending rate (packets/s) from one thing node (source/destination) to another one. Thus, the throughput can be derived from (4) as:
![]() while is the packet size (bytes), excluded from the fixed overheads. Consequently, the throughput percentage is the ratio between the useful data packets to the total amount of data packets including overheads.
while is the packet size (bytes), excluded from the fixed overheads. Consequently, the throughput percentage is the ratio between the useful data packets to the total amount of data packets including overheads.
4.3. Collision probability
The number of collision packets to the total number of transmitted packets is the packet collision probability.
Recently, the collision of the IEEE802.11 standard occurs when multiple stations share the wireless channel to transmit data at the same time onto a receiver. The access technique caused more delay and packet data-flow degradation. In this technique, each node listens to the silence (idle) of the channel for the Distributed Coordination Function (DCF) Inter-Frame Space (DIFS) interval. The standard grants all nodes random backoff time before the transmission or retransmission on the wireless radio channel. When DIFS time is released and the channel is not busy, the senders are ready to transmit data after variable backoff times. The randomization of this time led to an increase in the probability of packet collision, which is given as [15]:
![]() The term describes the channel access probability. It is the probability that the station attempts to send data in arbitrary waiting time slots. By analogy, the same model could be applied on IoT networks including the parameters highlighted in the section above to be as follows:
The term describes the channel access probability. It is the probability that the station attempts to send data in arbitrary waiting time slots. By analogy, the same model could be applied on IoT networks including the parameters highlighted in the section above to be as follows:
 4.4. Network traffic congestion
With the increasing number of high data transmission rates in IoT use cases, Network congestion can arise from high request traffic in the network. The congestion control mechanisms have been discussed based on protocols and offloading approaches to avoid the buffer overflow in the IoT networks. In the protocol approach, congestion control mechanisms focus on the application layer and the network layer. Throughput and Packet Delivery Ratio (PDR) metrics are improved to reduce the number of lost packets caused by the congestion in the network layer. While throughput is aforementioned. PDR is the ratio of the total number of received packets in the destination (sink) node to the total number of sent packets in the source nodes [16,17].
On the other hand, the network traffic congestion could be evaluated by the number of sent packets by the source nodes in the IoT networks.
4.5. Control overheads
The control overheads are excess data or the control header behind the useful data in the packet format for a specific task. It is measured per bytes or Kilobytes.
5. Experimental Results Analysis
5.1. Experimental setup
An experimental lab is established to collect, analyze, and profile the traffic model based on practical smart city use cases. Based on the architecture highlighted in figure 2, the prototype built for proof of concept purpose is composed of:
- The sensor layer is designed to develop several scenarios related to smart city use cases from different perspectives as safety, security, energy, and environment. Table 1 shows the sensors used in an experimental study [18-20].
- The processing layer is based on the ESP micro-controller family including ESP 8266 MCU units and Wi-Fi 802.11b/g/n unit as a network interface module. ESP 8266 MCU unit is programmed to perform both the space domain aggregation and time-domain aggregation processes in the broker node. While the Wi-Fi unit enables the nodes to communicate with other nodes in the IoT network.
- The communication layer is architected according to the network diagram in figure 2, to enable different topologies to be configured and experimentally measured. Intermediate nodes are introduced to enable the traffic shaping and aggregation factors being applied as the broker node.
- The networking layer includes all network scenarios among IoT sensor nodes in the smart city architecture as physical security scenario, human safety scenario, energy scenario, device control and management scenario, and the environment scenario. Each scenario network has two or three connected IoT nodes with the TCP/IP connection protocol. The paper examines the human safety scenario nodes specifically scenario 3 (fire-node, smoke-node) and cloud scenario (fire-node and webserver) that is presented in the classical smart city networks [20].
Table 1: Sensor Layer Specifications [18-20]
| Parameters | Sensor model | Measurement range |
| Natural Gas | MQ-5 | (0-1000ppm) |
| Smoke | MQ-2 | (0-10000ppm) |
| Fire | KY026 | (20-100Cm),60° |
| CO | MQ7 | (20-2000ppm) |
| Light detector | TSL2561 | (0.1-40,000) Lux |
| Temperature | DHT22 | (-40-125°C) |
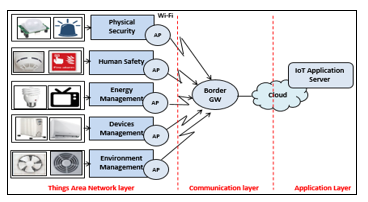 Figure 2: IoT architecture model designed for experimental work [20]
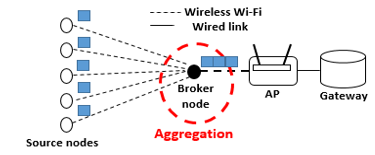 Figure 3: Proposed single-node scenario in the smart city networks
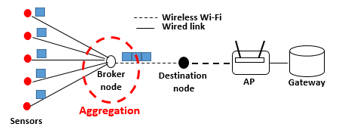 Figure 4: Proposed Multi-node scenario in the smart city networks
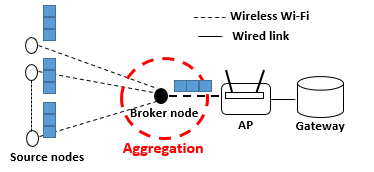 Figure 5: Proposed Time-domain scenario in the smart city networks
A set of experiments are designed to emulate the traffic patterns associated with each type of traffic aggregation either the space domain attribute or the time domain attribute, compared to that before (without) the aggregation process [20]. The experimental setup details are listed in table 2.
On the space domain side, a list of IoT nodes is operating on two models of operations as seen in figures 3 and 4. Figure 3 shows the network model of a Single-node type. While the Multi-node type is architected in figure 4.
In a Single-node experiment, 5-fire source nodes as senders can communicate with an individual smoke receiver node. Each fire-node comprises a fire-sensor subscribed to the processor node. After an initial step of one fire node connects to a unique smoke node, the number of fire nodes is incremented and the results are monitored on each step. As seen in figure 3, the smoke node is a broker that accumulates the traffic profile sent from each fire source node and then forwards it into the AP and the higher layers (gateway and internet). The Multi-node experiment follows the same methodology design of the Single-node experiment except for the five fire nodes of the Single-node type are replaced by five fire sensors that are connected directly to one processor node.
In the multi-node type, the unique fire source node can operate as a broker node, which accumulates traffic profiles of the connected fire-sensors into the traffic aggregation and send them to the destination smoke node.
The time-domain experiment is performed in both one source node experiment and N source nodes experiment as shown in figure 5. In one source node experiment, a single fire node is designed to store and buffer the sensed data and then send a multiplexed sensed data onto one smoke node as a broker node at grooming times of about 1-16 minutes. Each is incremented every 60 seconds. N-sensor nodes experiment is to establish five nodes of Single-node fire sensor and one smoke broker node to emulate the grooming pilot of N source nodes. The experiments are executed for a real-time experiment (960 seconds).
Table 2: Experimental setup details
| Experimental parameters | Space-domain experiments | Time-domain experiments |
| (bytes) | 90-1548 | |
| Header/packet (byte) | 32 | |
| (minute) | N/A | 1-16 |
| Connection protocol | TCP/IP | |
| Wireless communication | Wi-Fi 802.11b/g/n | |
| N nodes/sensors | 1-5 nodes | |
| Sensors type | Fire and Smoke | |
| (sec) | 750 | 960 |
5.2. Results
Before the aggregation process, table 3 lists the limited key performance values of the fire-node in the classical smart city (scenario 3 and cloud scenario).
Table 3: Fire performance values in the classical scenario 3 network
|
|
Throughput % |
Overheads Kbytes |
No. of sent packets |
Traffic volume Kbits/Kbps |
| Sc. 3 | 62.65 | 85.00 | 2720 | 1934/2.01 |
| Cloud | 64.37 | 9.53 | 305 | 214/1.6 |
After the aggregation process, the measurement results of different experimental pilots are summarized into traffic profile results, and network performance metrics results.
In the space attribute, the role of the broker node is exploited as a method of traffic profile shaping for IoT networks. As shown in Figure 6, the Multi-node traffic profile is smoothed with low traffic volume (packets data values), compared to the Single-node type.
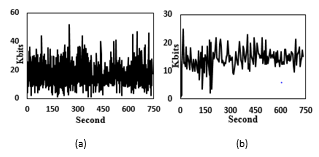 Figure 6: Traffic shaping of N-sensors M-nodes model
- Five-sensors Five-nodes, (b) Five-sensors One-node
Generally, Figure 7 explains the difference of configuration on the space model. Figures 7.a shows the average data rate versus the low number of sensors/nodes for both types of the space domain attribute. An average data rate in the Single-node type begins to increase significantly with an increasing number of nodes. On the other side, the average data rate of the Multi-node type is approximately constant.
As shown in Figure 7.b, it is obvious that the number of sensors attached to the same node has a direct impact on the network throughput on an average of 0.1-0.2% on each additional sensor per node. The increase might not be a significant one however it is not the main target out of the space multiplex. While the Single-node type hasn’t been impacted by the throughput.
Figure 8.a shows the relationship between the PDR and the low number of nodes in the Single-node type. The PDR decreases significantly with the increasing number of heavy traffic nodes. The PDR reduces from 99% in 1-node to 75% in 5-node whereas the nodes send high traffic packets rates with an average of 13.8 packets/sec.
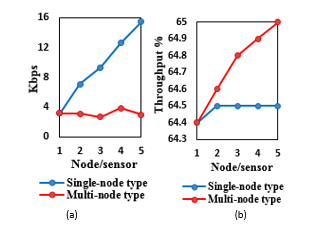 Figure 7: Space attribute (a) Average data rate, (b) Throughput
As shown in Figure 8.b, the number of packets sent by the node(s) increases with the increasing number of nodes in the Single-node type. On the other hand, the number of transmitted packets may decrease or remain constant in the Multi-node type.
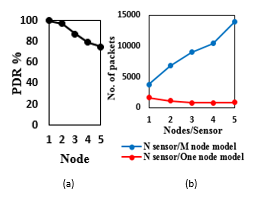 Figure 8: Network congestion in the Space domain attribute (a) PDR, (b) Number of sent packets
Figure 9 shows the relationship between the control overheads on one side and the number of aggregated nodes/sensors on the other side. It is noted that the data overheads begin to significantly increase from one source node to five sources in the Single-node type. On contrary, the control overheads seem to be constant with an increasing number of sensors attached to one-node in the Multi-node type.
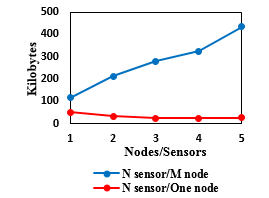 Figure 9: Control overheads in the space domain attribute
On the other hand, the time domain experimental results tested 16 levels of grooming index (i.e. multiplex of 16 channel of data streams on the same channel). The experiment shows a relationship between the grooming index G on one side, and the traffic profile on the other side from five experimental key observations: traffic volume, collision probability, throughput, network congestion, and BW overheads.
It is observed that the traffic volume (packets data values or average data values) increase as the grooming index increase as shown in Table 4. Figures 10 shows that the grooming time between the two generated packets and sent by a node is highly impacted by the grooming factor G in a directly proportional relationship. Equation 8 describes the grooming traffic profile of Figure 10. The traffic volume is impacted by the data aggregation of one/multiple source nodes for G grooming times. The average data rate is reduced from 0.175 Kbps at G=2 to 0.164Kpbs at G=8. Similarly, the packet data size data rate is reduced from 168.8 Kbits at G=2 to 164.5 Kbits at G=8.
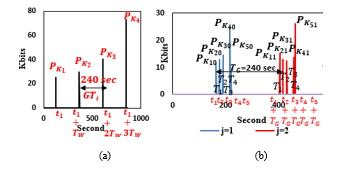 Figure 10: Time-domain attribute for 4-level grooming index
(a) One fire node experiment, (b) Five fire node experiment
The collision probability in the grooming attribute results is affected by two main enablers: the number of nodes and grooming guard periods as depicted in (6). As shown in Figure 11.a, the collision probability increase as the grooming index increase, whereas the graph shows an exponential growth of collision probability versus the number of nodes for the first 400 nodes for grooming index G=2, while the same growth to lower values of collision probability from grooming index G=8 which in turn explains the high impact of grooming index of collision probability especially for a big volume of nodes that characterize IoT and WSN technologies.
The graph in Figure 11.b shows that the grooming index G has a considerable impact on throughput as it increases the throughput value from 72.8% at G=1 to 91.2% at G= 8 which indicates the 18.4 % gain in throughput value followed by a small growth rate at G>10. It is obvious that the throughput increase from 91.2 % to 92.6% as G increases from G=8 to G=16. It is noted that an effective impact of the throughput is for G less than or equal to 8.
For 5-fire source nodes in Figure 12.a, it is obvious that the PDR increases with a high G grooming index whereas, PDR is 43% at G=1 until reaches 74% at G=8. As shown in figure 12.b, it is noticed that the number of sent packets decreases for long grooming times.
Consequentially, it is obvious that BW overheads (Kilobytes) exponentially decrease with the increasing number of G grooming index as seen in Figure 13.
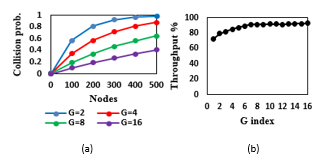 Figure 11: Time-domain attribute (a) Collision probability, (b) Throughput
![]()
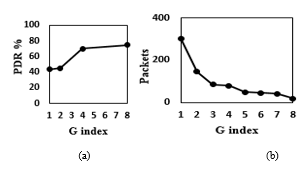 Figure 12: Time-domain attribute (a) PDR, (b) Network congestion
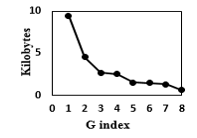 Figure 13: Control overheads in the time domain attribute
Table 4: Time-domain attribute results
| Grooming index G | Packets data values (Kbits) | Average data rate | |||
| 4 (240 sec) | 25.45 | 29.52 | 40.64 | 72.75 | 0.175 Kbps |
| 8 (480 sec) | 85.0 | 79.3 | — | — | 0.164 Kbps |
6. Discussion
Table 5 discusses the impact degree or an improvement gain of the two traffic aggregation techniques on the IoT network efficiency, compared to the classical smart city network before aggregation as:
6.1. Space domain attribute
In contrast to the existing aggregation techniques [3-9], it is noted that the traffic profile is shaped severely by applying the N sensor /M node model as shown in Figure 6 as a result of the new architecture which in turn has a direct impact on the IoT network key performance indicators:
In the traffic volume, minimizing the number of processing to one is verified through the constant average data rate. It can maintain the average data rate by about 4Kbps with an increasing number of sensors in the Multi-node type as in Figure 7.a. While the average data rate is significantly increased by about 4 16 Kbps with an increasing number of nodes in the single nod type. Thus, the traffic data volume of the multi-node type is lower than that in the single-node type.
As listed in table 5, the traffic data volume (average data rate, data size) of the fie-node, resulting from the space domain
attribute is higher than that in the classical smart city scenarios (scenario 3 and cloud) before the aggregation process. The average data rate increases from 2.01Kbps and 1.6 Kbps in the classical
smart city scenarios (scenario-3 and cloud) to 3.2 ~2.9 Kbps and 3.2 ~15.4 Kbps in the multi-node type and single-node type, respectively. In the same manner, the amount of data size increases from 1934 Kbits and 214 Kbits in the classical smart city scenarios into 2285.5~2126.8 Kbits and 2285.5~11125.2 Kbits in the multi-node type and single-node type, respectively.
|
Table 5: The improvement gain of the proposed techniques, compared to the classical system
|
||||||||||||||||||||||||||||||||||||||||||||||||||||||||||
In the throughput, the impact of node aggregation architecture on network performance becomes very clear in Figure 7.b that shows a significant impact on throughput as a result of aggregating several sensors on the same node. The result is attributed to the network metadata added to the traffic header on each transmission. In the same case of n-sensors on the same node, the broker shall use the header once. As a result, the throughput gain per sensor is about 0.2% for 5 sensor case that is scaled up to a total 20% throughput improvement for a 100 sensor real case aggregated on one broker. Thus, throughput in the multi-node type is higher than that in the classical smart city scenarios by about 20% improvement gain for large scale networks (100-IoT nodes) as depicted in table 5. However, the single-node type is approximately the same as in the classical smart city scenario nodes.
High throughput and constant average data rate in the Multi-node type reduces network traffic congestion. On contrary, the low network congestion in the Single-node type is caused due to the low throughput and PDR values as in Figures (7.b, 8.a).
From the number of sent packets perspectives, the Multi-node type maintains the minimum number of packets by about 800 ~1600 packets for a low incremented number of sensors rather than the single-node type that has a significantly increasing number of sent packets for 5-source nodes by about 3700~13900. The number of sent packets is reduced from 2720 packets in the classical smart city network (scenario3) to 800~1600 packets in the multi-node type with an improvement gain of about 22% as depicted in table 5. Otherwise, both single-node type and multi-node type in the space domain attribute do not affect the number of sent packets in the classical cloud scenario.
From the overheads perspectives, it is remarked that overheads in the Multi-node type are lower than that in the Single node type as depicted in Figure 9 and Table 5. The control overheads in the proposed Multi-node type is reduced from 50 Kbytes in one-sensor to 27 Kbytes in five-sensors. The overheads in the multi-node type are less than that in both scenario 3 and the cloud scenario of the classical smart city networks with an improvement gain of 300% and 30% compared to scenario 3 and the cloud scenario.
6.2. Time-domain attribute
Rather than the previous time aggregation techniques [11-13], the traffic profile shaping concept is verified and proved in the time domain aggregation as shown in Figure 10. As the G number of grooming times increased, the collected data information to be sent will increase, and vice versa. the traffic profile of one/multiple nodes is shaped into a delta function. Its mathematical formula in (8) meets a theoretical time-domain concept in (3).
While the previous time aggregation techniques reduce an error and the latency [11-13], the main findings in this article are to improve the IoT network performance as follows:
The time-domain attribute reduces the traffic data volume whether the average data rate and data size from G=2 to G=8. The traffic volume in the time-domain attribute is less than or equal to that in the classical smart city scenarios. The time-domain attribute reduces the average data rate from 2.01Kpbs in the classical smart city scenarios (scenario 3) to 0.175~0.164Kbps. Similarly, it reduces the amount of data size from the 1934 Kbits and the 214Kbits in the classical smart city (scenario 3 and cloud scenario) to 168.8~164.5 Kbits. While the average data rate of the time-domain attribute (1.6Kbps) is moderated with that in the cloud scenario of the classical smart city.
The collision probability is reduced from 95% at G=2 to 50 % at G=8 for a dense number of nodes (400 nodes) in the non-real-time IoT applications. For the large scale networks with 400-nodes, the collision probability is mitigated by about 95~50 % with at least 45% improvement gain, compared to that in both classical smart city scenarios before aggregation (up to 99%). Thus, the proposed time-domain technique enables the dense number of nodes in IoT smart city networks to avoid the collision.
The percentage of the throughput in the time aggregation is raised by about 20% gain whereas this approach develops high throughput, gained from 72.8% at G=1 to 93% at G=10 as in Figure 11.a. It is noted that the throughput of 72.8~93% in the time-domain attribute outperforms the throughput of 62.65% and 64.37% in the classical smart city scenarios with an improvement gain of about 30%.
The number of transmitted packets in the time aggregation is reduced from 300 packets at G=1 to 20 packets at G=8. Also, throughput in Figure 10.b and PDR in figure 12.a are improved to avoid network traffic congestion in this technique. It is remarked that the number of sent packets is minimized from 2720 packets and 303 packets in both classical smart city scenarios (scenario3 and cloud) to about 303~20 packets based on G grooming times. The overheads are mitigated by a minimization factor of 9 at G =2 and 15 at G=8, compared to the overheads in scenario-3 and the cloud scenario.
The excess overheads are reduced from 9.5KB at G=1 until 0.59 KB at G=8 as shown in figure 13. The overheads are minimized from 85Kbytes and 9.3Kbytes in scenario 3 and the cloud scenarios of the classical IoT smart city to about 9.5~0.59Kbytes in the time domain attribute with an improvement gain that exceeds up to 150% at G=8 than overheads in scenario 3 and a minimization factor of about 90 at G=2 in the cloud scenario.
7. Future work
Our practical experiments (testbed lab) are established from 5-fire sensors, one-smoke-node, and 6-ESP 8266 MCU units as a case study in the IoT smart city networks to prove the concept. Our experimental setup could be extended to be applied for large-scale smart city networks and other IoT use cases in the future.
8. Conclusion
The two traffic aggregation techniques (space domain and time domain) have been proposed in this article to address the challenges of IoT traffic characteristics in the smart city networks as dense number of nodes, the massive number of transmissions, Data volume (light or heavy), and the payload size. Compared to the classical smart city networks, the methodology design of the proposed work highlights shaping the individual traffic profiles in the classical smart city into the traffic aggregation of N source sensors/nodes via the space domain attribute and the traffic aggregation for G grooming times (delay) via the time-domain attribute for IoT traffic data control, thus optimizing the IoT network performance in the smart city use case from the five main perspectives (traffic volume, throughput, collision probability, network congestion, and the control overheads). The practical experimental lab model is built as one of several smart city networks (scenarios) before and after the proposed aggregation techniques to prove the concept. It is verified that the two proposed aggregation techniques have a better improvement gain than the existing smart city networks (without aggregation).
Last but not least, the practical study works focus on the smart city models, but the results could be extended to other non-real-time IoT use cases as smart metering, telemetry, and surveillance.
Conflict of Interest
The authors declare no conflict of interest.