A Proposed Framework to Improve Containerization from Asia to North America
 , José Luis Martínez-Flores, Patricia Cano-Olivos
Adv. Sci. Technol. Eng. Syst. J. 6(1), 479–486 (2021);
 DOI: 10.25046/aj060152
The constant market change and the critical role of the logistics process in the supply chain need to have special attention because it is an essential piece for the global business strategy. This paper presents an assessment of the processes of handling material from Asia suppliers to North America. The data utilized for the analysis is of 12 months of 2019, valuable input to support the proposal to the company to approve the changes to get a financial gain. The proposal aims to create a complete analysis starting on how the containers are loaded currently in Asia (floor loaded) and the complexity that this strategy creates for the whole supply chain. The analysis of the overall process aims how the proposed change (pallet loaded) will reduce demurrage cost annually (USD 147,000), lead time (from 6 days to 3 days), space utilization in the facility (reduce space by 6364 sqrt/ft), reduce operational cost annually (USD 210,000), improve safety (Risk factor savings annually of USD 61,100), and on-time delivery to the customer (Increase 4% ).
1.Introduction
In the current global supply chain footprint, one of the most critical parts is the transportation of goods from any place in the world to fulfill customer requirements. Companies are significant in maintaining competitive advantage from the competition, and the company needs to be prepared with flexibility and responsiveness to the dynamics of the customer demands [1].
Container loading is a pivotal function for operating supply chains efficiently, and underperformance results in unnecessary costs (e.g., cost of additional containers to be shipped) and in unsatisfactory customer service (e.g., violation of deadlines agreed to or set by clients). Thus, it is not surprising that container loading problems have been dealt with frequently in the operations research literature. It has been claimed, though, that the proposed approaches are of limited practical value since they do not pay enough attention to constraints encountered in practice [2].
Organizations must be capable of fast, radical changes, and those that aspire to be best must lead to changes [3]. Container shipping has changed the scale and scope of global freight distribution. By enabling a higher rate in freight distribution, it has opened up new global markets for export and import as a higher quantity of space could be traded with a similar, if not lower, amount of time and often at a lower cost. This rate is much more a function of time than of speed as containerization mostly improved the function of transshipment [4].
The current customer changing needs force the supply chains to look for continuous improvement on the value-added on the different processes and create dynamic changes on how the goods are move through the chain [5].
The scope of the research is to determine the best containerization in Asia. Changing the way of containerization to create a faster supply chain reducing the safety stock needed for the waiting time in the ports to fill a floor loaded container and the overall improvement on reducing the extra cost that hits directly on the operating income of the company [6].
Part of the assessment comprised the current state of process from the point of origin Asia to the point of receipt in North America (Mexico), in that review the specific process that takes place in that part of the chain and creates a proposal for improvement that can be measured.
For the company case of study, the fast pace of customer demand is one of the essential value-added that is offered to the customer. For this reason, the supply chain needs to be fast, flexible, and dynamic to support what is being offered.
The company is focused on the wellbeing of the associates. The current container unloads process of a floor loaded container is very demanding and with a high risk of injury due to unloading by hand over 3000 to 4000 containers daily, that in the long run, can harm the associate’s health, that in the final result of the project will be to eliminate this risk of injury, the impact of this is of USD 61,100 of saving on the risk factor.
2. Literature Review
The container system is slowly reaching maturity in a market environment where freight transportation has become the most volatile and costly component of many firms’ supply chain and logistics operations. Managers must deal with delays in the transport system, with rising oil prices, complex security issues, and with labor and equipment shortages and trade imbalances. Each of these problems adds risk to the supply chain, and the problems are likely to get worse before they improve. Managers in the logistics industry, including the port and maritime industry, are spending more and more of their time handling freight transport missteps and crises. As such, reliability and capacity issues have emerged as critical factors next to pure cost considerations [1].
Empty container repositioning has been an on-going issue since the beginning of containerization. However, it has become more prominent in recent decades due to the rapid growth of the container shipping business and the regional difference in economic development. The critical factors that cause empty container movements, which include the trade imbalance, dynamic operations, uncertainties, size and type of equipment, lack of visibility and collaboration within the transport chain, and transport companies’ operational and strategic practices [6].
Over the past decade, there has been a growing consensus concerning the strategic importance of integrating suppliers, manufacturers, and customers convincingly argued, the once narrow subject of logistics has become a broad topic that now spans the entire value system from suppliers to customers [5].
The first in the line of warehouse processes is the receiving of goods. This process does not take as much time as picking, which is shown onwards, but it is as relevant as any. Especially if incorrect put-away occurs and causes errors in further processing. The process of receiving can begin with the notice of the arrival of the goods. It permits the warehouse to prepare to schedule inbound operations, so there are no uncoordinated events. With the arrival, unloading begins after which units are put away with accurate documenting before [7].
Container loading problems can be interpreted as geometric assignment problems, in which small three-dimensional items (called cargo) have to be assigned (packed into) to three-dimensional; rectangular (cubic) large objects (called containers) such that a given objective function is optimized and two underlying geometric feasibility conditions hold, i.e. [2]:
- All small items lie entirely within the container
- The small items do not overlap.
A formal description of a solution to an assignment problem of this kind will be called a loading pattern.
According to the typology introduced in [8], one can distinguish between container loading problems, in which enough containers are available to accommodate all small items, and such problems, in which only a subset of the small items can be packed since the availability of the containers is limited. Problems of the first kind are of the input (value) minimization type, those of the second type represent the output (value) maximization type.
Moreover, the changes in operations and processes of warehouses should cover every activity in warehousing [9] such as:
- Receiving: the process of unloading the incoming truck, identifying, registering, and sometimes repacking.
- Put away: moving the goods from the unloading dock to the storage area.
- Storage – in bulk or pick activities at the warehouse, affect goods in storage. For instance, the number of stocks must be counted to verify inventory quantities.
- Replenish If inventory levels of the pick storage drop to specific amounts, it is replenished with stocks from the bulk storage.
Leaning on a material-handling environment encompasses two main elements; value stream mapping to define the optimal future situation and analysis of the logistics flows used to move products in order to optimize the facility layout. Both practices aim to improve the operation continuously. Traditional warehouses should become cross-dock operations. Lean cross-docking operations should integrate principles as heijunka planning, advanced routing methods, and kanban. These principles would create flow in picking, packing, and replenishing while simultaneously reducing average order cycle time in [10].
Consider shipping priority in container loading, where high priority boxes must be loaded before those with low priority. They propose a multi-round partial beam search method that explicitly considers shipping priority when evaluating the potential of partial solutions to solve this problem. Since existing benchmark data for shipping priority covers only weakly different instances, they extend the benchmark data to strongly heterogeneous instances [11].
In accordance [12], the overall duration of the transport process, as well as the balance of the elements, differ depending on different factors, such as:
- Average distance cargo transport
- Localization of distribution points and cargo transportation conditions
- The capacity of the vehicle
- Technical speed of vehicle movement
- Technical vulnerabilities of cargo transport
- The level of mechanization degree of loading mechanisms construction
- Construction of highways surface and other
3. Research methodology
The research methodology for the study is described in Figure 1. The overall process of the research is to understand what is the problem that we have encountered; moreover, after that, it is the process that needs to be worked on to create a solution that is in line with the expectations of the company in the study.
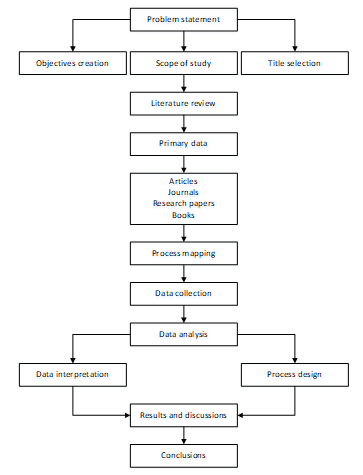 Figure 1: Research method for the study.
4. Case study
4.1. Problem statement
The company in the study is the leader on security products, with a distribution of goods to all the world, the manufacturing plant is in Mexico for finish good and most of the main components are made in the United States of America. The supply strategy for the make to stock business is 60% of the goods purchased to Asia suppliers, and the 40% is assembled in Mexico; on the make to order business, 100% of the products are made in Mexico with most of the components from U.S. suppliers, Mexico suppliers and very small from Asia suppliers.
By doing this study, the company is looking for the overall improvement on the lead time, create a lean supply chain from Asia to Mexico. Reducing the need for safety stock inventory that is not needed and the overall reduction of cost the effect the operating income, and by making this improvement, the company will improve on the customer service level and that, in the long run, will bring incremental sales and revenue Figure 2.
The overall market dynamics are forcing supply chains to change the current footprint dynamics to accommodate every changing customer requirement better. Regarding the current stage, much investment is put into creating a better logistic network to support this. Moreover, the company found an opportunity to create a proposal by changing the way the containers are loaded in Asia.
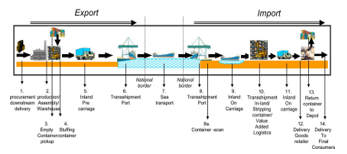 Figure 2: Overall ocean container flow.
In the current supply chain footprint of our Asia supplier, the company has a total of 38 suppliers that are located in mainland China, and seven are in other Asian countries (i.e., India, Vietnam, Philippines). Focusing on mainland China suppliers.
The scope of the project is to focus on the containers that are built-in mainland China that is close to the company suppliers in which the supplier ship to a consolidator in which they put cargo from different suppliers that are shipping to the same end-user. The ports utilized to ship material to the United States of America are:
- Yantian
- Hong Kong
- Shanghai
- Ningbo
- Keelung is out of Taiwan
- Shenzhen
After containers are built in China, they are moved to the freight forwarder cargo lines that will load the container to the boat to ship it out to Long Beach port to be unloaded.
The results of the demurrage cost USD 200.00 per day per container which is a delay that has been affecting the company due to the high cost per day because of not returning a container in the appropriate lead time.
The statistical data that was analyzed is from all the containers that arrived to the U.S., from Asia in 2019. Because of the COVID-19 pandemic, the data from 2020 is very different due to Asia suppliers delaying container flow. The company decided to use the 2019 data to obtain where the company was situated in the current state. Moreover, the lateness that the company has based and how long is it taking to unload the containers in the warehouse.
The total amount of containers that arrived in 2019 to the plan was 480 containers, from those, 344 are 40’ size (equal to 72%) and 136 are 20’ size (equal to 28%). From this data, the company needed to understand if there was a correlation between total boxes in the container and the pallets built per container. In Figure 3, a scatterplot of boxes quantity vs. pallet built for 40’ container is presented and in Figure 4 is shown a scatterplot of box qty vs. pallet built for 20’ container.
 Figure 3: Scatterplot boxes qty vs. pallet built for 40’ container.
 Figure 4: Scatterplot boxes qty vs. pallet built for 20’ container.
As a result of the 40’container, the high-density population is between 45 to 55 pallets built per container. Furthermore, the 20’ containers’ population is between 40 to 50 pallets built. The plan is to eliminate the use of 20’ containers and only use 40’ ones to maximize utilization of the capacity of the container that is 5 to 15 more pallets than the 20’ container. It is a quick example of how a floor loaded container arrives at the facility, see Figure 5. The correlation found in the analysis was that the company could eliminate the need for shipping in the 20’ container, if the process is implemented of pallet loaded and changing to use only 40’ containers due to the number of pallets that can be loaded.
 Figure 5: Floor loaded container.
These are the results analyzing the data in Table 1.
Table 1: Container boxes and pallet building.
| Container Length | The total quantity of boxes | Total Quantity of Pallet Built |
| 20′ | 505,500 | 6,495 |
| 40′ | 1,364,734 | 17,214 |
| Grand Total | 1,870,234 | 23,709 |
Reviewing the results, they show the complexity of how the company has delays in unloading containers. The complexity of the process is that it is manual labor to unload the boxes from the container and then create pallets that will be received and then put-away in the warehouse. The manual process of unloading the containers has created an extra lead time of 3.06 days in the high season, and that is the issue of why the company has a high demurrage cost, affecting 240 containers every year, with those delays the company incurred in demurrage cost that affects the financial performance of the company due to an operational issue on how the container is loaded, how the container is unloaded and the receiving process of the goods.
4.2. Analyzing and creating the business model
For any continuous improvement project, it needs to define the current process map, to understand what are the areas of opportunity that are needed to focus on. This project is the actual process flow which has been focused on the receiving and put away part of the process, see Figure 6. the process map gave the company an overall perspective to analyze where it can focus resources to create a valuable proposition.
Following the current process flow, when the containers arrive from Asia, first the container arrive at Long Beach, after that it has to wait for its turn to be downloaded from the boat with a crane and be put into the inbound area, in that the transporter goes and picks up the container to bring it to the company yard, there it waits its turn to be crossed to Mexico to start the unloading process.
 Figure 6: Receiving and put-away process flow.
 Figure 7: Histogram of box quantity.
In this part of the process is where we found the first issue. The complexity of how the containers are loaded in Asia (floor loaded) and the average amount of boxes per container affects the overall lead time to unload, delaying the unloading so the company occurs into demurrage.
On a yearly average, the company had 240 containers on which there was a delay of 1 day, and more to return the container to the supplier yard. This delay in the process has generated a loss of USD 147,200. By changing the process this cost can be eliminated.
In the data analysis, the average and the standard deviation per container on how many boxes and the pallet are represented in Figure 7 and Figure 8. The results obtained are that the average quantity of boxes in the container and the average pallet built from those boxes is equal to the number of complete pallets that fit inside a container, creating an opportunity in the process to change the current process of floor loaded to pallet loaded.
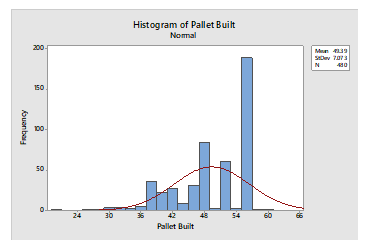 Figure 8: Histogram of pallet built.
The complexity of the process is outlined with the data of one year. On a yearly average per container, the company receives 3896 boxes per container and those equal to an average of 50 pallets per container. The study shifted to understand the lead time that is taking to unload the containers from Asia, the lead time that the company has is three days to receive the container, unload, and return the container to the supplier yard, see Figure 9. In this histogram, the company is measuring the total lead time for a container to be unloaded.
 Figure 9: Histogram of days to unload the container.
There is an average of 4.2 days (this is taking the 480 containers, from which 240 were unloaded at or before the lead time of 3 days) to unload the container with a standard deviation of 2.49 days. The lead time that the company has is three days to return the container; this result creates an extra cost in the organization that is a demurrage cost in which for any extra day it takes for the company to ship the container back to the logistic cargo supplier, the cost is USD 200 per day for delay. The company needed to understand the lateness of the containers. Figure 10.
 Figure 10: Histogram of days above the goal of container unload.
The result that was obtained (only 240 containers that were shipped out late back to the supplier yard) is that the days above the lead time on average is 3.06 days with a standard deviation of 2.28; with this, the company calculated an impact on the cost of USD 147,200 that affects the operating income, see in Table 2 cost due to demurrage.
Table 2: Cost due to demurrage.
| Container Length | Cost due to demurrage |
| 20′ | USD 45,600 |
| 40′ | USD 101,600 |
| Grand Total | USD 147,200 |
Base on the case study it’s been determine that the company needs to work on improving the container loading in Asia. On the current process, the supplier can ship future P.O.s of material that are not needed yet, to fill up a container at the max on boxes and weight. This issue creates extra inventory that the company does not need; by changing the strategy, the company will eliminate the extra carryover inventory that is not needed and improving cash flow by not having inventory that is not needed due to an operation process. It will be reviewed to cut the need for those extra containers by reducing the safety stock level from 120 days of finish adequate supply to 90 days of safety stock. It will help to reduce the necessary containers between 60 to 90 that have an extra carryover of 30 extra days of safety stock. The significant impact is not having the correct inventory in the correct place to support customer demand, and the impact associated with that is customer fines because of out of stock that creates filling rate issues on the stores, on-time delivery because of shipping late, waiting for inventory to arrive and loss of sales due to cancelations.
Connecting this to the other warehouse process, in the unloading process, the company has two crews for the receiving process, each crew is of 7 associates, for a total of 14 associates, and one forklift driver that is the one that when the pallet is complete, he moves the material to a staging area for the quality team to audit each of the pallets that were made.
If the company improves the process of how the containers are loaded in Asia, there will be an immediate impact on the labor needed to unload a container, changing the how the container has been loaded in Asia from floor loaded to pallet loaded, improves the velocity in the process by eliminating the manual unloading box by box and improves the safety of the workforce by eliminating the manual labor of moving and unloading boxes.
The current labor of one crew to unload one container of 40’ is between 3 to 4 hours depending on the number of boxes, the mix of SKU in the container, and the weight of each of the boxes. Each container has a different complexity inside of it. If the container is changed to a palletized container, one forklift driver can unload one container between 30 minutes to 60 minutes; in one day, one forklift driver can unload, taking the max time nine containers in one shift.
The cost of one receiving associate full loaded (salary + benefits) is around USD 15,000 per year; with this proposal, the reduction is for a total of 14 employs two unloading crews, each receiving associate earns USD 15,000 per year, with the reduction of the 14 associate the company can save on their operating cost USD 210,000 per year when the proposed improvement is implemented.
Continue connecting the dots of the analysis, and the company encounters another area of opportunity, floor space utilization for staging the building of the pallets. Moreover, in any industry, floor space is precious because staging and storing do not add value to the product, it adds cost. If there is an opportunity to save space, the company can save money and use that space for something that can add value to a product, for example, more production lines.
The total area that can be reutilized by adding more cells in an area of 86’x74’ for a total of 6364 sqrt/ft equals 10.5% of total production space, of the estimated cost of sqrt/ft, taking all of the cost into consideration for a productive area is around $48 x sqrt/ft; this gives a saving or possible revenue of USD 305,472 that can be added for the justification of the project, see Figure 11.
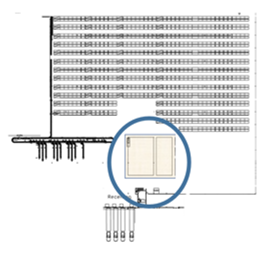 Figure 11: Finish good facility warehouse layout
5. Results and discussions
The purpose of this paper is to develop a proposal assessing the effectiveness of a change in the container operations loading process in Asia. As a result, the best solution found is to propose a change in the way the containers are loaded.
The improvement is changing from floor loaded container to pallet loaded container. The company has defined the pallet structure from Asia to maximize the pallets that can be loaded in the container. The proposal is to utilize only 40’ containers and eliminate the use of 20’ containers.
The interior dimensions of a container (in feet): 39′ 6” long x 7′ 9” wide x 7′ 10” high, that is equal to 4,143,708 cubic/inches; with data, it can be calculated how many standard pallets the consolidator can load into the container, the standard size including the pallet will be 40”x48”x48, that will help the company load two lines of pallets double stack to have 40 pallets per container. To implement this, the engineering and the sourcing team will have to work with Asia for the supplier to have the pallet pattern and follow the new direction; that with this, the company will not have to invest in more containers need base on the reduction due to safety stock not needed.
With this proposal, there is a potential saving in demurrage, labor, and space utilization. Another savings is the reduction of the risk factor on the unloading of the operation, due because it is a manual operation that can cause injury on the receiving operator, and because the human capital is the most crucial asset in the company, by eliminating the need of the manual force the company eliminates the risk of injury, the projected reduction of the risk factor is from 0.020597 to 0.020097 that generates to a yearly reduction on this factor of USD 61,100.
For this proposal to be implemented, it needs to have a united effort between several departments and key players to get the savings that have been identified.
For example, the packaging engineer needs to start working on standardizing the pallets and specific sizes to maximize the opportunity to double stack the container. After this activity is completed, the sourcing team will need to contact the supplier in Asia to give them the new packaging specifications, from which the supplier will need to start palletizing when they receive the new specifications. After that, the company will have a specific time frame in which it will continue to receive floor loaded containers, but when that ends, the process of unloading by pallet and auditing from quality and receive will have to change to create a more dynamic flow.
The total recurrent annual savings estimated in this project, not considering the potential inventory reduction is, with near to no investment is:
- Demurrage saving USD147,200
- Labor reduction of USD 210,000
- Space cost USD 305,472
- Risk factor reduction of USD 61,100
- Total savings USD 723,772
6. Conclusions
The case study helps the organization to identify current opportunities in the containerization process in Asia.
With the current change in the market dynamics, the company encounters an opportunity to reduce lead times. The market dynamic, based on customer needs in a faster pace to respond to demand. The pandemic of COVID-19 affected supply chains first, starting with Asia. Asia stop shipments for six weeks if it is considered that in 6 weeks there is not going to be any flow, that in a macro stage equals to 12 weeks without raw material or finish good; this pandemic created needs to improve and reduce time in the supply chain.
By focusing on creating a faster approach in the unloading of the container, there are several savings for the company. Reducing the labor or relocating labor in the area by 14 employees creates a reduction in the operating income of the company.
By changing one process, it impacts several other, for example, releasing pre-stage areas to create space for new manufacturing cells, which is a direct impact on having space utilized on value-added activities instead of staging inventory.
Overall, the proposal for the project is to change the way we have been doing the operation, by changing the process we can improve the overall efficiency of the operation.
In this time of new challenges, the companies need to think differently and have an open mind in creating a culture of change to create continuous improvement.
In this project, the approach is to work the different process that conforms the supply chain. The company is improving the warehouse activities from unloading containers, receiving material goods, and put away process by having a straighter forward operation. On the transportation side, it is improving the reduction in lead time to eliminating demurrage and having a faster return of empty containers to the supplier. In supply planning, the team needs to work with the system to have the correct supply strategy based on a dynamic and faster container supply chain, by having what we needed when we needed and overall, the company will have an improvement because it will save cost on the operating income and the customer service side, the performance on the service to the customer will improve by not delaying material to ship and to arrive at the company.
Conflict of Interest
The authors declare no conflict of interest.
Acknowledgment
I am pleased to thank my teachers for giving us the push to think differently and to create new dynamics in our workplaces.
- J.P.Rodrigue, T.E.Jean-Paul, “Containerization, Box Logistics, and Global Supply Chains.” The Integration of Ports and Liner Shipping Networks. In: Haralambides H.E. (eds) Port Management. Palgrave Readers in Economics. Palgrave Macmillan, London. 5-28, 2013, https://doi.org/10.1057/97811374757702.
- A. Bortfeldt, G. Wäscher, Gerhard, “Container Loading Problems – A State-of-the-Art Review.” FEMM Working Papers 120007, Otto-von-Guericke University Magdeburg, Faculty of Economics and Management, 7, 1-45, 2012.
- A. Yong, H. Nee, “Warehouse System and Business Performance: Case Study of a Regional Distribution Centre.” Conference: International Conference on Computing and Informatics (ICOCI 2009), 24-25 June 2009, Legend Hotel, Kuala Lumpur.
- J.P. Rodrigue, “Globalization and the Management synchronization of transport terminals.” Journal of Transport Geography 7, 255–261, 1999.
- S. Zailani, P. Rajagopal, “Supply chain integration and performance: U.S. versus East Asian companies.” Supply Chain Management: An International Journal. 10, 379-393, 2005, DOI: 10.1108/13598540510624205.
- D.P. Song, J. Carter, “Empty container repositioning in the shipping industry.” Maritime Policy & Management, 36(4), 291-307, 2009.
- J. Habazin, A. Glasnović, I. Bajor, “Order Picking Process in Warehouse: Case Study of Dairy Industry in Croatia.” Promet – Traffic & Transportation, 29, 57-65, 2016.
- G. Wäscher, H. Haußner, H. Schumann, “An improved typology of cutting and packing problems.” European journal of operational research, 183(3), 1109-1130, 2007.
- A. Kamali, “Smart Warehouse vs. Traditional Warehouse – Review.” CiiT International Journal of Automation and Autonomous System, 11, 9-16, 2018.
- A.B. Arabani, S.F. Ghomi, M. Zandieh, “A multi-criteria cross-docking scheduling with just-in-time approach.” The International Journal of Advanced Manufacturing Technology, 49(5-8), 741-756, 2010.
- N. Wang, A. Lim, W. Zhu, “A multi-round partial beam search approach for the single container loading problem with shipment priority.” International Journal of Production Economics, 145, 531-540, 2013.
- R. Burdzik, M. Cieśla, A. Sładkowski, “Cargo Loading and Unloading Efficiency Analysis in Multimodal Transport.” Promet – Traffic & Transportation. 26(4):323-31, 2014. DOI: 10.7307/ptt.v26i4.1356.