Optimizing the Wind Farm Layout for Minimizing the Wake Losses
Volume 6, Issue 1, Page No 309-315, 2021
Author’s Name: Abdelouahad Bellata), Khalifa Mansouri, Abdelhadi Raihani, Khalili Tajeddine
View Affiliations
SSDIA Laboratory, Hassan II University of Casablanca, ENSET of Mohammedia, 28830, Morocco
a)Author to whom correspondence should be addressed. E-mail: bellatabdelouahad@gmail.com
Adv. Sci. Technol. Eng. Syst. J. 6(1), 309-315 (2021); ![]() DOI: 10.25046/aj060135
DOI: 10.25046/aj060135
Keywords: Wind Farms, Wake Effects, Mechanical Fatigue, Wake Loss, Wake Concentration, Optimized Layout, Genetic Algorithm

Export Citations
The development of wind farms requires an optimal design of wind turbines layout. The main goal of this optimization is to minimize the wake effect through the optimal placement of the wind turbines. The current study aims to standardize the wake losses among all wind turbines in the wind farm and bringing their losses to a similar level. An objective function was developed for this purpose, and used by the genetic algorithm to maximize the farm energy output and prevent the wake concentration on specific wind turbines. The proposed method has been applied to the Gasiri Wind farm through a simulation approach. The applied optimization process has shown very promising results characterized by a 17% possible energy gain after the adoption of the optimized layout. The study has also shown that the new positions of wind turbines characterized by a high rated power, are more on a forward position following the wind direction compared to the original ones. The study has also shown that there is a significant reduction of mechanical fatigue on the wind turbines blades.
Received: 19 November 2020, Accepted: 06 January 2021, Published Online: 22 January 2021
1.Introduction
Increasingly growing efforts have been deployed in recent years to increase the share of clean energy production worldwide. This unprecedented interest in sustainable energy production derives from a serious ambition to prevent environment degradation and provide the much-needed equilibrium with the depletion of traditional energy resources. serious ambition to prevent environmental degradation and provide the necessary balance with the depletion of traditional energy resources. Wind power in particular is today considered one of the green sources in development in the world today. Governments across the globe are according more and more interest to the wind energy, exploiting recent industrial advances. The statistics given by the Wind Power Association clearly show that [1], wind farms represent 63% of European investments in renewable energies in recent years. These investments represent large-scale wind power harnessing farms requiring large sites and hundreds of wind turbines. Therefore, the optimization of wind farms is key component for an efficient exploitation of wind energy.
The objective of the proposed optimization in this paper is the maximization of energy and the reduction of energy losses. In order to achieve this goal, we propose to reduce the wake effects since they significantly contribute to the recorded energy losses [2]. In fact, when crossing the rotors blades of a wind turbine, a certain amount of energy is lost, wind speed decreases behind the turbines, this phenomenon reduces the yields of downstream wind turbines [3]. Indeed, the quality of the energy production produced by the wind farm is generally affected by several factors which contribute to significant energy losses [4]. Efficient wind farms design and development remains the best strategy to minimize these energy losses [5]. The main objective of our work is to establish an algorithm capable of reducing and standardizing the wake effect through all the turbines of the studied wind farm. Numerous articles have addressed this optimization problem using different types of algorithms such as genetic algorithms [6], [7], evolutionary algorithms [8], and the particle swarm optimization algorithm [9].
Generally, the computational domains for modeling wind farms are classified into two main categories, discrete representations using a grid which contains the coordinates and continuous representations with degrees of freedom greater than the discrete representation[10]. The continuous representation is highly beneficial because the wind turbines can be installed freely on the wind farm according to the 2D coordinates [11], [12]. In this case study, the genetic algorithm was chosen because of the binary coding method used.
Many research works have studied the optimized layout of wind farms using genetic algorithms, such as the work carried out in [13], [14]. However, most of these studies use the energy or cost as optimization objective. In some cases, we combine the two optimization criteria cost and energy, other studies developed by the authors in [15] have also made an optimization of the layout taking into account the effects of the consolidation of nearby offshore wind farms, which have been very developed recently. In [16], authors propose an optimization layout aiming to reduce the cost of arranging substations and cables in the offshore wind farm by exploiting an objective function that uses the level production cost. In [17], authors are used a multi-objective optimization of the layout in order to satisfy several design objectives.
The main interest of a wind farm optimization is the maximization of the energy. However, in the case of a small size land, some wind turbines can be significantly affected by the wake effect compared to other wind turbines, resulting in increased turbulence, and consequently fatigue of the wind turbine blades and reduced energy produced by the wind farm[18]. In order to address these problems an objective function has been established, aiming to maximize energy and avoid the influence of wake effect on specific wind turbines.
In this paper, we will start with the modeling of the wind farm and the used wake model, the following parts will present the objective function and the optimization algorithm applied to the Gasiri wind farm, finally a discussion of the results and conclusion are proposed.
2. Wind Farm Modeling
2.1. Wake modeling
The speed of the wind crossing the upstream Wind turbines (WT) is modified by the wake effect phenomenon. The manifestation of growing effects is marked by a reduction in wind speed and a maximization of turbulence in the windiest region. Indeed, the wind turbines placed in the wake zone generate a minimum of energy and more maintenance activities compared to upstream WT. Therefore, wake effect modeling can play à key role in determining the placement of WT. It also should be seriously considered during Wind farm design layout optimization (WFDLO).
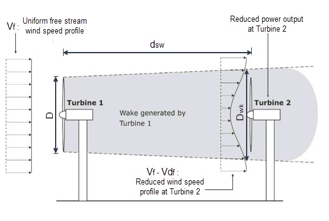 Figure 1: Jensen wake model [19]
Indeed, different wake models have been used to show the properties of wind speed losses [20], [21]. There are two main categories: analytical wake models and computer wake models which are at the origin of the resolution of the Navier-Stokes equation and which are more precise compared to other models. They require however more computation and higher cost which makes their use in WFDLO impossible [22]. Alternatively, the analytical wind speed solution is the basis of analytical wake models, they are widely used in optimization methods, often for large WFs with a large number of WTs [23], [24]. The most used wake model is Jensen’s with a linear expansion of the wake as an assumption [25]. Figure 1 describes the principle of the model developed by Jensen. The high efficiency of these models results from the power losses reliability and prediction with reasonable accuracy compared to other models as shown in [25]. Therefore, in this study, we adopt the Jensen model to calculate different wind speeds. So, the speed deficit is expressed as follows:
![]() where,
where,
Rotor Diameter (m)
Wake diameter (m)
Trust coefficient
Free incoming wind speed (m/s)
Wind velocity deficit (m/s)
The Wake diameter varies depending on rotor diameter and wake minimization coefficient, considered as constant throughout the whole study, the calculation of this coefficient is detailed in[26], [27].
2.2. Modeling of Energy Production
The estimation of energy production under the wake effect requires the calculation of the power of each wind turbine. Different expressions are commonly used to estimate the power of WT were carried out in [28]. Thus, the energy production of WT is calculated approximately as follows:
![]() where,
where,
represents the efficiency factor expressed by:
![]() In this study, the is assumed to be 40%. The total power produced by wind turbines operating under the wake effect is:
In this study, the is assumed to be 40%. The total power produced by wind turbines operating under the wake effect is:
![]() The efficiency of the wind farm is expressed by the following equation:
The efficiency of the wind farm is expressed by the following equation:
![]()
In order to facilitate the optimization of the studied wind farm, the positions of the wind turbines are designated by the Cartesian coordinates (x,y), the distances between the turbines and the calculation of the total wind speed deficit considering the overlapping zones are detailed. In [29][18], the total velocity deficit expression is expressed by:
![]() where, is the Overlap area (m2 ), represents the Swept area of wind turbines (m2 ) and is the number of upstream wind turbines.
where, is the Overlap area (m2 ), represents the Swept area of wind turbines (m2 ) and is the number of upstream wind turbines.
3. Methodology
3.1. Objective function
The main objective is to increase the wind farm output in terms of power and to standardize the wake losses for each wind turbine in the wind farm.
Indeed, some turbines of a wind farm are exposed to more wake effects than others, so they tend to have more problems during operation with a reduced lifespan. The objective function proposed below maximizes the energy production of WF and reduces the standard deviation of wake losses to which wind turbines are exposed.
The objective function denoted FOBJ is obtained as follows: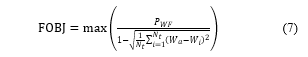 Where is the Mean wake loss, means the Wake loss of each turbine and is the number of wind turbines on the wind farm.
3.2. Optimization Algorithm
Due to the optimization difficulties, the wind farm design, and the limits of the approach to test errors and deterministic methods, the heuristic methods are chosen, being the most appropriate to solve this type of design problems. Besides, in the presented work we choose to use genetic algorithms to optimize the wind farm.
The choice to use genetic algorithms is due to the fact that these algorithms are considered to be:
- A flexible method to use and configure.
- Efficient in its ability to overcome the difficulty of local optima while exploring the design research space to converge towards the global optimum.
The flowchart of Figure 2 shows the optimization steps adopted to optimize a wind farm. In the MATLAB © software, we entered the data and models established in the previous part, the optimization process begins to search for an optimal solution. GA research techniques include the following main steps:
- Step 1: Random population generation of some turbines while respecting the constraints of the problem treated.
- Step 2: Evaluation of objective function WF layouts through the objective function.
- Step 3: Contribution to the next generation population by the selection of individuals. The probability of selection in the current generation results in a selection of good individuals. The objective of the crossover operator is to alter two pairs of genes (position) in order to generate another optimization as being a crossover function, the modification of a gene in another position is managed by random activation of the mutation with a determined probability.
- Step 4: production of a new location of the wind turbines in the park by the genetic algorithm (GA) which changes the previous population. The above steps are iterated until the maximum number of iterations is reached. The data parameters of our algorithm are shown in Table 1.
Table 1: Defined parameters of genetic algorithm
| GA Parameter | Value |
| Size of initial population | 150 |
| Selection pressure | 3 |
| Crossover probability | 0.25 |
| Mutation Probability | 0.75 |
| Iteration number | 350 |
Table 2 contains basic features of the wind turbine (HS50, U50, HJWT77) used in the Gasiri wind farm.
Table 2: Basic information of three types WTs
| Wind turbines features | HS50 | U50 | HJWT77 |
| Rated power (kW) | 750 | 750 | 1500 |
| Hub height (m) | 50 | 50 | 70 |
| Rotor diameter (m) | 50 | 50 | 77 |
| Cut-in wind speed (m/s) | 3.5 | 3 | 3.5 |
| Rated wind speed (m/s) | 12 | 12.5 | 13 |
| Cut-out wind speed (m/s) | 25 | 25 | 25 |
It is mandatory to initialize the proposed algorithm by information on the characteristics of the wind farm and the model chosen for the present study. Table 3 summarizes the data needed to successfully kickstart the genetic algorithm.
3.1. Case Study: Gasiri Wind Farm
In this part, the study focuses on optimizing the layout of wind turbines in the case of the Gasiri wind farm using the objective function described previously. The results obtained in this study will be compared with other results from the same wind farm [30].
Table 3: Input data for the genetic algorithm
| Site characteristics | Matrix of design variables | Models |
| Wind speed and direction | Configuration | Wake model |
| Wf size | Limit distance between | Power model |
| Roughness | WT design variables | WT design variables |
Gasiri wind farm is located in South Korea, precisely on Jeju Island; the distribution of the wind turbines and the wind rose are depicted in Figure 3. The Gasiri wind farm, contains 13 wind turbines of three types (HS50-750 kW, U50-750 kW, HJWT77- 1500 kW). In figure 3, the wind turbines are placed in a grid following the NNW direction, this direction is considered to be the dominant direction of the wind on the Gasiri wind farm.
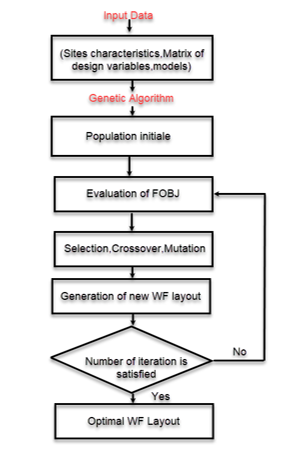 Figure 2: Genetic algorithm for WFDLO
The optimization of the wind farm requires a MATLAB code using the wind data, mentioned in Figure 3, Table 1, Table 2 and Table 3.
The calculation results of the annual AEP energy production are compared with the collected electricity production data in the Gasiri wind farm, as shown in Figure 4, there is a little difference between the real data and the calculated results but significantly more accurate than previous results obtained in the literature [30] using other types of algorithms. The difference is mainly due to the choice of the used wake model and the actual operation of each wind turbine. Equally large 750 kW wind turbines are not taken into account in the calculation because they have a low recovery rate due to the data collected. Figure 5 summarizes the results collected and calculated.
The calculation of the annual production of the wind farm is based on the operating assumption of 365 days per year which is equal to 8760 hours.
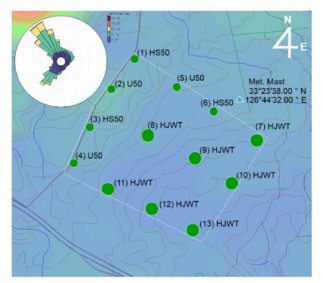 Figure 3: Arrangement of wind turbines and wind rose in the Gasiri wind farm [30]
The expression to calculate the annual production is expressed as follows:
![]()
where is the probability of wind blowing in speed bin k of turbine i at direction sector j, is the power of wind turbine i at wind speed bin k, and and represent the division by direction interval of total bearing and the value determined by dividing the range of speed (3-25 m/s) by the range of wind speed respectively.
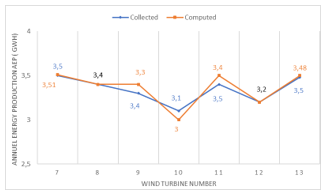 Figure 4: Comparison of the AEPs collected from Gasiri wind farm with the computed AEPs
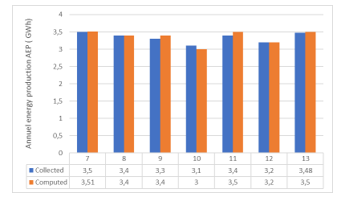 Figure 5: Difference in annual energy production between collected and computed energy
4. Results and Discussion
Figure 6 describes the variation of the objective function. We can clearly see that the total performance of the process of our algorithm improves and converges from 350 iterations. The objective function has a high value to be applied, because of the relative size of the value of the objective function which is not related to the accuracy of the optimal layout.
The difference in annual energy production between the collected energy data and the calculated energy is presented in Figure 5, the obtained results shows that the calculation of the sum of the annual production of wind turbines is equal to 23.51. Furthermore, in the case where the collected information on the production is equal to 23.48, this small difference of 0.03 is due to the simplifying assumptions and the uncertainties of the used wake model.
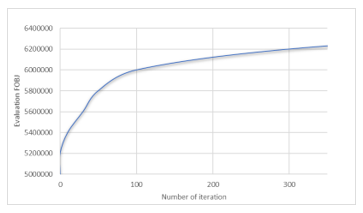 Figure 6: FOBJ evaluation using GA (genetic algorithm)
The calculation domain of our wind farm is delimited as mentioned in Figure 7. The spacing between the wind turbines is set at 230m in order to guarantee the minimum of 3 * D (rotor diameter). Therefore, to improve the free arrangement of wind turbines, the wind turbine location area has been divided into 120 * 110 cells having dimensions of 10m * 10m with respect for prohibited placement zones.
The optimization of the Gasiri wind farm is obtained using the algorithm in figure 8, then is compared by the position of the existing layout. Note that the HJWT77 type wind turbines which have a high rated power value tend to move forward following the direction of the wind. This can also be explained by the fact that the loss of wakes becomes minimal in the forward positions as shown in Figure 8.
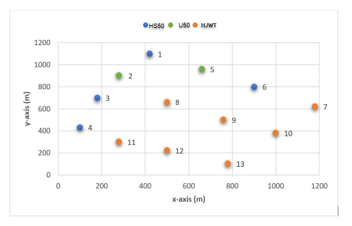 Figure 7: Coordinates of the wind turbines of the Gasiri wind farm
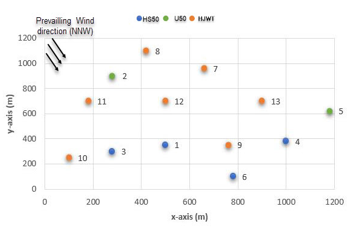 Figure 8: Gasiri wind farm layout optimization results obtained using objective function
 Figure 9: Annual energy production for existing layout and optimized layout obtained using objective function
It can be also seen that low-capacity wind turbines tend to move from their positions in the existing configuration and follow the direction of the prevailing wind in accordance with [30] who used the optimization with the simulated annealing algorithm but at levels of annual production the proposed optimization technique is eventually much more accurate than [30]. The annual energy production of wind turbines 7, 8, 9, 10, 11, 12 and 13, has increased while turbine number 1 has decreased from the current state Figure 9.
This significant increase for the turbines mentioned above is mainly due to the new designated positions following the windiest direction. The net annual energy production is summarized in the Table 4, we can also observe that the difference in the net AEP of the wind farm in the optimized case is 5.68 which is greater than the case of the existing configuration.
However, this annual power increase, in the case of the Gasiri wind farm, shows that the used objective function has achieved the expected goals of minimizing the undesirable effects of wake for all wind turbines which are exposed to these losses and of maximizing the power of the wind farm.
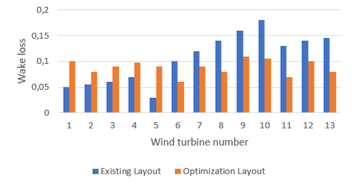 Figure 10: wake losses for the existing layout and the optimized layout
Figure 10, shows a comparison of wake losses between the existing layout and the optimized layout, we can clearly note that there is a significant reduction in wake loss for the optimized layout. This significant improvement justifies the benefice of using the proposed objective function in the genetic algorithm. Such choice leads to finding an optimal arrangement which maximizes the production of energy and standardizes the wake losses for all the wind turbines of the Gasiri wind farm.
Table 4: Comparison of annual energy production among existing layout and optimized layout
| Wind Turbine number | Net AEP/Gross AEP | |
| Existing layout | Optimized layout | |
| 1 | 1.45/1.52 | 1.41/1.60 |
| 2 | 1.59/1.69 | 1.73/1.8 |
| 3 | 1.47/1.56 | 1.51/1.58 |
| 4 | 1.54/1.58 | 1.66/1.75 |
| 5 | 1.42/1.55 | 1.41/1.56 |
| 6 | 1.38/1.54 | 1.52/1.65 |
| 7 | 3.72/4.15 | 4.05/4.85 |
| 8 | 3.50/4.06 | 4.51/5.10 |
| 9 | 3.35/4.00 | 4.23/5.00 |
| 10 | 3.33/4.00 | 4.28/4.85 |
| 11 | 3.48/4.00 | 4.14/4.88 |
| 12 | 3.34/3.88 | 4.05/4.50 |
| 13 | 3.35/3.91 | 4.10/4.73 |
| Total | 32.92/37.50 | 38.6/43.85 |
| difference | (+)5.68 | |
By examining more in details, the results of Figure 11, we can see that the level of wake loss becomes more or less uniform in all the wind turbines, this prevents the difference in energy losses between the different wind turbines of the Gasiri wind farm.
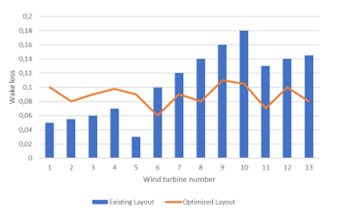 Figure 11: uniformity of wake losses for optimized layout
Moreover, such measures maximize the energy production. Table 5 presents a comparison of the wake losses between the existing layout and the optimized layout. It can be noticed that there is a significant reduction in the level of wake losses which is -18.67 %, this reduction is the result of the new optimized arrangement of the wind turbines which prevents the interference generated between the upstream and downstream turbines. Furthermore, we see a small difference between the wake loss results in the case of an optimized layout which indicates that the wake loss variable follows a uniform law.
Table 5: wake loss percentage values between the existing layout and the optimized layout
| Wind turbine number | Wake loss (%) | |
| Existing layout | Optimized layout | |
| 1 | 5.16 | 10.02 |
| 2 | 5.72 | 8.10 |
| 3 | 6.13 | 9.02 |
| 4 | 2.32 | 9.8 |
| 5 | 8.13 | 9.06 |
| 6 | 10.06 | 7.05 |
| 7 | 10.39 | 8.50 |
| 8 | 13.87 | 8.3 |
| 9 | 16.17 | 12.1 |
| 10 | 17.83 | 11.13 |
| 11 | 13.04 | 7.09 |
| 12 | 13.87 | 10.17 |
| 13 | 14.38 | 8.06 |
| Total | 137.07 | 118.4 |
| Difference | (-)18.67 | |
5. Conclusion
In this article, a study of the optimization of a wind farm using a new approach is presented. An objective function was adopted trough the mean of a genetic algorithm in order to optimize the wind turbines layout. This method aims to maximize the energy production and minimize the wake losses for all wind turbines in the wind farm. The presented method applied to the Gasiri wind farm has shown promising results, it didn’t just minimize the wake losses but also uniformizes it among the wind turbines in the farm. The new layout shows that optimized positions of the wind turbines with higher rated power tend to slide forward with the wind direction. Moreover, the analysis of the simulation results in the current study indicates that the adoption of this optimized layout grants a 17% energy gain compared to the existing layout and ensure a considerable reduction in levels of wake losses estimated at -18%.
The layout optimization in this study was primarily based on a cost function targeting the minimization of wake losses. In future studies we aspire to study the correlation between the arrangement of wind turbines using a multi-objective function and the cost related to this optimization.
- (PDF) Wind energy in Europe in 2018, Jan. 2021.
- E. Hau, H. von Renouard, Windmills and Windwheels, Springer Berlin Heidelberg: 1–21, 2006, doi:10.1007/3-540-29284-5_1.
- J. Herbert-Acero, O. Probst, P.-E. Réthoré, G. Larsen, K. Castillo-Villar, “A Review of Methodological Approaches for the Design and Optimization of Wind Farms,” Energies, 7(11), 6930–7016, 2014, doi:10.3390/en7116930.
- S.H. Kim, H.K. Shin, Y.C. Joo, K.H. Kim, “A study of the wake effects on the wind characteristics and fatigue loads for the turbines in a wind farm,” Renewable Energy, 74, 536–543, 2015, doi:10.1016/j.renene.2014.08.054.
- J.F. Manwell, J.G. McGowan, A.L. Rogers, Wind Energy Explained, John Wiley & Sons, Ltd, Chichester, UK, 2009, doi:10.1002/9781119994367.
- L. Parada, C. Herrera, P. Flores, V. Parada, “Wind farm layout optimization using a Gaussian-based wake model,” Renewable Energy, 107, 531–541, 2017, doi:10.1016/j.renene.2017.02.017.
- M. Khanali, S. Ahmadzadegan, M. Omid, F. Keyhani Nasab, K.W. Chau, “Optimizing layout of wind farm turbines using genetic algorithms in Tehran province, Iran,” International Journal of Energy and Environmental Engineering, 9(4), 399–411, 2018, doi:10.1007/s40095-018-0280-x.
- Welcome to OATAO (Open Archive Toulouse Archive Ouverte) – oatao, Jan. 2021.
- P. Hou, W. Hu, C. Chen, M. Soltani, Z. Chen, “Optimization of offshore wind farm layout in restricted zones,” Energy, 113, 487–496, 2016, doi:10.1016/j.energy.2016.07.062.
- D. Guirguis, D.A. Romero, C.H. Amon, “Gradient-based multidisciplinary design of wind farms with continuous-variable formulations,” Applied Energy, 197, 279–291, 2017, doi:10.1016/j.apenergy.2017.04.030.
- J.Y.J. Kuo, D.A. Romero, C.H. Amon, “A mechanistic semi-empirical wake interaction model for wind farm layout optimization,” Energy, 93, 2157–2165, 2015, doi:10.1016/j.energy.2015.10.009.
- A. Emami, P. Noghreh, “New approach on optimization in placement of wind turbines within wind farm by genetic algorithms,” Renewable Energy, 35(7), 1559–1564, 2010, doi:10.1016/j.renene.2009.11.026.
- A. Mittal, L.K. Taylor, “Optimization of large wind farms using a genetic algorithm,” in ASME International Mechanical Engineering Congress and Exposition, Proceedings (IMECE), 3159–3172, 2012, doi:10.1115/IMECE2012-87816.
- S.A. Grady, M.Y. Hussaini, M.M. Abdullah, “Placement of wind turbines using genetic algorithms,” Renewable Energy, 30(2), 259–270, 2005, doi:10.1016/j.renene.2004.05.007.
- J. Serrano González, M. Burgos Payán, J.M. Riquelme Santos, “Optimal design of neighbouring offshore wind farms: A co-evolutionary approach,” Applied Energy, 209, 140–152, 2018, doi:10.1016/j.apenergy.2017.10.120.
- P. Hou, W. Hu, M. Soltani, C. Chen, Z. Chen, “Combined optimization for offshore wind turbine micro siting,” Applied Energy, 189, 271–282, 2017, doi:10.1016/j.apenergy.2016.11.083.
- A.P.J. Stanley, A. Ning, “Massive simplification of the wind farm layout optimization problem,” Wind Energy Science, 4(4), 663–676, 2019, doi:10.5194/wes-4-663-2019.
- B. Abdelouahad, M. Khalifa, R. Abdelhadi, “Development of a multiple wake model based on rapid recovery factor in intense overlap case,” International Journal of Advanced Trends in Computer Science and Engineering, 9(1), 32–39, 2020, doi:10.30534/ijatcse/2020/0691.52020.
- N.O. Jensen, General rights A note on wind generator interaction, 1983.
- C.L. Archer, A. Vasel-Be-Hagh, C. Yan, S. Wu, Y. Pan, J.F. Brodie, A.E. Maguire, Review and evaluation of wake loss models for wind energy applications, Applied Energy, 226, 1187–1207, 2018, doi:10.1016/j.apenergy.2018.05.085.
- T. Göçmen, P. Van Der Laan, P.E. Réthoré, A.P. Diaz, G.C. Larsen, S. Ott, Wind turbine wake models developed at the technical university of Denmark: A review, Renewable and Sustainable Energy Reviews, 60, 752–769, 2016, doi:10.1016/j.rser.2016.01.113.
- N.A. Andersen, S.J. Sørensen, J.N. Shen, Analysis of turbulent wake behind a wind turbine, Lyngby, 2013.
- R. Shakoor, M.Y. Hassan, A. Raheem, Y.K. Wu, Wake effect modeling: A review of wind farm layout optimization using Jensen’s model, Renewable and Sustainable Energy Reviews, 58, 1048–1059, 2016, doi:10.1016/j.rser.2015.12.229.
- L. Wang, A.C.C. Tan, M. Cholette, Y. Gu, “Comparison of the effectiveness of analytical wake models for wind farm with constant and variable hub heights,” Energy Conversion and Management, 124, 189–202, 2016, doi:10.1016/j.enconman.2016.07.017.
- H. Sun, X. Gao, H. Yang, A review of full-scale wind-field measurements of the wind-turbine wake effect and a measurement of the wake-interaction effect, Renewable and Sustainable Energy Reviews, 132, 110042, 2020, doi:10.1016/j.rser.2020.110042.
- S.A. MirHassani, A. Yarahmadi, “Wind farm layout optimization under uncertainty,” Renewable Energy, 107, 288–297, 2017, doi:10.1016/j.renene.2017.01.063.
- N. Charhouni, M. Sallaou, K. Mansouri, “Realistic wind farm design layout optimization with different wind turbines types,” International Journal of Energy and Environmental Engineering, 10(3), 307–318, 2019, doi:10.1007/s40095-019-0303-2.
- C. Carrillo, A.F. Obando Montaño, J. Cidrás, E. Díaz-Dorado, Review of power curve modelling for windturbines, Renewable and Sustainable Energy Reviews, 21, 572–581, 2013, doi:10.1016/j.rser.2013.01.012.
- J. Feng, W.Z. Shen, “Wind farm layout optimization in complex terrain: A preliminary study on a Gaussian hill,” in Journal of Physics: Conference Series, Institute of Physics Publishing, 2014, doi:10.1088/1742-6596/524/1/012146.
- K. Yang, G. Kwak, K. Cho, J. Huh, “Wind farm layout optimization for wake effect uniformity,” Energy, 183, 983–995, 2019, doi:10.1016/j.energy.2019.07.019.
Citations by Dimensions
Citations by PlumX
Google Scholar
Scopus
Crossref Citations
No. of Downloads Per Month
No. of Downloads Per Country