Indoor Positioning System using WKNN and LSTM Combined via Ensemble Learning
Volume 6, Issue 1, Page No 242-249, 2021
Author’s Name: Dionisius Saviordo Thenuardia), Benfano Soewito
View Affiliations
Computer Science Department, BINUS Graduate Program – Master of Computer Science, Bina Nusantara University, Jakarta, 11480, Indonesia
a)Author to whom correspondence should be addressed. E-mail: dionisius.thenuardi@binus.ac.id
Adv. Sci. Technol. Eng. Syst. J. 6(1), 242-249 (2021); ![]() DOI: 10.25046/aj060127
DOI: 10.25046/aj060127
Keywords: Indoor Positioning System, Weighted K-Nearest Neighbor, Long Short-Term Memory, Ensemble Learning, WiFi Fingerprinting

Export Citations
Indoor positioning system (IPS) has become a high demand research field to be developed and has made considerable progress in recent years. Wi-Fi fingerprinting is the most promising technique that produces an acceptable result. However, despite the large amount of research that has been done using Wi-Fi fingerprinting, only a few Wi-Fi based IPS in the market can be said to be successful. Doing the research in a controlled environment and ignore the temporal signal changes may be the cause of such scenario. A long-term dataset was built to overcome this issue, yet the distance error of the state of the art was 2.48m. Therefore, we aim to reduce the distance error by combining two positioning algorithms which are Weighted k-Nearest Neighbor (WKNN) and Long-Short Term Memory (LSTM) using ensemble learning. The result shows that our ensemble method can reduce the localization error to 1.89m and improve the performance of the IPS by 23.7% when compared to the state of the art.
Received: 13 November 2020, Accepted: 26 December 2020, Published Online: 15 January 2021
1. Introduction
Today, outdoor positioning is already a mature research field. An object with Global Navigation Satellite System (GNSS) service– such as Global Positioning System (GPS), GLONASS, Galileo, BeiDou – can be easily located with the help of satellite signal with high accuracy [1].
On the contrary, Indoor Positioning has not reached its maximum results and is on the focus of researchers recently. Satellite signals cannot be used for Indoor Positioning System (IPS) purposes due to too much signal attenuation in an indoor environment [2] that results in IPS with an accuracy of more than 100m [3]. IPS is very useful and has many functionalities in an environment like museum, department store, university, etc. Which is why IPS has become a high demand research field to be developed and has made considerable progress in recent years. Due to the absence of satellite in an indoor environment, researchers attempt to utilize other signals to be used in IPS such as Wi-Fi, Bluetooth, FM radio, RFID, ultrasound or sound, light, and magnetic field [4].
Wi-Fi signal has been the most popular and most used in developing IPS in recent years because it achieves high applicability in a complex indoor environment and does not require line-of-sight measurement of Access Points (APs) [4]. However, Wi-Fi also faces several problems when deployed in IPS. Wi-Fi is usually established for communication purposes and rarely deployed with the ideal density and geometry for IPS [5]. The existing environment will need to deploy extra AP to create an ideal environment for IPS, which results in spending more money and makes it relatively expensive.
The most popular and promising approach in building an IPS is fingerprinting. This approach has two stage, offline phase and online phase. In the offline phase, the characteristics of several locations, called as Reference Point (RP), is measured. Then, a positioning algorithm will be used in online phase using the data collected during the offline phase. IPS with Fingerprinting approach can be viewed as a classification or regression problem. Many classification and regression algorithms like k-Nearest Neighbor
(KNN), Weighted k-Nearest Neighbor (WKNN), Support Vector Machine (SVM), Multilayer Perceptron (MLP), Convolutional Neural Network (CNN), Recurrent Neural Network (RNN), and Long Short-Term Memory (LSTM) have been tested.
Combining the two, Wi-Fi fingerprinting has been the most popular technique for developing IPS. With dense Wi-Fi coverage in a well-surveyed environment, Wi-Fi fingerprinting can achieve acceptable accuracy, as shown in recent research [6]. Local Featurebased Deep Long Short-Term Memory (LF-DLSTM) was proposed and achieves localization performance with mean localization errors of 1.48m and 1.75m under the research lab and office environments, respectively.
However, to the best of our knowledge, only a few WiFi-based IPS in the market can be said to be successful. Although there are many methods that have been tested before, the accuracy in the real environment decreases. This may happen if the testing of the IPS was done in a specific, probably controlled environment. Therefore, the accuracy in the real environment may decrease significantly [7]. To overcome this issue, research in IPS needs to be done using a public dataset, therefore the environment cannot be controlled by the authors.
There are many public IPS dataset that can be obtained online such as [8] and [9]. However, these datasets were collected in one day only and do not take into account the changes in the temporal signal that inevitably occur in the real environment. This happens because the RSSI received from an AP might be different between one day and the next day, even if the location and environment is precisely the same [10]. Therefore, the accuracy in the real environment may drop significantly. To resolve the issue, dataset needs to be collected and updated periodically.
In this research, we use an IPS dataset that is published online which considers the temporal signal changes [7]. To the best of our knowledge, the best accuracy that has been done using this dataset was the research by Hsieh that used RNN to obtained a distance error of 2.48m [11]. To the best of our knowledge, the research employs RNN and LSTM separately and is applied directly to the dataset without any modification to prevent overfitting. However, the training data only contains fingerprint from 24 RP, while the testing data contains fingerprint from 106 RP. With much fewer reference points in the training data, the model tends to overfit.
This research aims to reduce the localization errors by applying methods to prevent overfitting in the LSTM model. We also provide a new way to reduce the localization errors further by combining two positioning algorithm which are WKNN and LSTM using ensemble learning.
2. Literature Review
2.1 Fingerprinting
Fingerprinting technique utilizes the signal characteristics of a specified location in a particular environment. It consists of an offline phase and an online phase. During the offline phase, a site survey is conducted on the environment. First, several location coordinates, referred to as Reference Points (RPs) will be chosen, which later each of them will be used to collect the RSSI from numerous access points. Multiple RSSI readings will be taken in each RPs. These collections of data consist of RPs and RSSI from multiple access points is usually known as radio map. During the online phase, a mobile unit observes RSSI measurements at a specific location and use an algorithm to associate the measurements with the radio map. The mobile unit is assumed to be collocated with an RP if the measurements made in the online phase and offline phase are similar.
Fingerprinting approaches can be viewed as a classification problem. The radio map collected during the offline phase is trained to obtain a model. Then, the position of the mobile unit will be estimated by putting the measurements taken into the model as a parameter. Classification algorithm such as K-Nearest Neighbor (KNN), Weighted K-Nearest Neighbor (WKNN), Support Vector
Machine (SVM), Na¨ıve Bayes, Artificial Neural Network (ANN), Recurrent Neural Network (RNN), Long-Short Term Memory networks (LSTM) have been used.
In a traditional site survey where the surveyor collects the radio map by standing at RP and taking multiple measurements, it took 10 hours for two people to build a radio map consists of 150 RPs in a 281m2 environment [12]. It can be concluded that, when using a site survey as a radio map collection method, the offline phase is time-consuming, labor-intensive, and cost-prohibitive.
Fingerprinting can produce a low localization error because unlike any other approach, fingerprinting relies on the characteristics of the environment itself. Fingerprinting allows obstacles like wall, furniture, and other static objects do not interfere with localization accuracy. However, this also works as a trade-off. If there are any changes in the environment, such as furniture and access points relocation, another site survey is needed.
Then, researchers tried to lessen the time taken to build a radio map. [13] introduced the Quick Radio Fingerprint Collection method (QRFC) that allows radio map to be created, simply by holding a smartphone while walking. QRFC makes the radio map collection become effortless, especially if there are extra volunteers. Even with lesser times, radio map built by QRFC has been proven gave the same results with a radio map created by a site survey, and even better.
The fingerprinting technique offers both accuracy and ubiquity.
Access point location does not need to be known, and there is no Line of Sight (LOS) requirements. Usually, fingerprinting techniques produce an IPS with better localization accuracy, which makes it superior to other methods [14].
2.2 Weighted k-Nearest Neighbor (WKNN)
Weighted k-Nearest Neighbor (WKNN) is a modified version of kNearest Neighbor which is a supervised machine learning algorithm that can be used for classification and regression problems. KNN assumes the data in the same cluster is identical and has the same characteristic. It can be seen in Figure 1, that the data in the same cluster is adjacent one to another.
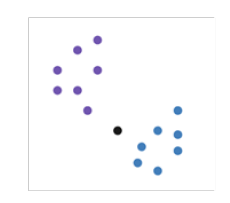
Figure 1: k-Nearest Neighbor
The similarity between two data points can be known from the distance between them. The distance can be calculated using several methods, the most basic and used one are the Euclidean distance
(1). The smaller the distance, the more similar the data is.
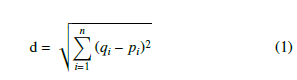
Euclidean distance is used to calculate the distance between the new data and the dataset. Where n is the number of access points that transmit RSSI, qi is the RSSI measured on the RP from ith access point, and pi is the RSSI measured on the mobile unit from ith access point.
A number of k data points with the smallest distance are considered as the nearest neighbor to the new data, which means they are similar to each other. The mode of the k labels will be considered as the label of the new data in a classification problem. In a regression problem, the mean of the k labels will be returned instead.
However, the hyperparameter k needs to be chosen carefully. If k is too large, the neighborhood may include too many data points from other classes, which leads to inaccuracy. However, KNN would be more sensitive to outliers if k is too small. Several experiments need to be done to decide the value of hyperparameter k in KNN.
To overcome existing problem in KNN, a weight is given to every k neighbors; thus, this algorithm is called weighted k-nearest neighbor. Any function can be used to determine the weight of every neighbor, usually called a kernel function. The bigger the distance gap between the new data and its neighbor, the smaller the weight is. Bigger weight means the data is more similar than other neighbors with a smaller weight. In this research, the kernel function is defined in (2).

Where k is the total number of neighbors, di is the distance from the mobile unit to ith neighbor, and wi is the weight for ith neighbor. Then, the position of the mobile unit can be estimated by assigning the weight to the RP coordinates using (3).
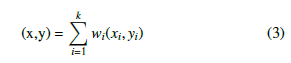
Where wi represent the weight for ith neighbor, while xi and yi is the coordinates of the ith neighbor which are X and Y, respectively.
2.3 Long Short-Term Memory (LSTM)
Long Short-Term Memory (LSTM) was made to overcome the problems found in Recurrent Neural Network (RNN). It is well known that RNN suffers from the vanishing gradient problem during backpropagation, which makes it is hard to remember the importance of the data from earlier timesteps if the data sequence is long enough. RNN layers are connected to each other, as shown in Figure 2. To obtain the output at time t (Yt), RNN takes into account the input at time t (Xt) and the hidden state from the previous time step (ht-1). The hidden state from previous time step (ht-1) is passed to the current step (ht) as an input, which holds the information of the previous time step. However, the gradient in the earlier layers in RNN usually shrinks as the sequence gets longer, and with a low gradient update rate, the layers stop learning. With the layers from early timesteps stop learning, RNN will forget what it had seen when the sequence got longer, thus having a short-term memory.
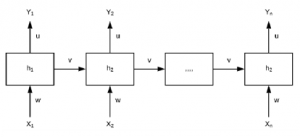
Figure 2: Recurrent Neural Network
LSTM used the same flow as RNN, where the information from the previous time step is passed onto the current time step. The difference is LSTM has an internal mechanism called gates that can learn which data is essential or not. If the data is considered important, LSTM will keep the information. If it turns out that the data is not important, LSTM will forget the information. This internal mechanism in LSTM is called a cell state, which has various gates.
The cell state can be thought of as a “memory” in LSTM, where the cell state will carry information throughout the processing of the sequence. As the sequence goes, additional information will be added to the cell, and some will be removed from the cell state. The cell state consists of three gates: input gate, forget gate, and output gate. These gates determine which information will be stored, keep, and be omitted from the cell state. Two activation functions are used within the three gates, which are sigmoid and tanh, which can be written as (4) and (5), respectively.

2.3.1 Forget Gate
Forget Gate decides which information to be kept or discarded. Both information from the previous hidden state and the current input will be passed into a sigmoid function. The forget gate can be described as (6).
![]()
The information is considered as unimportant if f t is close to zero, and the cell state will discard the information. If f t is close to 1, that means the information is important.
2.3.2 Input Gate
The input gate has a role in determining which information will be added to the hidden state from the current input. Besides the sigmoid activation function, the input gate also uses tanh activation function.
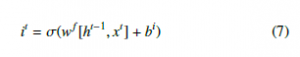
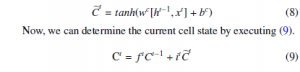
First, the previous hidden state will be passed along with current input into sigmoid functions, written in (7). Then, we pass the hidden state and current input into tanh function, written in (8), producing Cet.
2.3.3 Output Gate
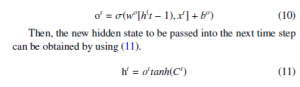
The output gate is the one that produces a new hidden state to be passed to the next time step. Just like forget and input gate; first we passed the information from the previous hidden state along with current input into sigmoid function, written in (10)
2.4 Related Works
The most straightforward yet beneficial application of IPS can be found in [15]. The research provides a system to ease doctors and nurses in locating their patients, especially in emergencies. The system was built by deploying multiple BLE throughout the ceiling of the hospital for every 10m. By using the proximity technique, the nearest BLE will be chosen based on the RSSI, and the location of the BLE will be sent to the system server for location mapping. The user will be considered in the same room, or the same area with the nearest BLE detected. By using this algorithm, the system achieved 97.22% accuracy for location classification.
An IPS made using the multilateration technique can be seen in [16]. The research was performed in a furnished laboratory environment with 13.1m x 6.5m. A total of 6 Raspberry Pi3 was used to capture the signal from a mobile BLE that transmits two signals at each second. Linear Least Squares is a multilateration method and was used in the research with a localization errors up to 1.79m.
Meanwhile, [6] proposed an IPS based on Wi-Fi signal with
Deep LSTM architecture, which is just a stack of LSTM. The data were preprocessed using the sliding window to reduce the noise effect on the RSSI, which produces a more robust representation of the RSSI with minimal loss of signal properties. Two LSTM layers were used with 30 and 40 hidden layers. Then, a fully connected layer with a size of 60 was used to transfer the outputs of the second LSTM layers. The architecture also implements one dropout layer to prevent overfitting that usually happened to deep networks. The experiment was carried in two environments, a research lab with 35.3m x 16m and an office with 55m x 50m. The result of DLSTM was compared to ANN, SVR, Extreme Machine Learning (ELM), WKNN, and Stacked Denoising Autoencoder (SDA). The result shows that the proposed algorithm outstands the other algorithm with a localization error of 1.48m and 1.75m under the research lab and the office, respectively.
Due to creating a fingerprint database took a long time, some researchers focus on creating a fingerprint database for indoor positioning research purposes, such as [17]. The dataset consisted of multiple buildings and multiple floors and is used by Jang, who proposed a convolution neural network (CNN) [18]. The network uses the Interquartile range (IQR) for feature scaling, a dropout layer, data balancing, and ensemble methods. The architecture consists of 3 identical CNN models, with each of them has a different filter.
The research shows that the proposed algorithm outperforms the Deep Neural Network (DNN) architecture.
RNN and LSTM has been proved to be successful in detecting pedestrian trajectory in indoor environment [19], [20], which inspired Hsieh et al. to utilize RNN and LSTM in indoor positioning system [11]. The research used a public dataset, which is the one used in this research [7]. The model consists of input layer, RNN or LSTM layer, fully connected layer with 40 neurons, fully connected layer with 2 neurons, and output layer. The number of RNN or LSTM layers were adjusted to 1, 3, and 5. The result shows that the best accuracy can be achieved by employing 5-layer RNN with a distance error of 2.48m and 99.6% accuracy of floor prediction.
Several ensemble learning approach has been done in building Indoor Positioning System. A research by Li et al. provide an ensemble approach to fuse Differential Time Difference Of Arrival (DTDoA) with RSS value [21]. Some research provide a way to combine the results from several positioning algorithm such as KNN [22]–[24] and neural network [25]. Research by Hayashi divide the environment into several area and each area has its own positioning algorithm. The result from positioning algorithms from each area is combined to get the final prediction [26].
A simple application of IPS can be created using simple techniques such as using proximity to locate the mobile unit in a particular subarea. To determine the exact position of the mobile unit in a small to medium environment scale, trilateration or multilateration can be used. However, if the environment grows bigger into a multi-floor or even multi-building environment, using a fingerprint technique is recommended.
Ensemble approach has been proved to be successful in both classification and regression problem [24]. Previous research provide ways to combine the result several weak-learners to obtain the final prediction. To the best of our knowledge, this is the first research that uses an ensemble approach where the result from one positioning algorithm was taken as an input for the next positioning algorithm in the IPS field.
3. Methodology
3.1 Dataset
We used a dataset released online by Mendoza et al. [7] to verify our proposed method. According to the authors, the dataset has been standardized and ready to be used for indoor positioning research purposes. The dataset was collected in a library that consists of multiple bookshelves from two different floors (3rd and 5th) with total coverage of 308.4m2. To overcome the problem that occurs because of temporal signal changes, the data were collected within 15 months, with 63.504 measurements in total.
Each measure in the dataset provides information such as exact position, RSSI readings, timestamps, and some identifiers. Four hundred forty-eight access points were used in the measurement.
Access points were installed on both floor levels at approximately 2.65m from the ground.
To collect the fingerprint database, A trained person that is called as the subject was chosen. Multiple locations were chosen to create the radio map. The radio map consists of fingerprint data with the subject facing four different directions, which are forward, backward, left, and right. At the offline stage, the subject stood at the selected location and held Samsung Galaxy S3 with the right hand in front of his chest. The mobile phone was equipped with an application that collects the RSSI of the Wi-Fi and eases the collection process. The app gave an ordered list of locations for the subject and gave a specific direction for the subject has to face. Therefore, this application reduces the likelihood of the subject placing themselves in wrong positions.
The dataset has been split into training and testing dataset by the authors. The training dataset consists of 16.704 fingerprints from 24 different RP while the testing dataset consists of 46.800 fingerprints from 106 different RP. Each fingerprint consists of 448 RSSI readings from every AP. However, not all of them were detected. If an AP is not detected in a fingerprint, the value will be recorded as 100. In this research, the dataset is scaled using Min-Max Scaler which can be described in (12).
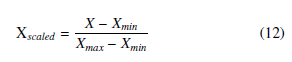
where X is the original value of the feature, Xmax and Xmin is the highest and smallest value that exists in the feature, respectively.
3.2 Proposed Method
Several research [22]–[25] used an ensemble learning approach where the outcomes of several positioning algorithms are combined into one single output. In this study, we provide a different ensemble method which combines two positioning algorithms, namely WKNN and LSTM.
Since the result from WKNN will be used as an input in the LSTM model, we need to get the coordinates and floor prediction from WKNN. Each data in the testing dataset which contains RSSI values from 448 APs will be used as an input into WKNN to predict the coordinates and the floor level of the object. The data will be scaled using Min-Max Scaler to turn it into the range of 0-1 by using (12).
For every data in the testing dataset, WKNN will create a list containing all of its neighbors from the training dataset. To be precise, each testing data will have 16.704 neighbors in total. Every neighbor has its own distance from the testing data. The distance is measured using Euclidean Distance (1). The smaller the distance means the RSSI values between the testing data and the neighbor is similar to each other. If the RSSI values are similar, it can be assumed that the object positions are also similar. Therefore, it can be concluded that we can predict the coordinates and the floor level of the object by collecting several neighbors with similar characteristics (RSSI value).
A number of k neighbors with the smallest Euclidean Distance will be used to predict the coordinates and floor level of the object. The coordinates, both X and Y, is calculated using (3). Since the smaller the distance means the data is more similar, a neighbor with a smaller distance will have more weight. Thus, it has more impact in predicting the coordinates of the object. We select the floor level that occurs the most within the k neighbors as the floor level prediction of the object. Since we are using mode to predict the floor level, the number of neighbors must be odd. Hence, the configuration of hyperparameter k is set to an odd number in this research.
After the coordinates and floor level of the object has been predicted by WKNN, the result will be concatenated to the testing data to create a new dataset called WKNN dataset. WKNN dataset consists of RSSI values from 448 APs, predicted coordinates by WKNN, predicted floor level by WKNN, real coordinates, and real floor level.
The WKNN dataset will be used to calculate the localization error and accuracy of the WKNN model, and it will also be used in LSTM architecture. Two architecture are proposed in this model since we are using regression to predict the coordinates and classification to predict the floor level of the object. Figure 3 shows the overall process of our ensemble method where the result from WKNN is combined with the original features and is used as an input to the LSTM model. To the best of our knowledge, this is the first study that uses this kind of ensemble learning approach in the IPS field.

Figure 3: Proposed Method
4. Experimental Design and Result
4.1 Experimental Design
Both regression and classification will be done in the experiment since the dataset contains data with multiple floors. The purpose of the regression model is to predict the coordinates of the object while the classification model predicts the level of the floor the object is on.
Three scenarios will be conducted in the experiment. The first scenario is to use only WKNN to predict the coordinates and the level of the floor of the object. The second scenario will use both the regression and classification model to predict the coordinates and the level of the floor of the object. The third scenario is similar to the second scenario. But in this scenario, the result from WKNN (coordinates or floor) will be added as an input for the model. Therefore, there will be 4 neural network architecture used in this experiment. All of the architecture is trained using k-fold cross validation to prevent overfitting. The number of folds used in this research is 5.
The neural network of the regression model can be seen in Figure 4. The input layer consists of 448 features which are the RSSI value for each AP. The features are fed to LSTM layer that consists of 448 neurons with tanh as its activation function. To prevent overfitting, a dropout layer is added in the LSTM layer with 0.5 dropout rate. Then, the result from LSTM layer will be fed into a fully connected layer that consists of 40 neurons with sigmoid as its activation function. Finally, the output layer consists of 2 neuron that represent the coordinates of the object. Linear activation function is used in the output layer. The model uses Adaptive Moment estimation (adam) as the optimizer and root mean squared error as the loss function. Ten epochs ere used to train the model with 5 training examples for each batch.
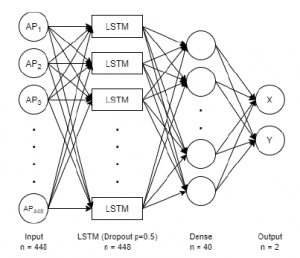
Figure 4: LSTM Regression Architecture
The architecture of the classification model can be seen in Figure 5. The architecture is similar to the regression model. The difference resides in the output layer which only consists of one neuron that represents the floor level of the object. Instead of using the linear activation function, sigmoid is used as the activation function of the output layer. Binary cross-entropy is used as the loss function and accuracy as the metrics.
The architecture of the regression model for our proposed method (WKNN-LSTM) can be seen in Figure 6. All of the activation functions, optimizer, number of epochs, batch size of this architecture is the same as the one used in LSTM regression architecture. The only difference is the number of neurons in the input layer and LSTM layer since there are additional inputs which are the coordinates from WKNN.

Figure 5: LSTM Classification Architecture
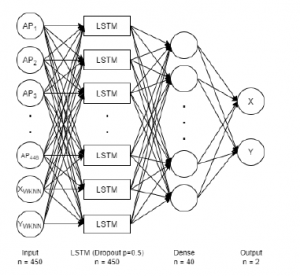
Figure 6: WKNN-LSTM Regression Architecture
The architecture for WKNN-LSTM classification model can be seen in Figure 7. Same as before, the architecture use the same settings with LSTM classification architecture and there will be one additional input which is the floor level prediction from WKNN.
4.2 Experimental Result
In the first scenario, we try out several WKNN model with a different values of hyperparameter k. The result of the first scenario can be seen in Table 1.
It can be seen that the distance error decreases as the hyperparameter k increase while the floor prediction accuracy does not show any significant changes. The increase in performance is pretty significant between k=5 and k=13. However, the performance gap between k=13, k=21, and k=25 is not too big. Yet, as the hyperparameter k increases, the computational cost and time also increase. Therefore, hyperparameter k needs to be adjusted according to the user needs.

Figure 7: WKNN-LSTM Classification Architecture
Table 1: WKNN Results
The result of the second and third scenario can be seen in Table 2. The three hyperparameter k values in Table 1 will be applied in the third scenario for WKNN model to predict the coordinates and the floor level. We also compare the result from our experiment with the research by Hsieh [11].
Table 2: LSTM and WKNN-LSTM Results
| Model | Distance Error (RMSE) | Floor Prediction Accuracy |
| RNN [11] | 2.48 | 99.6% |
| LSTM [11] | 2.57m | 99.5% |
| Our LSTM | 1.99m | 99.8% |
| WKNN-LSTM (k = 13) | 1.90m | 99.85% |
| WKNN-LSTM (k = 21) | 1.92m | 99.87% |
| WKNN-LSTM (k = 25) | 1.89m | 99.86% |
Our LSTM model can achieve distance error and accuracy of 1.99m and 99.8%, respectively. Both predictions are superior compared to WKNN model. However, when the result from WKNN is used as an additional input to LSTM, our model can achieve distance error and accuracy of 1.89m and 99.86%.
It can be seen that the LSTM model surpass the performance of WKNN model in predicting the coordinates and the floor level. Yet, the performance can increase even more if both of the model is combined using our ensemble approach.
5. Conclusion
In this research, we proposed a new way to reduce localization error by using ensemble learning. The ensemble consists of two positioning algorithms which are WKNN and LSTM. Aside from the original features which are RSSI values from all of the APs, the result from WKNN, either the coordinates or the floor level, are taken as an additional input for the LSTM model. The result shows that our ensemble approach can improve the performance of the IPS by 11.6% and 5% when compared to the performance of our WKNN and LSTM, respectively.
- H.-W. Bernhard, L. Herbert, J. Collins, Global positioning system: Theory and practice, 2012.
- G. Ding, Z. Tan, J. Wu, J. zhang, “Indoor fingerprinting localization and track- ing system using Particle Swarm Optimization and Kalman Filter,” IEICE Transactions on Communications, 98, 502–514, 2015, doi:10.1587/transcom. E98.B.502.
- S. Chai, R. An, Z. Du, “An Indoor Positioning Algorithm using Bluetooth Low Energy RSSI,” in Proceedings of the 2016 International Conference on Ad- vanced Materials Science and Environmental Engineering, 274–276, Atlantis Press, 2016/04, doi:https://doi.org/10.2991/amsee-16.2016.72.
- S. He, S. . G. Chan, “Wi-Fi Fingerprint-Based Indoor Positioning: Recent Advances and Comparisons,” IEEE Communications Surveys Tutorials, 18(1), 466–490, 2016, doi:10.1109/COMST.2015.2464084.
- F. R., R. Harle, “An analysis of the accuracy of Bluetooth Low Energy for Indoor Positioning applications,” in Proceedings of the 27th International Tech- nical Meeting of the Satellite Division of The Institute of Navigation, 201–2210, 2014.
- Z. Chen, H. Zou, J. Yang, H. Jiang, L. Xie, “WiFi Fingerprinting Indoor Lo- calization Using Local Feature-Based Deep LSTM,” IEEE Systems Journal, 14(2), 3001–3010, 2020, doi:10.1109/JSYST.2019.2918678.
- G. M. Mendoza-Silva, P. Ricther, J. Torres-Sospedra, E. S. Lohan, J. Huerta, “Long-term WiFi fingerprinting dataset for research on robust indoor position- ing,” Data, 2018, doi:https://doi.org/10.3390/data3010003.
- Z. To´th, J. Tama´s, “Miskolc IIS hybrid IPS: Dataset for hybrid indoor position- ing,” in 2016 26th International Conference Radioelektronika (RADIOELEK- TRONIKA), 408–412, 2016, doi:10.1109/RADIOELEK.2016.7477348.
- R. Montoliu, E. Sansano, J. Torres-Sospedra, O. Belmonte, “IndoorLoc plat- form: A public repository for comparing and evaluating indoor positioning systems,” in 2017 International Conference on Indoor Positioning and Indoor Navigation (IPIN), 1–8, 2017, doi:10.1109/IPIN.2017.8115940.
- Y. Chapre, P. Mohapatra, S. Jha, A. Seneviratne, “Received signal strength indicator and its analysis in a typical WLAN system (short paper),” in 38th Annual IEEE Conference on Local Computer Networks, 304–307, 2013, doi: 10.1109/LCN.2013.6761255.
- H. Hsieh, S. W. Prakosa, J. Leu, “Towards the mplementation of recurrent neural network schemes for WiFi fingerprint-based indoor positioning,” in 2018 IEEE 88th Vehicular Technology Conference (VTC-Fall), 1–5, 2018, doi:10.1109/VTCFall.2018.8690989.
- B. Wang, Q. Chen, L. T. Yang, H. Chao, “Indoor smartphone localization via fingerprint crowdsourcing: challenges and approaches,” IEEE Wireless Communications, 23(3), 82–89, 2016, doi:10.1109/MWC.2016.7498078.
- H.-H. Liu, “The quick radio fingerprint collection method for a WiFi-based indoor positioning system,” Mobile Networks and Applications, 61–71, 2017, doi:10.1007/s11036-015-0666-4.
- A. Khalajmehrabadi, N. Gatsis, D. Akopian, “Modern WLAN Fingerprinting Indoor Positioning Methods and Deployment Challenges,” IEEE Communica- tions Surveys Tutorials, 19(3), 1974–2002, 2017, doi:10.1109/COMST.2017. 2671454.
- X. Lin, T. Ho, C. Fang, Z. Yen, B. Yang, F. Lai, “A mobile indoor positioning system based on iBeacon technology,” in 2015 37th Annual International Con- ference of the IEEE Engineering in Medicine and Biology Society (EMBC), 4970–4973, 2015, doi:10.1109/EMBC.2015.7319507.
- M. Ture, A. Hatipoglu, “Indoor Location Finding of the Transmitter Based on Bluetooth Received Signal Strength,” in 2019 International Symposium on Networks, Computers and Communications (ISNCC), 1–5, 2019, doi: 10.1109/ISNCC.2019.8909095.
- J. Torres-Sospedra, R. Montoliu, A. Mart´inez-Uso´, J. P. Avariento, T. J. Arnau, M. Benedito-Bordonau, J. Huerta, “UJIIndoorLoc: A new multi-building and multi-floor database for WLAN fingerprint-based indoor localization problems,” in 2014 International Conference on Indoor Positioning and Indoor Navigation (IPIN), 261–270, 2014, doi:10.1109/IPIN.2014.7275492.
- J. Jang, S. Hong, “Indoor Localization with WiFi Fingerprinting Using Convolu- tional Neural Network,” in 2018 Tenth International Conference on Ubiquitous and Future Networks (ICUFN), 753–758, 2018, doi:10.1109/ICUFN.2018. 8436598.
- J. Li, Q. Li, N. Chen, Y. Wang, “Indoor Pedestrian Trajectory Detection with LSTM Network,” in 2017 IEEE International Conference on Compu- tational Science and Engineering (CSE) and IEEE International Conference on Embedded and Ubiquitous Computing (EUC), volume 1, 651–654, 2017, doi:10.1109/CSE-EUC.2017.122.
- F. Walch, C. Hazirbas, L. Leal-Taixe, T. Sattler, S. Hilsenbeck, D. Cremers, “Image-Based Localization Using LSTMs for Structured Feature Correlation,” in Proceedings of the IEEE International Conference on Computer Vision (ICCV), 2017.
- Z. Li, T. Braun, X. Zhao, Z. Zhao, F. Hu, H. Liang, “A Narrow-Band Indoor Positioning System by Fusing Time and Received Signal Strength via Ensem- ble Learning,” IEEE Access, 6, 9936–9950, 2018, doi:10.1109/ACCESS.2018. 2794337.
- D. Taniuchi, T. Maekawa, “Robust Wi-Fi based indoor positioning with en- semble learning,” in 2014 IEEE 10th International Conference on Wireless and Mobile Computing, Networking and Communications (WiMob), 592–597, 2014, doi:10.1109/WiMOB.2014.6962230.
- A. K. Abed, H. Al-Moukhles, I. Abdel-Qader, “An adaptive K-NN based on multiple services set identifiers for indoor positioning system with an en- semble approach,” in 2018 IEEE 8th Annual Computing and Communication Workshop and Conference (CCWC), 26–32, 2018, doi:10.1109/CCWC.2018. 8301667.
- J. Torres-Sospedra, G. M. Mendoza-Silva, R. Montoliu, O. Belmonte, F. Ben- itez, J. Huerta, “Ensembles of indoor positioning systems based on fingerprint- ing: Simplifying parameter selection and obtaining robust systems,” in 2016 International Conference on Indoor Positioning and Indoor Navigation (IPIN), 1–8, 2016, doi:10.1109/IPIN.2016.7743679.
- I. Ashraf, S. Hur, S. Park, Y. Park, “Deep-Locate: Smartphone based indoor localization with a deep neural network ensemble classifier,” sensors, 20, 133, 2019, doi:10.3390/s20010133.
- T. Hayashi, D. Taniuchi, J. Korpela, T. Maekawa, “Spatial-temporal adap- tive indoor positioning using an ensemble approach,” Pevasive and Mobile Computing, 41, 319–332, 2017, doi:10.1016/j.pmcj.2016.12.001.
Citations by Dimensions
Citations by PlumX
Google Scholar
Scopus
Crossref Citations
- Hang Duong, Mạnh Kha Hoàng, Anh Vũ Trịnh, Trang Phạm Thị Quỳnh, "Giải pháp định vị trong nhà độ chính xác cao sử dụng thuật toán kNN và LSTM." Journal of Military Science and Technology, vol. 86, no. , pp. 48, 2023.
No. of Downloads Per Month
No. of Downloads Per Country