Predicting Student Academic Performance Using Data Mining Techniques

Adv. Sci. Technol. Eng. Syst. J. 6(1), 153–163 (2021);
 DOI: 10.25046/aj060117
There is a crisis in basic education during this pandemic which affected everyone worldwide, we see that teaching and learning have gone online which has effected student performance. Student’s academic performance needs to be predicted to help an instructor identify struggling students more easily and giving teachers a proactive chance to come up with supplementary resources to learners to improve their chances of increasing their grades. Data is collected on KAGGLE and the study is focusing on student’s engagement, how often they check their announcements, number of raised hands, number of accessed forum and number of accessed resources to predict student academic performance. Various ma- chine learning models such as Support vector machine, Decision tree, Perceptron classifier, Logistic regression and Random forest classifier is used. From the results, it was proven that Support vector machine algorithm is most appropriate for predicting student academic performance. Support vector machine gives 70.8% prediction which is relatively higher than other algorithms.
1. Introduction
Student performance prediction is a crucial job due to the large volume of data in educational databases. A lot of data has become available describing student’s online behaviour and student engagement [1]. Online data has been used by a great number of researchers. Online learning and teaching is making a significant impact on the fabric of basic education.
Predicting the performance of a student is a great concern to the basic education management. The scope of this paper is to identify the factors influencing the performance of students in different grades and to find out the best machine learning model to predicting student academic performance and helps to identify students with poor grades and then be evaluated and provided with new materials and methods to improve their results.
There is a crisis in basic education during this pandemic which affected everyone worldwide, we see that teaching and learning have gone online which has effected student performance/grades. Parents are now supposed to sign whether their children must attend traditional class or online classes due to this pandemic. Online learning platforms is used to track student performance, provides unlimited access to online materials, organises online content in one location though many things that need to be learned do not add themselves to online learning. Many courses require the acquisition of soft skills, which cannot be easily learned or tested online.
They have been many attempts on predicting student academic performance using data collected from students activity logs and student demographic information. They have used several of data mining techniques. Decision trees were primarily used to find the predictor variables to the predicted variable and shows the targeted discrete value [2, 3]. Logistic Regression- was used to describe data and describe the relationship among the variables and Random forest was primarily used to maintain accuracy between the variable [4]–[5].
This research aim to predict student performance from data collected on student’s activity logs on an online learning and student’s demographic information. We want to find the accuracy of some classification models for predicting student academic performance. The major objectives of this study are:
- Finding the best classification model on student data set.
- Predict student academic performance using student’s demographically data and student’s online logging’s data.
We would like to find out, does the online engagement have an influence on physical engagement? Does the parent association with the learners improve the learner’s engagement?.
This study will be using various Machine Learning methods to predict student’s academic performance. Five popular classification methods (Support vector machines, Decision trees and Perceptron classification, Logistic regression and Random forest) are built and compared to each other making use of their predictive accuracy on the given data samples to predict student academic performance. Data is collected on KAGGLE and we will be focusing on student’s engagement, how often they check their announcements, number of raised hands, number of accessed forum and number of accessed resources to predict student success. The process of predicting student performance using online logging’s data is performed using various data mining techniques. [6, 7].
This study proposes the following assumptions:
- Every student must have undergone some training on how to utilise online learning platform to predict correct results.
- Every student have an equal chance of receiving all course materials.
- If a student fails to submit an assessment or attend any forums it assumes the student has obtained 0% in that particular assessment.
2. Related Work
This chapter provides an overview of previous research on predicting student academic performance. This section illustrates other similar work-related to predicting student academic performance.
2.1 Data
Several researchers have used machine learning algorithms in predicting student’s academic performance. 323 students doing undergraduate who enrol in dynamics in 4 consecutive semesters: in semester one there were 128 students, in semester two there were 58 students, in semester three there were 53 students and semester four there were 84 students [8]. Other authors have used undergraduate student’s information from four different sources which included student’s demographic data, course resources data, forums data and Sakai’s grade book data [4].
Other authors have used electronic data from the universities to improve the quality of educational processes. They studied using machine learning techniques to study the performance of undergraduate students [9]. We also learnt that other researchers have conducted their study about the student academic performance in high schools and in Iran for bachelor degree students. They analysed data of 1100 learners where 500 where the high school students and 600 was that of the bachelor degree level [10].
2.2 Features
Several researchers have used student’s demographic information and student online loggings data to predict student academic performance. The authors have done predictions for 4 class, 3 class and 2 class. The authors applied oversampling in other to balance the dataset and also used 3 different machine learning classifiers to predict student academic performance [8].
Several researchers collected data from student materials, assignments, tests, forums, and discussions on the online learning platform database to predict student success. Some researchers predicted student academic performance and they collected data from total login frequency on the system and a total number of attended forums [4].
2.3 Model
Various machine learning methods have been used by several researchers to predict student academic performance using student’s demographic information and student online logging’s data. Two machine learning algorithms were used which are Bayesian networks and Decision trees. The Decision trees was more accurate than Bayesian network by 3-12% [8].
Other authors have used C4.5 decision trees, Naïve bayes classifier, Random forests, neural networks and Meta-classifiers. After the analysis they found that C4.5 decision trees performed better [9]. The analysis shows that parent educational level, past examination results and gender has an impact on the presentation [11].
They also used decision trees and clustering data mining algorithms. They focused upon two type of student performance. They first predicted student academic performance at the end of the study programme [12]. Later predicted the student progressions and add them with the predicted results. The results shows good and bad performance of students and assists with identifying struggling students and giving teachers a proactive chance to come up with supplementary measures to improve their chances of passing. The decision trees gave out the best results [4].
3. Research Contribution
This study contributes to the current body on literature by predicting student academic performance and helps to identify students with poor grades can then be evaluated and provided with new materials and methods to improve their grades. Predicting students performance allow an instructor to spot non-engagement students based on their actions and activities from online learning platform. It also assists with identifying struggling students and giving teachers a proactive chance to come up with supplementary measures to improve their chances of passing during the course of their study programme.
From the literature that was reviewed various machine learning methods have been used by several researchers to predict student academic performance, they predicted student academic performance at the end of the study programme and they were unable able to detect which students may need immediate attention so that they lower the chances of them failing.
Table 1: Related Works.
|
4. Research Methodology
This chapter presents the methods that is proposed in this study to predict performance of students using student’s demographical information and student’s online logging’s data.
4.1 Research design
Based on the literature the study proposed using data mining techniques to find whether the total spent time on online learning affect the student’s performance and how have learning management system features affect the student performance.
4.2 Data description:
The data set consists a total of 480 records and 16 features. We found that there are 3 major categories of features: first being student demographic information such as student nationality and student gender. Secondly being student academic information such as student grade, student section and student educational stage. Thirdly being student behavioural information such as number of access resources, number of raised hands in class and school satisfaction.
The data set consists a total of 305 males and 175 females where
179 are from Kuwait, 28 are from Palestine, 172 are from Jordan, 22 are from Iraq, 17 are from Lebanon, 12 are from Tunis, 11 are from Saudi Arabia, 9 are from Egypt, 6 are from USA, 7 are from Syria, 6 are from Iran, 6 are from Libya, 4 are from Morocco and 1 is from Venezuela.
The data set is collected in two academic semesters, on first semester they were 245 student records and 235 student records on semester two.
The data set also covers the features of the school attendance days. There are two categories based on their number of absence days. We found that there were 289 students their absence days were under 7 days and 191 students were absent for more than 7 days.
Finally, the data set also contains parent’s participation on their children academic process. There are two categories: first being the parent answering survey and secondly being parent school satisfaction. We found that 270 parents managed to answer the survey and 210 parents did not answer the survey. We also found that 292 parents are happy and satisfied with the school and 188 parents are not satisfied.
4.3 Classification field
There are three numerical intervals of student grades. The first interval is for students who obtained a failing percentage (L), the interval includes values from 0% to 69%. The second interval is for students who obtained low passing percentage (M), the interval includes values from 70% to 89%. Lastly is for students who got high passing percentage (H), the interval includes values from 90% to 100%.
4.4 Methods
Predictive Models: Five popular classification methods (Decision trees and Perceptron classification and Support vector machines, Logistic regression and Random forest) are built and compared to each other making use of their predictive accuracy on the given data samples. Brief description of the predictive models that will be used in this study.
Support Vector Machines: Support vector machines (SVMs) [13] helps in detecting the outliers on the data set and it also perform classification. SVMs are set of supervised learning methods. SVMs used kernel trick to modify data and use the modified data to find the difference between the possible end results. SVM finds the optimal solution by computing on each feature by using partial differentiation after employing the Lagrange multiplier [14]. The model decreases convolution of the training data consequential subset of support vectors.
Table 2: This table depicts the student related variables and their description.
|
Given a data set containing a training set of N data points,
{xk,yk}kN=1 and input data, which is an n-dimensional data vector (x_kR∧N) and output, which is the one-dimensional vector space where αk are positive real constants and b is a real constant.
Decision trees (DTs): In this study Decision trees is used to find the predictor variables to the predicted variable and shows the targeted discrete value. “Decision trees uses variable values to create a structure that has nodes and edges” [15]. A DT has internal nodes and leaves, rectangles represents nodes and ovals represents leaves. Data set features are represented by the internal node and it contain two or more child. The value of these features is found at the branches. Each leaf contains a classification label [16].
Decision trees are established from a training set. A tree is called the hierarchy and a node is called segment. The entire data set is contained at the original segment called the node of the tree. The branches are formed by the node with its successors that created it and the leaves are final nodes. The decision is made on each leaf and it is applied to all the observations in the leaf. The decision is the predicted value.
Perceptron classification: The Perceptron classifier [17] is a set of supervised learning, the classification field of a sample can be predicted using Perceptron classifier. Perceptron classifier accept numerous input and if the number of inputs is more than the specified condition, it does not return the output, it output the massage for corrections. In the Perceptron algorithm features on the data set are taken as inputs and it is represented by x1, x2, x3, x4,…,xn where features value is indicated by x and the total occurrences is represented by n.
The required features to be trained is stored as input in the first layer. Now the total inputs and weights will be multiplied and add their outcome. The weights are the values obtained through the training of the model and are denoted by w1, w2, w3,..,wn. The output function will be shifted by the bias value and this value will later be presented to the activation function then the output value is obtained after receiving the value on the last step.
Logistic regression (LR): Logistic regression describe the association among variables and it was used to predict student academic performance by estimating the probability of an event occurring [18]. It also shows the probability of two categories by fitting the explanatory variables and log odds to model using this equation.
log() = β0 + β1X1+,…,βNXN
where Y=(0,1) is the binary variable; 1 if it is higher than the reference level and 0 if not, X = (X1,…., Xn) are n explanatory variables and β = (β0,….βn) are the estimated regression coefficient.
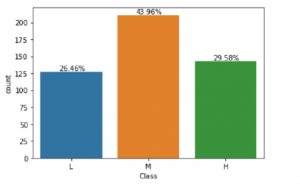
Figure 1: This figure depicts the proportion of student academic performance of the classification field.
Random forest (RF): Random forest uses begging method to generate trees in which its prediction is more accurate than that of any individual tree [19]. Random forest was also used to avoid over fitting on the training set and limiting errors due to bias hence yield accurate and useful results. RF can handle outliers and noise in the data and gains high classification accuracy. RF generate numerous decision trees in the training phase and output class labels [20]. RF is used in this study since it is permissible to less over-fitting and it has proofed to be good classification results previously.
RF is a theoretical framework grounded on mixture of decision trees; {T1X,…,TBX}. The ensemble produces B outputs {Yˇ1 = T1(X),…,YˇB = TB(X), where Yˇb,b = 1,…, B is the predicted grades by the bth tree. Output of all trees are aggregated to produce one final prediction Yˇ, which is the class predicted by majority of trees.
4.5 Analysis
The data set consist a total of 480 records. Machine learning algorithms are applied to predict student academic performance and we found that Support vector machine algorithm is best suited to predict student academic performance. We achieve a total accuracy of 70.8% which shows the potential accuracy of Support Vector Machine technique, followed by Random forest with 69.7% accuracy, Logistic regression with 67.7% accuracy, Perceptron with 64.5% and lastly Decision tree with 46.8%.
5. Results and Discussion
5.1 Pre-processing
Typically in machine learning before processing and running a test on a data set, it is necessary to prepare the data and select the targeted attribute. Selecting attributes requires putting all the matching combination of attributes in the data set in order to find which combination is suitable in predicting student academic performance.
Our goal with pre-processing was to change our numerical fields that have a value like Grade ID to a numerical only value in a way that we preserve that distance in a meaningful way. We also assign our three classes to numerical outcomes with a preserved distance and set setting L = -1, M = 0, and H = 1. We chose to preserve the distance between the categorical values and scale our numerical fields so that they would be more meaningful when compared together.
The five machine learning models are used to evaluate the student’s academic performance and to check which model best predict student performance.
5.2 Data visualisation
The data set consist a total of 480 records. In this study, the purpose of selecting an attributes was to find the attributes that contain numerical data, attributes that contain categorical data and classification label. Our goal with data visualisation is to get an idea of the shape of the data set and to see if we can easily identify any possible outliers and also look to see if any of data is unclear or redundant.
5.3 Summary of results
In the previous section, student academic performance was discussed and how it will be evaluated. In this section we discuss the performance of five machine learning models that was specified in section 4. First of all, we performed data visualisation after performing data pre-processing by generating simple plots of data distributions to get an idea of the shape of the data set and then 5 main machine learning techniques was evaluated and also describe the variables contained on the data set. The evaluation was done on the full data set that consist of 480 features [21].
From the results, it was proven that Support vector machine algorithm is most suitable in predicting the performance of students. SVM is relative higher than other algorithms and it has 70.8% prediction accuracy, followed by Random forest with 69.7% accuracy, Logistic regression with 67.7% accuracy, Perceptron with 64.5% and lastly Decision tree with 46.8%. We found the overall percentage of passing rate using class variable. There were 26.46% students who got a failing percent (less than 69%), 43.96% students who got a low passing grades (between 70% and 89%) and 29.58% who achieved high marks in their course (90% to 100%).
Student absence days seems to have a strong correlation with class variable. Very few students who missed more than 7 days managed to achieve high marks and very few students who missed less than 7 days failed their course. From grade 2 to grade 12 we found that grade 5, 9, and grade 10 have very few counts. No 5th grade students pass and no 9th grade students achieve high marks.
In figure 4, the bar plot shows the accuracy of five popular
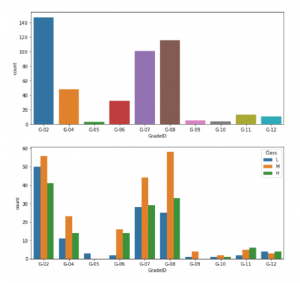
Figure 2: This figure depicts the grade the student is in and it also shows the average student performance for each grade.
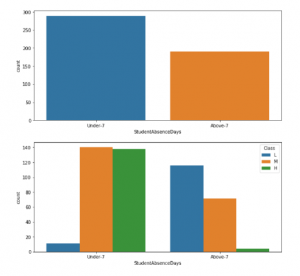
Figure 3: This figure depicts the proportion of student absence days and it also shows whether or not a student was absent for more than 7 days.
Table 3: This table shows the confusion matrices that describe the performance of the classification models.
| Support vector machine | |||
| Actual Values | Predicted Values | ||
| High | Low | Medium | |
| High | 23 | 1 | 11 |
| Low | 0 | 19 | 3 |
| Medium | 5 | 8 | 26 |
| Decision tree | |||
| Actual Values | Predicted Values | ||
| High | Low | Medium | |
| High) | 20 | 1 | 14 |
| Low | 1 | 15 | 6 |
| Medium | 7 | 8 | 24 |
| Perceptron | |||
| Actual Values | Predicted Values | ||
| High | Low | Medium | |
| High | 8 | 4 | 25 |
| Low | 0 | 21 | 1 |
| Medium | 2 | 19 | 18 |
| logistic regression | |||
| Actual Values | Predicted Values | ||
| High | Low | Medium | |
| High | 8 | 4 | 25 |
| Low | 0 | 21 | 1 |
| Medium | 2 | 19 | 18 |
| Random Forest | |||
| Actual Values | Predicted Values | ||
| High | Low | Medium | |
| High | 22 | 1 | 12 |
| Low | 0 | 16 | 6 |
| Medium | 4 | 6 | 29 |
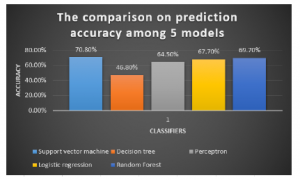
Figure 4: The comparison on prediction accuracy among 5 models.
Table 4: This table depicts the machine learning algorithms used in this study and their performance accuracy.
| Classifier | Accuracy |
| Support vector machine | 70.8% |
| Decision tree | 46.8 % |
| Perceptron | 64.5% |
| Logistic regression | 67.7% |
| Random forest | 69.7% |
Table 5: This table depicts detailed accuracy of Logistic regression.
| Features | Weighted Average |
| Correctly classified Instances | 73.75% |
| Incorrectly classified Instances | 26.25% |
| Mean absolute error | 21.33% |
| Root mean squared error | 37.53% |
| Relative absolute error | 49.27% |
| Root relative squared error | 80.6% |
| Precision | 73.8% |
| Recall | 73.8% |
| F-Measure | 73.8% |
| Roc Area | 83.8% |
| Total number of Instances | 480 |
Table 6: This table depicts detailed accuracy of Perceptron.
| Features | Weighted Average |
| Correctly classified Instances | 79.37% |
| Incorrectly classified Instances | 20.62% |
| Mean absolute error | 14.88% |
| Root mean squared error | 34.59% |
| Relative absolute error | 34.36% |
| Root relative squared error | 74.35% |
| Precision | 79.3% |
| Recall | 79.4% |
| F-Measure | 79.3% |
| Roc Area | 89.3% |
| Total number of Instances | 480 |
Table 7: This table depicts detailed accuracy of Random Forest.
| Features | Weighted Average |
| Correctly classified Instances | 76.66% |
| Incorrectly classified Instances | 23.33% |
| Mean absolute error | 24.28% |
| Root mean squared error | 33.37% |
| Relative absolute error | 56.09% |
| Root relative squared error | 71.72% |
| Precision | 76.6% |
| Recall | 76.7% |
| F-Measure | 76.6% |
| Roc Area | 89.7% |
| Total number of Instances | 480 |
Table 8: This table depicts detailed accuracy of Decision tree.
| Features | Weighted Average |
| Correctly classified Instances | 72.70% |
| Incorrectly classified Instances | 27.29% |
| Mean absolute error | 29.53% |
| Root mean squared error | 37.18% |
| Relative absolute error | 68.19% |
| Root relative squared error | 79.92% |
| Precision | 72.8% |
| Recall | 72.7% |
| F-Measure | 72.7% |
| Roc Area | 84.2% |
| Total number of Instances | 480 |
Table 9: This table depicts detailed accuracy of Support Vector Machine.
| Features | Weighted Average |
| Correctly classified Instances | 78.75% |
| Incorrectly classified Instances | 21.25% |
| Mean absolute error | 27.22% |
| Root mean squared error | 35.22% |
| Relative absolute error | 62.87% |
| Root relative squared error | 75.71% |
| Precision | 78.8% |
| Recall | 78.8% |
| F-Measure | 78.7% |
| Roc Area | 86% |
| Total number of Instances | 480 |
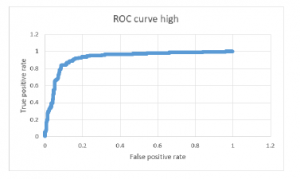
Figure 5: Receiver operating characteristic curve (class high).
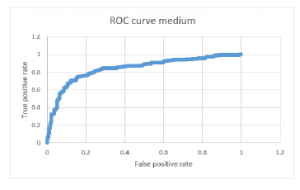
Figure 6: Receiver operating characteristic curve (class medium).
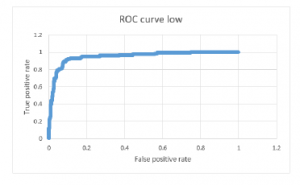
Figure 7: Receiver operating characteristic curve (class low).
machine learning models that is used to evaluate the student performance. The legend of the plot indicate that blue colour is Support vector machine, Yellow colour indicate Logistic regression, orange colour indicate Decision tree, light blue indicate Random forest and grey colour indicate Perceptron classifier.
Support vector machine has performed well when compared to other machine models. 78.75% instances was correctly classified and 21.25% instances was incorrectly classified. Another way of representing accuracy of the machine learning models that are in figure 4 is through confusion matrices. Table 3 describe how each algorithm has performed.
The graphical representation of receiver operating characteristic curve shows the performance of our best classification model, Support vector machine at all classification thresholds [22]. The ROC curve figure 5, figure 6 and figure 7 shows the classification performance of our best classifiers which is Support vector machine. There are three numerical intervals of student grades (low, medium and high). As can be seen from figure 5, figure 6 and figure 7. The ROC curve occupies the upper left corner, which means the classifier (SVM) used in this paper indicate a better performance and the prediction of positive value is specific in some degree, with AUC of 86%.
6. Conclusion and Future work
Companies and educational institutions uses learning management systems to create and manage lessons, courses, quizzes and other training materials [23]. Student’s success needs to be predicted to help an instructor identify academic performance and helps with identifying struggling students more easily and giving teachers a proactive chance to come up with supplementary resources to learners to improve their chances of increasing their grades. It may be difficult for students to learn virtually than in a traditional class hence the student’s performance vary due to difference methods of delivering the course materials [24].
Various machine learning models were used to predict student success using the learning management system. Each model indicate different percentage of accuracy when is tested with different features that are associated in an online learning platforms [25].
Student’s performance was evaluated by five machine learning techniques which is Perceptron classifier, Support vector machine and Decision trees, Logistic regression and Random forest. Support vector machine ends up handling the data the best with 70.8% accuracy. The obtained results shows that the student absence days influence student academic performance on the other hand student class grades is not influencing student academic performance.
We aim to extend the study by collecting more additional features such as encouraging and motivational strategies taken by facilitators and teachers and considering more materials available for students in an E-learning platforms. We will also consider features such as psychological factors available which affect student’s performance. We also intent to use more interesting and detailed data set to predict student academic performance in our future studies.
7. Acknowledgement
This work is based on the research supported in part by the National Research Foundation of South Africa (Grant number: 121835).
- M. D. Dixson, “Measuring student engagement in the online course: the Online Student Engagement scale (OSE).(Section II: Faculty Attitudes and Student Engagement)(Report),” Online Learning Journal (OLJ), 19(4), 143, 2015.
- S. Huang, N. Fang, “Predicting student academic performance in an engi- neering dynamics course: A comparison of four types of predictive math- ematical models,” Computers and Education, 61(1), 133–145, 2013, doi: 10.1016/j.compedu.2012.08.015.
- R. Ajoodha, R. Klein, B. Rosman, “Single-labelled music genre classifica- tion using content-based features,” in 2015 Pattern Recognition Association of South Africa and Robotics and Mechatronics International Conference (PRASA-RobMech), 66–71, IEEE, 2015.
- E. J. Lauría, J. D. Baron, M. Devireddy, V. Sundararaju, S. M. Jayaprakash, “Mining academic data to improve college student retention: An open source perspective,” in Proceedings of the 2nd International Conference on Learning Analytics and Knowledge, 139–142, 2012.
- R. Ajoodha, B. S. Rosman, “Learning the influence structure between partially observed stochastic processes using iot sensor data,” AAAI, 2018.
- K. F. Li, D. Rusk, F. Song, “Predicting student academic performance,” in 2013 Seventh International Conference on Complex, Intelligent, and Software Intensive Systems, 27–33, IEEE, 2013.
- R. Ajoodha, A. Jadhav, S. Dukhan, “Forecasting learner attrition for student success at a south african university,” in Conference of the South African Institute of Computer Scientists and Information Technologists 2020, 19–28, 2020.
- S. Huang, N. Fang, “Predicting student academic performance in an engineer- ing dynamics course: A comparison of four types of predictive mathematical models,” Computers & Education, 61, 133–145, 2013.
- R. J. Oskouei, M. Askari, “Predicting academic performance with applying data mining techniques (generalizing the results of two different case studies),” Computer Engineering and Applications Journal, 3(2), 79–88, 2014.
- R. Asif, A. Merceron, S. A. Ali, N. G. Haider, “Analyzing undergraduate stu- dents’ performance using educational data mining,” Computers & Education, 113, 177–194, 2017.
- Y. Gerhana, I. Fallah, W. Zulfikar, D. Maylawati, M. Ramdhani, “Comparison of naive Bayes classifier and C4. 5 algorithms in predicting student study period,” in Journal of Physics: Conference Series, volume 1280, 022022, IOP Publishing, 2019.
- Y. Salal, S. Abdullaev, M. Kumar, “Educational Data Mining: Student Perfor- mance Prediction in Academic,” IJ of Engineering and Advanced Tech, 8(4C), 54–59, 2019.
- S. Hua, Z. Sun, “Support vector machine approach for protein subcellular localization prediction,” Bioinformatics, 17(8), 721–728, 2001.
- I. Burman, S. Som, “Predicting students academic performance using sup- port vector machine,” in 2019 Amity International Conference on Artificial Intelligence (AICAI), 756–759, IEEE, 2019.
- F. Esposito, D. Malerba, G. Semeraro, J. Kay, “A comparative analysis of methods for pruning decision trees,” IEEE transactions on pattern analysis and machine intelligence, 19(5), 476–491, 1997.
- F. Jauhari, A. A. Supianto, “Building student’s performance decision tree clas- sifier using boosting algorithm,” Indonesian Journal of Electrical Engineering
and Computer Science, 14(3), 1298–1304, 2019. - B. Chaudhuri, U. Bhattacharya, “Efficient training and improved performance of multilayer perceptron in pattern classification,” Neurocomputing, 34(1-4), 11–27, 2000.
- D. W. Hosmer Jr, S. Lemeshow, R. X. Sturdivant, Applied logistic regression, volume 398, John Wiley & Sons, 2013.
- A. Liaw, M. Wiener, et al., “Classification and regression by randomForest,” R news, 2(3), 18–22, 2002.
- K. Deepika, N. Sathyanarayana, “Relief-F and Budget Tree Random Forest Based Feature Selection for Student Academic Performance Prediction,” Inter- national Journal of Intelligent Engineering and Systems, 12(1), 30–39, 2019.
- C. Sievert, Interactive Web-Based Data Visualization with R, plotly, and shiny, CRC Press, 2020.
- R. Kannan, V. Vasanthi, “Machine learning algorithms with ROC curve for predicting and diagnosing the heart disease,” in Soft Computing and Medical Bioinformatics, 63–72, Springer, 2019.
- C. Hodges, S. Moore, B. Lockee, T. Trust, A. Bond, “The difference between emergency remote teaching and online learning,” Educause Review, 27, 2020.
- H. M. Niemi, P. Kousa, et al., “A case study of students’ and teachers’ per- ceptions in a Finnish high school during the COVID pandemic,” International journal of technology in education and science., 2020.
- M. Hussain, W. Zhu, W. Zhang, S. M. R. Abidi, S. Ali, “Using machine learning to predict student difficulties from learning session data,” Artificial
Intelligence Review, 52(1), 381–407, 2019.