
Fusion of Optical and Microfabricated Eddy-Current Sensors for the Non-Destructive Detection of Grinding Burn
Volume 6, Issue 1, Page No 1414-1421, 2021
Author’s Name: Isman Khazi1,2, Andras Kovacs1, Ulrich Mescheder1,3,a), Ali Zahedi4, Bahman Azarhoushang4
View Affiliations
1Institute for Microsystems Technology (iMST), Faculty of Mechanical & Medical Engineering, Furtwangen University, 78120 Furtwangen, Germany
2Department of Microsystems Engineering (IMTEK), University of Freiburg, Georges-Köhler-Allee 103, 79110 Freiburg im Breisgau, Germany
3Faculty of Engineering, University of Freiburg, Georges-Köhler-Allee 103, 79110 Freiburg im Breisgau, Germany
4Institute of Precision Machining (KSF), Faculty of Mechanical & Medical Engineering, Furtwangen University, 78120 Furtwangen, Germany
a)Author to whom correspondence should be addressed. E-mail: mes@hs-furtwangen.de
Adv. Sci. Technol. Eng. Syst. J. 6(1), 1414-1421 (2021); ![]() DOI: 10.25046/aj0601160
DOI: 10.25046/aj0601160
Keywords: Cylindrical grinding process Grinding burn, Non-destructive testing (NDT), Sensor fusion, Optical sensor, Microfabricated microcoils, Eddy-current, Surface roughness, Surface reflection, 42CrMo4 steel

Export Citations
A sensor fusion concept integrating the optical and microfabricated eddy-current sensor for the non-destructive testing of the grinding burn is reported. For evaluation, reference grinding burn with varying degrees are fabricated on 42CrMo4 tool steel cylinder. The complementary sensing nature of the proposed sensors for the non-destructive testing of the grinding burn is successfully achieved, wherein both the superficial and an in-depth quantitative profile information of the grinding zone is recorded. The electrical output (voltage) of the optical sensor, which is sensitive to the optical surface quality, dropped only by 20 % for moderate degree of grinding burn and by ca. 50 % for stronger degree of grinding burn (i.e. by exclusively considering the superficial surface morphology of the grinding burn). Moreover, a direct correlation among the average surface roughness of the grinding burn, the degree of grinding burn and the optical sensor’s output voltage was observed. The superficial and in-depth information of the grinding burn was recorded using a microfabricated eddy-current sensor (planar microcoil with circular spiral geometry with 20 turns) by measuring the impedance change as function of the driving frequency. The depth of penetration of induced eddy-current in the used 42CrMo4 workpiece (with a sensor to workpiece distance of 700 µm) varied from 223 µm to 7 µm on increasing the frequency of the driving current from 1kHz to 10 MHz, respectively. A very interesting nature of the grinding burn was observed with two distinct zones within the grinding zone, namely, the superficial zone (starting from the workpiece surface to 15 µm in grinding zone) and a submerged zone (>15 µm within the grinding zone). The impedance of the microcoils changed by ca. 8 % and 4 % for the superficial and submerged zone for regions with stronger degree of grinding burn at a frequency of 10 MHz and 2.5MHz, respectively. Furthermore, a correlation between the microhardness of the grinding burn and the impedance change is also observed.
Received: 24 December 2020, Accepted: 05 February 2021, Published Online: 28 February 2021
1.Introduction
Grinding technology is considered as the strategic process in the manufacturing technology with its application spanning from the manufacturing of parts for aerospace, defense industry to the production of surfaces with optical quality for the electronics and telecommunications devices, with technology moving towards processing of also the hard ceramic materials [1]. The mechanics involved during the grinding process include the interaction between the grinding wheel with abrasive grains and the workpiece’s surface, wherein the material from the workpiece (WP) is removed in a complex manner governed by the interplay among the rubbing, cutting and ploughing stages of material abrasion. However, in case of grinding processes with high material removal rates involving hard steel workpieces, the operating temperatures during the grinding process might easily go beyond the tempering temperature of the WP when the grinding operating conditions are sub-optimal, and might result in an irreversible thermal damage on and within the grinding zone (i.e., the region of interaction between the grinding wheel and WP surface), which is usually referred to as the so-called grinding burn (GB) [1–4]. Among the several defects such as microcracks, pores etc., occurring within the grinding zone (GZ) due to sub-optimal grinding conditions, the occurrence of GB is the most complex defect to detect. The reason behind the complexity in the detection of GB is attributed to the nature of complex microstructural modifications that occur not only on the surface of GZ, but also a few hundred micrometers deep within the GZ [4–6]. As described in [1] and [7], the thermal damage caused by sub-optimal grinding conditions results in tensile residual stresses within the GZ. Moreover, it can lead to grain growth, precipitation, softening, phase transformations resulting in re-hardening, thermal expansion/contraction creating microcracks, and chemical reactions leading to discoloration, i.e., severe oxidation GB; all of which are not only detrimental to the quality of the WP (limiting the performance of the WP), but also lay an enormous financial burden on rejection of ground workpieces having GB [8].
In a recent review paper [2], the authors comprehensively summarized the different methods for detection of GB pre- and post-grinding process, out of which, they are broadly classified under destructive- and non-destructive testing (NDT) methods. Under destructive methods, the method of Nital etching revealing the microstructure of the GZ, and microhardness testing revealing the microstructural change as a function of the hardness profile of the GZ can be used. Furthermore, the optical inspection (with sophisticated CCD cameras and visual inspection), residual stress inspection using x-ray diffractometer (XRD), spectroscopic measurement of elemental study in the GZ, electromagnetic methods involving conventional eddy-current sensors, magnetoelastic methods involving the Barkhausen noise analysis and acoustic emission sensors can be used to detect the occurrence of GB on the ground WP post grinding process [2]. Few of the reported methods like XRD and spectroscopy cannot be integrated in the grinding machine, while the others such as electromagnetic and acoustic emission sensors still rely on the conventional sensor systems; wherein, on one side the system is quite bulky (which hinders its integration within the grinding machine), and on the other side the detection resolution is limited due to the size of the conventional probes used.
Furthermore, since the past two decades there have been a constant quest to realize realistic intelligent grinding manufacturing processes, which has further gained momentum in terms of research and development, owing to the emergence of industry 4.0 and big data with the concept of smart interconnected real-time condition monitored manufacturing processes [8–14]. However, among other challenges associated with the implementation of the intelligent grinding process, the availability of sophisticated approaches for the integrated process monitoring (i.e., the sensor systems), considering the difficulty to model process dynamics of grinding processes, is a fundamental requirement for the development of intelligent grinding. In order to fulfill this requirement, a sensor fusion system comprising of more than one sensing principle would enormously increase the detection capability, the sensitivity of the parameters of interest, and also the reliability of the test results. The authors in [15] reported a sensor fusion concept with integration of accelerometers and power-cell sensors for the detection of the roughness of the WP, however, the reported system is not capable of detecting GB. Therefore, in this paper, which is an extended version of a previous research [16], we report the detailed analysis of the sensor fusion concept with the integration of an optical sensor (OS) and a microfabricated eddy-current sensor (µEC) working complementary to each other for NDT of GB using a 42CrMo4 cylinder with varying degrees of reference GB. The proof-of-concept for the NDT of GB using the OS and µEC sensors has been already reported along with the individual development and characterization in [17–19], therefore, this paper deals with the experimental analysis of the complementary sensor functionality of combined OS and µEC sensors for NDT of GB.
2. Sensor fusion concept for non-destructive testing of grinding burn
The occurrence of the GB results in hard to model modifications on and within the GZ of the ground WP. Depending on the severity of the GB, it can get explicitly visible by discoloration (i.e., so-called severe oxidizing GB) on the surface of the GZ (as shown in the schematic in Figure 1 with orange coloration of the ground WP surface), or during the concluding spark-out period of grinding process, however, the discolored oxidized layer might be removed. In this case, the irreversible microstructural changes withing the GZ, which can propagate up to a few hundred micrometers within the GZ, still exist (depicted as hidden GB in Figure 1). Furthermore, the microstructural changes can result in either softening of the GZ or might result in a re-hardened layer (due to quenching effect) on top of the softened layer [4–6]. Therefore, the proposed sensor fusion system in this paper combines two sensor principles, namely the OS and µEC sensors (as shown in schematic in Figure 1) capable of detecting the surface morphological changes and the in-depth microstructural changes (as function of varying driving frequency which influences the depth of penetration of the induced eddy-currents within the WP), respectively. An interesting effect of the surface morphological changes on the GZ surface was shown in our previous paper [17], wherein it was found that the reference GB with varying degrees showed a direct correlation to the average surface roughness values (Ra) of the ground WP surface. The average surface roughness increased with increasing degree of GB. The proposed OS works on the principle of illuminating the WP
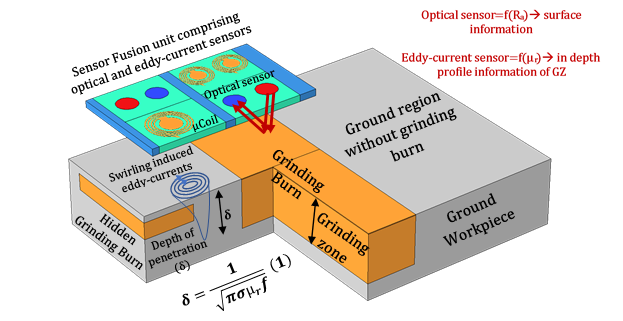 Figure 1: Schematic showing the sensor fusion concept integrating the optical sensor and the microfabricated eddy-current sensor for the NDT of GB. The optical sensor detects the superficial surface modifications for e.g., the change in Ra as function of GB, and the microfabricated eddy-current sensors records the in-depth profile information within the GZ (i.e. by varying the driving frequency). Therefore, making it possible to even detect the so-called hidden and severe degree of GB resulting in significant microstructural changes in the GB.
surface and recording the reflected light, which is transduced into sensor output voltage (detailed explanation of the sensor electronics can be found in [17]). The voltage drop (ΔV) increased with an increase in Ra, which in turn increased with the degree of GB [17].
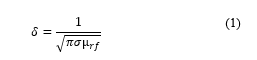
Among several applications exploiting the use of eddy-currents such as contact-less breaks in this work, µEC sensors are used for the NDT of microstructural modification within the GZ (i.e., an in-depth profile information of GZ). The microfabrication steps are described in [16, 18]and the characterization of the µEC sensors for NDT of GB is shown in [18, 19]. The µEC sensors exploit the fact of the predominant change in the relative permeability within the GZ in case of WP out of hardened ferromagnetic steels, which are inevitably reliant on the grinding technology for many precision applications [3]. As shown in Figure 1, swirling eddy-currents are induced on and within the conductive WP, when it is in the vicinity of the µEC sensors, whose depth of penetration as shown in the Equation 1 depends on frequency of the driving current, the conductivity (σ) and .
 Furthermore, in case of occurrence of GB, the microstructural changes within GZ affects the nature of the induced eddy-current in WP [20], which is then recorded either as the impedance change (ΔZ) in case of single µEC sensor (absolute sensor) or the voltage change in case of sender-receiver µEC sensor combination. The main advantage of the use of µEC sensors is the possibility of varying of the induced eddy-current by varying , wherein is inversely proportional to . Therefore, by varying of the µEC sensors, the depth profile within the GZ can be quantitively recorded and compared with the reference material profile. Thereby, making the µEC sensor suitable for the NDT of not only superficial GB, but also the so-called hidden GB within the GZ. Hence, with this proposed approach of sensor fusion concept, the NDT of GB can be enhanced for the quality testing of ground workpieces. Furthermore, the proposed fused sensor system can be integrated within the grinding machine to facilitate the in-process detection of GB and to increase the material removal efficiency.
3. Results and discussion
For the experimental characterization of the sensor fusion concept, reference GB with varying degrees were fabricated on 42CrMo4 steel cylinder as shown in Figure 2(a) (the grinding parameters and conditions are described in [16]). Each region named as S2-S8 in Figure 2(a) belongs to a different degree of GB, except region S3, which is considered as the reference ground region without GB as a calibration for the sensor measurements. Figure 2(b) shows the micrographs recorded using an optical microscope, wherein the discoloration i.e., the oxidative GB along with the undulation pattern corresponding to the abrasive grains in the grinding wheel can be seen. Furthermore, the surface morphology was further characterized using a white light
 Figure 2: (a) 42CrMo4 cylindrical workpiece ground with reference grinding burn with varying degrees from S2, S4-S8, wherein region S3 is the reference ground region without GB (Region S1 is original unground state of the workpiece), (b) micrographs recorded using an optical microscope for each individual region S2-S8 showing the undulating pattern corresponding to the abrasive grains of the grinding wheel along with the dark discoloration corresponding to the oxidative grinding burn.
 Figure 3: Surface morphology micrographs recorded using a white light interferometer (Zygo Newview) with 50x magnification resulting in a scan area of 188 µm x 140 µm. The average surface roughness values are shown in the top right corner of each micrograph.
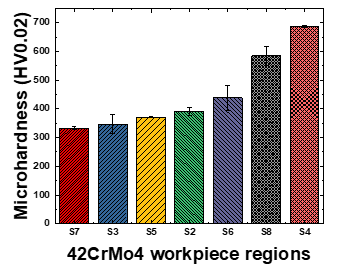 Figure 4: Measured Vickers microhardness on regions S2-S8 on the reference workpiece 42CrMo4 with varying degrees of GB. Each measurement is mean of 5 indentations on each region.
interferometer (Zygo Newview) in order to quantitatively compute the average surface roughness (Ra) values. Figure 3 shows the recorded surface topology micrographs using 50x objective within a scan area of 188 µm x 140 µm for the regions S2-S8 along with the computed Ra values (mean of 10 measurements). The Ra values varied from 281 nm to 483 nm for the reference region S3 and the strongest GB region S4, respectively. This observation can be attributed to the surface morphological modifications occurring on the surface of GZ with the occurrence of GB, which appear not only in the form of discoloration i.e., oxidation GB, but also results in the modification of the surface topology.
 Figure 5: Normalized optical sensor output voltage experimentally measured as a function of varying degrees of GB on regions S2-S8, with a sensor to workpiece distance of 700 µm under quasi-static conditions.
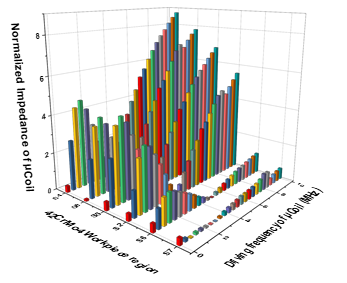 Figure 6: Normalized impedance of 20 turns circular spiral geometry µcoil experimentally measured as a function of varying degree of GB on regions S2, S4-S8, with a µcoil to workpiece distance of 700 µm under quasi-static measurements (the measurements from region S3 are considered as reference). Moreover, considering the microstructural modifications as a consequence of GB, which might either soften or re-harden the GZ, the microhardness of each region S2-S8 was measured using Vickers Microhardness device from Innovatest Falcon 501 device with a 20 g load. Furthermore, the indentation depth with the used 20 g load was 1 µm to 2 µm, for the measured microhardness range, and hence the measured microhardness values are more superficial in nature. Figure 4 shows the computed microhardness values (mean of 5 measurements) for the regions S2-S8. The microhardness increased from 333 HV0.02 for region S7 to 685 HV0.02 for region S4. This effect can be attributed to complex microstructural changes, which result in either softening, re-hardening and combination of re-hardened and softened profile within the GZ [6]. From Figure 4, it can be seen that ground region S7 shows the presence of softened layer with reduced microhardness compared to reference region S3, while all other regions showed a re-hardened layer with S8 and S4 showing an almost twofold increment in the microhardness compared to the reference region S3.
The experimental measurements using OS and the µEC sensor were done on a lathe machine to emulate the conditions within a grinding machine. The details of the experimental setup along with the information related to the optical sensor can be found in [17], and the microfabrication steps of µEC sensor with circular spiral geometry (20 turns µcoil used in this work) is reported in [18]. The distance between the sensors and WP was kept constant at 700 µm for all the measurements and the WP was rotated per hand for each new measurement; thereby, resulting in a quasi-static measurement. Figure 5 shows the normalized output voltage of the optical sensor as a function of varying degree of GB on the WP, by taking the voltage recorded from region S3 as reference value. The optical sensor takes into account the surface morphological changes, i.e., either the discoloration as a result of oxidation GB or the modified surface roughness profile on the GZ,
both of which would adversely affect the intensity of the reflected
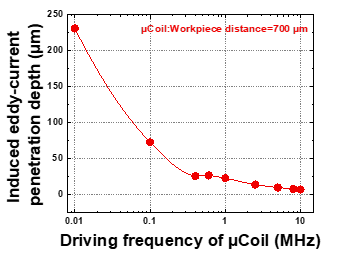 Figure 7: Theoretical computed depth of penetration of induced eddy-current within the 42CrMo4 workpiece at a µEC sensor to workpiece distance of 700 µm and considering the material properties as reported in [21].
light (i.e., in response to the incident light form the optical sensor), which is transduced into voltage by the OS. Therefore, the presence of the GB is detected as the function of voltage change (ΔVOS = (Vref – Vwp)/Vref) with respect to the reference voltage (Vref) from the reference region S3 and the voltage recorded from ground surface with GB (Vwp). As seen in Figure 5, the OS is capable for the NDT of GB, wherein the output voltage changes as a function of the different degree of GB on regions S2 and S4-S8. Furthermore, the recorded ΔVOS values are directly proportional to the Ra values, i.e., the higher the surface roughness, the larger are the ΔVOS values as shown in [17]. As seen in Figure 5, the ΔVOS values dropped by ca. 20 % and 50 % for the regions S5-S8 and regions S2 and S4, respectively. Thereby, depending on the intensity of drop in ΔVOS values, the GB can be roughly classified under moderate (i.e., for ΔVOS=20 %) and strong (i.e., for ΔVOS=50 %) degree of GB. Complementary to the OS measurements, the µEC measurements on the same WP were carried out under the similar working conditions as described above for OS measurements. However, in case of µEC sensors, the impedance response (Zwp) of the µEC sensor as function of the different regions S2-S8 was recorded. Similar to the OS measurements, Zwp for the region S3 was considered as the reference and the normalized impedance change (ΔZ = (Zref -Zwp)/Zref) for the regions S2, S4-S8 as a function of is computed and shown in Figure 6. Primary, the ability of the µEC sensors for the NDT of GB is observed for all the ground regions with varying degree of GB, and secondary, on contrary to the OS measurements, where only the surface morphological information was revealed, in case of the µEC sensors, an in-depth profile information is revealed as function of varying as seen in Figure 6. A very interesting trend of variation in ΔZ as function of is observed, wherein ΔZ initially increased on increasing from 1 kHz to 1.2 MHz and decreased further with increase however, it increased again from 4 MHz to 10 MHz (the limit of the used LCR meter was 10 MHz). This effect can be attributed to the microstructural changes occurring within the GZ few hundred micrometers deep in case of the occurrence of GB. At this point it comes to the complementary sensing nature and measurement capability of µEC sensors compared to the OS, where it can quantitatively record the microstructural variation in ΔZ as seen in Figure 6. This effect is because of the variation in δ for the induced eddy-currents as function of as shown in Equation 1. For e.g., Figure 7 shows the theoretical δ for the induced eddy-currents within the used WP (i.e., 42CrMo4, taking the material properties from [21]), wherein the induced eddy-current tends to be more superficial with increasing driving frequency, i.e., it decreased from 230 µm to ca. 7 µm on increasing the frequency from 0.01 MHz to 10 MHz.
 Figure 8: Comparison of sensor fusion concept using the OS and µEC sensors as function of the measured Vickers microhardness values (i.e. destructive approach) (a) normalized impedance of µEC sensor as function of measured Vickers microhardness for the reference GB regions on 42 CrMo4 for 4 MHz (δ = 11 µm) and 10 MHz (δ = 7.5 µm), and (b) normalized optical sensor voltage as function of measured Vickers microhardness values.
Therefore, from Figure 6 it is evident that the microstructural changes within the GZ consist of two zones, namely submerged (>15 µm within GZ) zone and superficial zone (i.e., near to the surface within <15 µm). Furthermore, the ΔZ values increased at higher , showing that GB caused severe microstructural changes in the superficial zone in case of ground regions S2, S4, S5 and S8. Additionally, the order of arrangement of the WP ground regions in Figure 6 is with respect to descending order in the ΔZ values (i.e., at higher ), is comparable with the measured microhardness as shown in Figure4. For e.g., the ground region S4 followed by the region S8 showed the maximum microhardness values and hence, a larger ΔZ variation was observed i.e., 8.7 % and 7.8 % at 10 MHz for S4 and S8, respectively, which is evident from Figure 6. Meanwhile, the region S7 showed minimum microhardness and hence, it also showed minimum variation in ΔZ values as seen in Figure 6. Another interesting observation can be noticed for region S6, wherein the ΔZ is larger in the submerged region as compared to the superficial region and an opposite trend is then recorded for region S7. Thereby, showing the complex in-depth nature of the occurrence of the GB. However, in respect to the very similar impedance dependence on frequency of regions S4 and S8, the OS provides a significant signal difference between these surfaces. Moreover, apart from the complementary information related to superficial and in-depth profile obtained using the combination of OS and µEC sensors, the comparison of both sensors merits for the superficial measurement as function of destructive approach i.e., the Vickers microhardness (Figure 4) is shown in Figure 8(a-b). Here, the measured microhardness HV is plotted on the x-axis considering HV as reference for microstructural changes by grinding related GB which is correlated to the µEC (Figure 8a) and OC (Figure 8b) measurements. For the used load of 20 gf an indentation depth of 1 µm – 2 µm is obtained for Vickers microhardness measurements. The normalized impedance ΔZ in Figure 8a is evaluated for 4 MHz (δ = 11 µm) at a frequency where a pronounced minimum in the normalized impedance is found (Figure 6) and for 10 MHz (δ = 7.5 µm) to reveal more the superficial information. It is found that ΔZ for f = 10 MHz initially increased as function of microhardness, however it decreased steeply within the microhardness range of 375 HV0.02 – 450 HV0.02, and subsequently increased as function of microhardness values. At 4 MHz, the minimum of ΔZ occurs at around 450 HV0.02 and the changes of ΔZ towards lower and higher microhardness values are less pronounced. The observed trend can be attributed to the complex microstructural changes occurring within the GZ. ΔVOS showed a different dependence on microhardness and therefore, can provide complementary information about GB compared to µEC especially in the range of 400 HV0.02 – 450 HV0.02. At higher microhardness values, ΔVOS showed a gradual decreasing trend as function of the microhardness values.
Therefore, the sensor fusion by integrating the OS and µEC sensors makes it possible the NDT of GB, by not only considering the surface morphological information on the GZ, but also by revealing the in-depth profile information up to few hundred micrometers within the GZ on occurrence of GB. The presented sensor fusion concept is preliminary approach towards the proof-of-concept for the complementary sensing nature for the NDT of GB. However, there is enough room for the further development and optimization to successfully integrate the developed sensor fusion unit in the grinding machine to realize and fulfill the quest towards the intelligent grinding process.
4. Conclusion
The sensor fusion concept integrating an optical sensor and a microfabricated eddy-current sensor is reported for the non-destructive testing of the grinding burn. The complementary sensing nature of the reported sensor combination results in not only the superficial non-destructive testing of grinding burn, but also an in-depth profile within the grinding zone. The optical sensor voltage dropped as function of varying degree of grinding burn, which was observed to be directly correlated to the average surface roughness of the grinding burn. The voltage dropped by 20 % for moderate degree of grinding burn, and by 50 % for strong degree of grinding burn. The in-depth quantitative profile of the microstructural changes within the grinding zone is recorded with the use of the microfabricated eddy-current sensors (circular spiral µcoils with 20 turns) as a function of the varying driving frequency. A very interesting nature of the grinding burn was observed as function of the impedance variation of the microcoils with two distinct zones, i.e., the sub-merged zone (>15 µm within grinding zone) and superficial zone (from WP surface to 15 µm within grinding zone). Impedance changes of ca. 8 % and 4 % were obtained for stronger degree of grinding burn (i.e., regions S4 and S8) for the superficial and sub-merged grinding burn at 10 MHz and 2.5 MHz, respectively. Utilizing the impedance information of the grinding zone as function of varying driving frequency, it could also be possible to build qualitatively the profile of the microstructural changes for quality testing, and hence ease the observation for the severity of the grinding burn. The reported sensor fusion concept can be further optimized to increase the detection sensitivity and robust packaging immune to the harsh environmental conditions occurring within the grinding machine to realize intelligent grinding processes and in-process monitoring capabilities corresponding to the requirements of industry 4.0. Furthermore, to model the surface morphology of grinding burn, an in-depth surface roughness analysis can be done (considering the parameters beyond root mean squared and average surface roughness values) to unveil the surface modifications at the atomistic level.
Conflict of Interest
The authors declare no conflict of interest.
Acknowledgment
The authors would like to thank the company ibg Prüfcomputer, Ebermannstadt, Germany, for providing the industrial support with their expertise and know-how for the conceptualization and development of the microfabricated eddy-current sensors for the non-destructive detection of the grinding burn. The authors would like to express their gratitude to the State Government of Baden-Württemberg, Germany, Landesbank Baden-Wuerttemberg in Germany and European Union for the financial support withing the framework of European Regional Development Fund (EFRE) and HAW-KMU (32-7545.20/27/57). The authors highly appreciate the student work done by Mr. Pranav Dhumal and Mr. Jerrine Jacob Mathews for the characterization of the optical sensor.
- W. B. Rowe, Principles of Modern Grinding Technology, 2nd edition Burlington: Elsevier Science, 2013.
- B. He, C. Wei, S. Ding, and Z. Shi, “A survey of methods for detecting metallic grinding burn,” Measurement, 134, 426–439, 2019, doi: 10.1016/j.measurement.2018.10.093.
- R. Ito, T. Azuma, T. Kasuga, S. Soma, S. Murakami, and T. Kuriyagawa, “Development of Non-Destructive Inspection System for Grinding Burn – An Application of the Grinding Burn Detecting Technique to Evaluate Residual Stress,” AMR, 797, 307–312, 2013, doi: 10.4028/www.scientific.net/AMR.797.307.
- M. W. Seidel, Schleifbrand und dessen Prüfung: Leitfaden für die Praxis. München: Hanser, Carl, 2020.
- M. W. Seidel, A. Zösch, and K. Härtel, “Grinding burn inspection,” Forschung im Ingenieurwesen, 82(3), 253–259, 2018, doi: 10.1007/s10010-018-0270-4.
- R. Ito, N. Mukaide, T. Azuma, S. Soma, S. Murakami, and T. Kuriyagawa, “Development of Non-Destructive Inspection System for Grinding Burn-in-Process Detection of Grinding Burn,” AMR, 1017, 135–140, 2014, doi: 10.4028/www.scientific.net/AMR.1017.135.
- A. Jeffrey Badger and Andrew Torrance, “Understanding the causes of grinding burn helps alleviate the problem,” Cutting Tool Engineering, 52(12), 1-3, 2000.
- T. Kaufmann, S. Sahay, P. Niemietz, D. Trauth, W. Maas, and T. Bergs, “AI-based Framework for Deep Learning Applications in Grinding,” in 2020 IEEE 18th World Symposium on Applied Machine Intelligence and Informatics (SAMI), Herlany, Slovakia, 195–200, 2020.
- L. Lv, Z. Deng, T. Liu, Z. Li, and W. Liu, “Intelligent technology in grinding process driven by data: A review,” Journal of Manufacturing Processes, 58, 1039–1051, 2020, doi: 10.1016/j.jmapro.2020.09.018.
- W. Guo, B. Li, and Q. Zhou, “An intelligent monitoring system of grinding wheel wear based on two-stage feature selection and Long Short-Term Memory network,” Proceedings of the Institution of Mechanical Engineers, Part B: Journal of Engineering Manufacture, 233(13), 2436–2446, 2019, doi: 10.1177/0954405419840556.
- H. B. Hübner, M. A. V. Duarte, and R. B. Da Silva, “Automatic grinding burn recognition based on time-frequency analysis and convolutional neural networks,” The International Journal of Advanced Manufacturing Technology, 110(7-8), 1833–1849, 2020, doi: 10.1007/s00170-020-05902-w.
- F. Junejo, “The Application of Artificial Intelligence in Grinding Operation using Sensor Fusion,” Geomate, 12(30), 2017, doi: 10.21660/2017.30.160503.
- L. Wang and R. X. Gao, Condition monitoring and control for intelligent manufacturing. London: Springer, 2006.
- F. Godoy Neto R., Marchi M., Martins C., R. Aguiar P. and Bianchi E, “Monitoring of Grinding Burn by AE and Vibration Signals,” in Proceedings of the 6th International Conference on Agents and Artificial Intelligence, 272–279, 2014.
- B. Botcha, V. Rajagopal, R. Babu N, and S. T. Bukkapatnam, “Process-machine interactions and a multi-sensor fusion approach to predict surface roughness in cylindrical plunge grinding process,” Procedia Manufacturing, 26, 700–711, 2018, doi: 10.1016/j.promfg.2018.07.080.
- I. Khazi, Andras Kovacs, Ali Zahedi, Christian Reser, Ulrich Mescheder, Bahman Azarhoushang and Christoph Reich, “Real time In-Situ Quality Monitoring of Grinding Process using Microtechnology based Sensor Fusion,” in 2020 IEEE International Conference on Semiconductor Electronics (ICSE), Kuala Lumpur, Malaysia, 180-184, 2020, doi: 10.1109/ICSE49846.2020.9166898
- A. Kovacs, I. Khazi, A. Zahedi, U. Mescheder and B. Azarhoushang, “Development of an Optical Sensor for the Non-Destructive Testing of Grinding Burn,” in 2020 IEEE SENSORS, Rotterdam, Netherlands, 1-4, 2020. doi: 10.1109/SENSORS47125.2020.9278837
- Isman Khazi, Andras Kovacs, Vaibhav Kumar, Pranav Dhumal, Ulrich Mescheder, “Microfabricated 2D planar eddy-current microcoils for the non-destructive testing of grinding burn marks,” Nondestructive Testing and Diagnostics, 3, 29–35, 2019, doi: 10.26357/BNiD.2019.012
- I. Khazi, A. Kovacs, A. Zahedi, U. Mescheder and B. Azarhoushang, “Microfabricated Eddy-Current Sensors for Non-Destructive Testing of the Micro Grinding Burn,” 2020 IEEE SENSORS, Rotterdam, Netherlands, 1-4, 2020, doi: 10.1109/SENSORS47125.2020.9278595
- N. Bowler, Eddy-Current Nondestructive Evaluation. New York, NY: Springer New York, 2019.
- T. Bulin, E. Svabenska, M. Hapla, P. Roupcova, C. Ondrusek, and O. Schneeweiss, “Magnetic properties of 42CrMo4 steel,” IOP Conference Series: Materials Science and Engineering, 179, 1-6, 2017, doi: 10.1088/1757-899X/179/1/012010.