Texture Based Image Retrieval Using Semivariogram and Various Distance Measures

Adv. Sci. Technol. Eng. Syst. J. 6(1), 1369–1377 (2021);
 DOI: 10.25046/aj0601156
In a content-based image retrieval system(CBIR) feature classification,identification, and ex- traction play an important role. The retrieval of images using a single feature is a challenging task in CBIR systems. The high retrieval rates are reported based on combining multiple features, multiple algorithms and preprocessing steps, feature classification, and segmentation because the image retrieval are mainly based on the content in an image. This paper presents a texture feature extraction for the image retrieval system from semivariogram and robust semivariogram technique. A semivariogram is a statistical approach that provides the textural information based on the lag distance ’h’.The proposed method is tested on various standard image databases such as Corel-1k, Corel-10k, and Coil-100 database. The semivariogram and robust semivariogram methods are tested for the Corel 1k database using four distance metrics i.e. Euclidean, Manhatten, Canberra, and Chord distance to check which distance measure is appropriate for the CBIR system. The proposed method is also tested on three types of databases to investigate the performance of the CBIR system. The Matlab simulation results show that the e clidean distance.
1. Introduction
The capturing of an image is started back in the past one and half a century, and the collection of images is rapidly growing from the past thirty years of growing digital technology and internet usage. The collection of images is also increasing leading to a extremely large database. In many applications, the extraction of equivalent images from the large database is essential and useful. There are two trends currently using the image search from the image collection data set namely text-based and content-based. The text-based search uses meta-data like keywords, description of the image to get back the similar images. It is the main disadvantage of this system. In contrast content based uses existing property (color, texture, and shape) to find the equivalent images from the large database. This paper is an extension of work originally presented in conference [1].
Many researchers have come up with the idea of combining basic image features to get the most comparable images as required by the query image. The color and texture feature is taken together to get the image information by applying wavelet [2]. The wavelet transform decomposes the images into orthogonal components for the better localization of the spatial information in an image. The method applied to extract color and texture information is a color histogram and wavelets respectively. .
It is noticeable that based on these work the retrieval rates are improved by combining multiple features, multiple algorithms and preprocessing steps, classification, segmentation, etc. In this work, a good CBIR system is designed by using the texture feature. In an image retrieval system all the three features color, texture, and shape play an important role [3]. Texture identification is an important part of the research in image retrieval and pattern recognition. It is categorized into two classes i.e. regular and irregular, directional, and non-directional based on the observations of real life. In general, the texture is characterized as two main approaches: Statistical and Structural.
1)Structural approach: the texture analysis is done based on the arrangement of preserving texture pixel in some pattern or repetitive pixel. 2) Statistical approach: The texture feature can be analyzed by studying numerical data of the image. It provides the relative estimation of the arrangements of the intensities in an image region [4]. The most commonly used and widely accepted statistical approach for texture, classification is the GLCM method [5]. The recently developed method for the texture classification and analysis includes block truncation coding [6], Markov random fields [7] to construct the image patches using neighboring pixel, local energy histogram [8], hidden Markov model [9], shearlets and linear regression [10]. Many of the texture algorithms and methods have been applied to the Brodatz database.
In this paper, geostatistical parameter called semivariogram and robust semivariogram are applied to the image to get the texture information to the image databases. The semivariogram method is basically applied to remote sensing images to characterize the texture property. It is a distance metric that calculates the absolute differences between the semivariogram of the two images to determine the class of test images. The various distance measures are used to verify the effective retrieval of images.
1.1 Motivation
The main idea of the designing image retrieval system is to provide the desired images as of user interest. This leads to finding the solution to set up a good image retrieval system that will be able to find similar images from the huge image data set. The image search is basically with the use of content in the image.
In this study, a new CBIR system is proposed based on semivariogram. In general the semivariogram is applied for the remote sensing images in the area of geo-statistics.These images are captured by satellites that will be having high spatial resolution.To analyse the characteristics of this data semivariogram is one of the best method.Like remote sensing image CBIR system works with large image database. These databases contain many categories of images that will have a non-uniform distribution of the pixel intensities and dissimilar backgrounds.Since semivariogram is a statistical approach, it really works well for the image to characterise the texture intensities.This is the case the idea of adapting semivariogram method for the CBIR system.The main focus of the work is to use the minimal feature from the image and reduce the computational time required for the entire image database.
1.2 Organisation of the paper
The remainder of this article is organized as follows. Section 2 discusses the related work and section 3 gives the mathematical model of the proposed system. In section 4 feature extraction is discussed with an example. Section 5 briefly explains the experimental design and results. Section 6 gives the distance metrics for similarity measurements. Section 7 discusses the experimental design and Section 8 gives performance evaluation and conclusion followed by section 8.
2. Related Work
From the discrete wiener-Levy process in [11], it is proved that a semivariogram gives a spatial correlation of the pixels than the covariance method. The random process called the Levy process is a Brownian motion mathematical representation. The covariance fails to extract spatial information with distortion whereas the semivariogram strongly characterizes the spatial features. In geostatistics, the features analysis has to be done by fitting the experimental semivariogram to a theoretical semivariogram. The model examines the structure and continuity of the spatial relationship in a random field.
The experimental semivariogram model can be fit into the theoretical semivariogram model. There are two methods have been used in [12]. One is by manual fitting and the second is by automatic model fitting. The automatic model fitting uses methods like maximum likelihood or least squares [13].In manual fitting, the model was chosen based on picture perception of the experimental semivariogram. For a given waveband information reproduction of the pattern will be clear and strong explanation of the pattern in an image can be provided by the semivariogram.
In general remote sensing images for the land, consolidation is having a high spatial resolution. This is a limitation for the pixel-based analysis and land cover classification in remote sensing images concerning its spectral behaviour. To overcome this problem texture extraction is done using fixed window size and varying window size depending on semivariogram result. Texture classification in microwave images [14] is executed using the semivariogram method. The statistical parameters are determined and considered as image features. They are first and second-order element difference, first and second-order element inverse difference, entropy and, uniformity.
The accurate object-oriented classification is presented in [15] for Quick Bird images by applying a method called the set of semivariogram texture feature(STF) based on the mean square root pair difference(SRPD). The parameter like direction, lag distance, and moving window size are considered for semivariance analysis to classify the texture feature.
A new set of 2-D RCWF(Rotated complex wavelet filter) is designed to improve the retrieval accuracy using complex wavelet filter coefficients. It produces strong texture information of the oriented images in six different directions. This is non-separable and oriented relatively improves the classification of oriented textures. Also, they have used the combination of dual-tree RCWF and DFWCT to extract the texture features in 12 different directions [16].
The new algorithm based on Gabor filter and EHD(Edge Histogram Descriptor) has been proposed for the texture feature extraction. These two are fused to get the good performance of the system. The Gabor and EHD are applied to every 40 images and then six bins are considered from each of the images. This improves the efficiency of the EHD. As a result, the dimension of the character is reduced to 40X6 as mentioned in [17].
Perceptual texture features are considered for the representations and retrieval of images. These features contain contrast, directionality, and coarseness and dryness. Where busyness has given less importance compared to the other three features. They have used these four perceptual features for the experiment. The experiment result shows appreciable scores for the broadtz image database retrieval [18].
The image retrieval system uses a combination of color and texture features. As a color feature color autocorrelation of the HSV color model is used and for texture feature BDIP(Block difference of inverse probabilities) and BVLC(Block variation of the local correlation coefficient)are used. These two texture features effectively measure the texture smoothness. The image is divided into 2X2 blocks and these moments are computed in the wavelet transform domain. This gives better accuracy when compared with conventional texture extraction methods [19].
Palm print retrieval is proposed in [20] using texture features. Texture energy is presented to identify the global and local texture features of the palm print. The four masks which are defined in the work are used to extract the line segment in horizontal and vertical directions and is referred to as local feature. The local feature provides detailed information and global feature provides overall properties of the palm print. The steps involved in global feature calculations are image alignment, energy computation, boundary tracing, a center of gravity calculation, and mapping the key points.
The content-based image retrieval system is an active research area for the past two decades. Many researchers have come up with different ideas to enhance the performance of the system by extracting texture features. The most used texture extraction methods are GLCM, covariance method and co-occurrence matrix, and so on. In this work, the semivariogram method is applied for texture extraction. The semivariogram is widely used to analyse the pattern of the remote sensing images. The content-based image retrieval databases will have distinct images with different types of patterns. The function of the semivariogram is to find the spatial distance between each pattern in the image. The semivariogram approach and spectral distortion measures are applied to image texture retrieval in [21]. The experiment is conducted using the Broadtz texture database. The spectral distortion methods are combined with a semivariogram to retrieve similar images. The effectiveness of the work is tested on Illinois at Urbana-Champaign texture database. The semivariogram method does not need the knowledge of the mean value of the function for the estimation of the spatial relationship. The probability of the random function is not required for the semivariogram methodology as in the GLCM method and co-occurrence method.
A hierarchical retrieval system is proposed in [22] using the visual contents(color,shape and texture).The fusion of histogram gradients, adaptive tetrolet transform and auto color correlogram methods are applied to extract the image features and to make the image retrieval more effective.
The proposed method estimates the pattern similarity by finding the distance between the pixels as it plays an important role in recognition of the similar images from the large database.
3. Mathematical Model for Semivariogram and Robust semivariogram
Variance is a measure of data spread between numbers in a data set. It measures the data on how far each number in the set is from the mean and also its variability from the average mean. A small variance shows how close the data to the mean and high variance indicates the data points are how far from the mean.The variogram is a statistical measure can be represented graphically in a manner which characterizes the spatial continuity i.e. roughness of a dataset.
Semivariogram is one of the standard geo-statistical parameters is used to find spatial relationships between two values in that location as a function of the distance. The lag distance h is taken for paired location in an image.
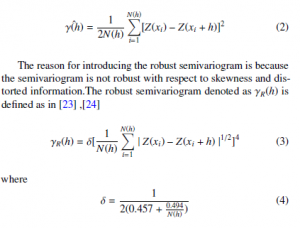
Let X, z, and h be a random function, a spatial location, and a lag distance in the sampling space, respectively. The variogram of the random function is defined as:
![]()
where γ(h) is called the semivariogram of the random function. Let Z(xi) be the pixel value at the location , i = 1, 2, . . ., n, where n is the sampling size. The variable z is the intensity value at location of the image. The experimental semivariogram, of the random function is expressed as in [26]
4. Extraction of Texture Feature of an Image
The texture feature can be extracted using the semivariogram.The block diagram of the proposed method is as shown in fig 1.Let us consider an image as shown in fig 2. To extract texture information the image is resized into 640X640 pixels. Then the image is divided into 9 sub-images of size 215X215. The lag distance ’h’ value is taken as 20. The variogram is calculated for each sub-image and its results in a feature vector size 20X9. The pictorial representation of the semivariogram features and robust semivariogram features is as shown in fig 3 and fig 4.The variogram shape near the origin is linked to the smoothness of the phenomenon. If the shape is continuous and differentiable it shows smoothness of the image, if it is not differentiable it shows roughness of the image. This process is applied to all the images in the query database and search database and these features are stored to find the similarity distance.
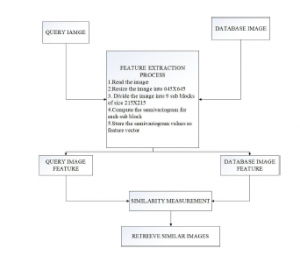
Figure 1: Block diagram of the proposed method

Figure 2: Bus Image
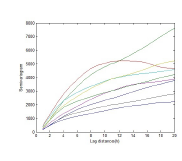
Figure 3: Experimental Semivariogram for the Bus image

Figure 4: Robust Semivariogram for the Bus image
5. Distance Metrics for similarity measurements
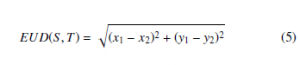
Euclidean distance: If S (x1, y1) and T (x2, y2) are the two feature points of the image then the Euclidean distance between the two points is given by,
Canberra distance: The Canberra distance is a numerical measure of the distance between pairs of points in a vector space. The Canberra distance (CBD) between two vectors is given by ,

Manhattan distance: If S (x1, y1) and T (x2, y2) are two points then the Manhattan distance between two points S and T is given
by,

6. Experimental Design and Discussion
6.1 Experiment with three databases using Euclidean distance
The image retrieval experiment is conducted using the natural and object-based image database namely Corel 1K, Corel 10K, and Coil 100. The images in these databases are taken to investigate the performance of the proposed method. The Corel 1K database contains 10 categories and each category has 100 images such as people, beach, bus, dinosaur, roses, and so on. Each image of size 256X384 and 384X256.This is divided into query database of 300 images i.e 30 images from each category and search a database of 700 images i.e. 70 images from each category.
The proposed method is examined using the Corel 10K database [6]. This database contains 10000 natural image collection of 100 categories. Each image of size 126X187 and 187X126. The images in this database are having a dissimilar and unstructured pattern. Some categories of images are dolls, doors, sunset, mountains, etc. Each category has 100 images which are divided into 3000 images of query database i.e 30 images from each class and 7000 images of search database i.e. 70 images from each category.
The COIL 100 dataset is used to investigate the performance of the proposed image retrieval system. This database contains 100 categories of 7100 images. Each image is of size 128X128. This database is having object-based images like a hammer, car, toy, fruits, etc with uniform background and these images are most similar in pattern. This database is divided into a query database of 1000 images 10 images from each class and a search database of 6100 images 61 images from each class.
The system is designed to show the top ten retrievals of similar images for each query image. The similarity matching is based on the shortest distance score measured using Euclidean distance metrics between the query image and the database image. If the system retrieves similar images according to query, then we say the system is retrieved the target images else the system fails to retrieves the target images. The performance of the system is examined using average precision and average recall.Table 1 shows the three databases’ precision and recall values using semivariogram method and lag distance is set to 20.
Table 1: Prescision and recall values using Experimental semivariogram on Image Databases.
| sl No | Name of the Database | Precision | Recall |
| 1 | Corel 1K | 0.77 | 0.109 |
| 2 | Corel 10K | 0.323 | 0.045 |
| 3 | Coil 100 | 0.858 | 0.126 |
6.2 Experiment with Corel-1k database using four distance measures
The retrieval rates are computed using the complete Corel 1k dataset using four distance metrics. The retrieval test is done using the semivariogram and robust semivariogram method by setting the lag distance value h is equal to 20.
The distance measures compared using semivariogram and robust semivariogram methods. Table 2 and Table 3 show the average precision and average recall values for four distance measures.The examples for retrieval of these measure is as shown in fig 12,fig 13, fig 14 and fig 15. The fig 11 shows the query images.
Table 2: The average Precision values for Four distance metric
| sl No | Distance metric | Semivariogram | Robust
Semivariogram |
| 1 | Euclidean | 0.77 | 0.78 |
| 2 | Manhatten | 0.52 | 0.51 |
| 3 | Canberra | 0.58 | 0.72 |
| 4 | Chord | 0.38 | 0.54 |
Table 3: The average recall values for four distance metric
| sl No | Distance metric | Semivariogram | Robust
Semivariogram |
| 1 | Euclidean | 0.109 | 0.109 |
| 2 | Manhatten | 0.061 | 0.072 |
| 3 | Canberra | 0.071 | 0.102 |
| 4 | Chord | 0.176 | 0.057 |
6.3 Experiment with lag distance ’h’ for the Corel-1k database using Euclidean distance
The semivariogram is a function of variable lag distance h. The semivariogram increases the dissimilarity with the lag distance h. If the distance is more it fails to identify the patterns of the image. The semivariogram is calculated based on the lag distance. In this experiment, the distance chosen is 20 and 30. As the distance increases the textural information is lost.if the distance is less than strong textural information can be extracted. The table 4 shows the time taken for the calculation of semivariogram and robust semivariogram for a single image.Table 5 shows the precision and recall values for the retrievals of corel 1k database with lag distance 20 and 30.From the table 5 we can notice that for the lower lag distance the performance of the system is effective.
Table 4: The computation time for different lag distance
| sl No | Lag distance(h) | Semivariogram | Robust
Semivariogram |
| 1 | 30 | 1.070 sec | 2.88 sec |
| 2 | 50 | 1.483 sec | 4.25 sec |
| 3 | 100 | 2.136 sec | 6.59 sec |
| 4 | 150 | 2.448 sec | 7.566 sec |
| 5 | 200 | 2.479 sec | 7.91 sec |
Table 5: The computation of Image retrievals for the lag distance h=20 and h=30 using semivariogram
| sl No | Lag distance(h) | Precision | Recall |
| 1 | 20 | 0.77 | 0.109 |
| 2 | 30 | 0.74 | 0.06 |
From the Table 4, we can see that as distance increases computation time increases, and the amount of information decreases. As the distance taken is small the rate of information increases and results in more retrieval of similar images i.e. lower the distance higher the continuity. For the lag distance h the proposed method results in an effective retrieval of similar images.
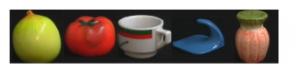
Figure 5: Query Images from COIL 100 dataset

Figure 6: Retrieved images for the queries show in figure 5.
6.4 Retrieval results
The feature vectors are stored and are tested for four distance metrics. The result shows that Euclidean distance is best suited for the retrieval of similar images from the image database. The robust semivariogram shows still good performance comparing with the semivariogram method. This is because the semivariogram is not robust against the distribution and distortion of the pixel values. The Euclidean distance measure results in good retrieval of similar images when compared to the other three distance measures. Results are tabulated for the first top ten retrieved images. For the Dinosaurs, Rose, and Horse class Ten images of the same class are retrieved at the top ten images. The results by using the semivariogram method for the image databases are tabulated in Table 1.
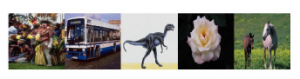
Figure 7: Query image from COREL-1K database

Figure 8: Retrival using Euclidean distance for the COREL-1K database
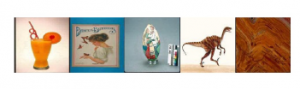
Figure 9: Query image from COREL-10K database

Figure 10: Retrival uisng Euclidean distance for the COREL-10K database
The top ten retrieved images for the Coil-100, Corel 1K, and Corel 10K database are shown in fig 6, fig 8, and fig 10 respectively. The Query samples for these retrievals are shown in fig 5, fig 7, and fig 9. For the COIL 100 database, the proposed technique is effective in retrieving similar images from the database for all the categories present in the database. The semivariogram method works well for the Corel 1k and Corel 10k database in which these databases are having the most dissimilar pattern of images.
7. Performance Evaluation and comparison
In content-based image retrieval, most of the researchers use precision and recall as the evaluation metrics. Precision is the proportion of relevant images retrieved over the total number of images retrieved and recall is the relevant images retrieved over a total number of relevant images are there in the database. The precision and recall are defined, Precision = RR1 Recall = RR2.
where, R: Number of relevant images retrieved.
R1: Total number of images retrieved.
R2: Total number of relevant images in the database.
The proposed method gives 77% of efficiency for the corel 1k database,32.3% for corel 10k and 85.8% efficiency for the coil-100 database as shown in the Table 1.
The experiment is conducted to investigate which distance measure is best suited to find the query image’s closeness with the database image.We have compared the performance of the CBIR systems in terms of precision and recall values using Euclidean distance, Canberra distance, Manhattan distance, and Chord distance. The performance results are as tabulated in the table shows that Euclidean distance is best suited for retrieving images from the large database for the proposed approach. Whereas Chord distance shows very low performance compared to Euclidean distance,Canberra distance and Manhattan distance.
7.1 Comparison with existing methods
The experiment is compared with some of the existing methods under the Corel 1k database. It can be seen that the proposed method performs better in comparison with the existing CBIR methods as in [12]–[25]. The proposed methods yield the average precision value 0.77 and 0.78 concerning semivariogram and robust semivariogram.Table 6 shows the comparison of Corel-1K database with existing methods.
For Corel 10000 database, the experiments were conducted as similar to Corel 1000 database. In this work, 100 categories are used to check the system performance. The work carried in [26] uses the 20 image categories to test the system performance. As similar to the experimental set-up in [27], [28]the number of retrieved images is set to 10.Table 7 exhibits the proposed method’s comparisons over the existing methods for Corel 1k and Corel 10k database.
The COIL-100 database is compared with existing methods as shown in Table 8. The former schemes show good results by considering only a few categories of the COIL-100 database. In our work, the results are tabulated for the entire categories present in the COIL-100 database.
The Table 7 and 8 shows the average precision values for the best retrievals of image categories. The authors from [29], [30] presents the system performance which gives best results for some categories of the image database.The number categories does not play any role for the system performance ,it mainly depends on right choice of the feature and the similarity measurement. The proposed work is tested for all the categories of the image database and it is capable of retrieving most similar images for all the categories except for the Corel 10k database.
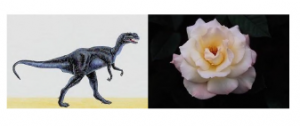
Figure 11: Query Image from Corel-1K database
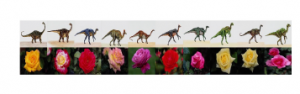
Figure 12: Retrieval using Euclidean distance

Figure 13: Retrieval using Manhatten distance
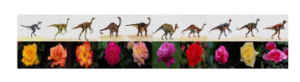
Figure 14: Retrieval using Canberra distance

Figure 15: Retrieval using Chord distance
Table 6: Comparison with Existing CBIR methods under Corel-1k Database.
| Sr. No | Method | Average precision |
| 1 | [31] | 0.396 |
| 2 | [32] | 0.526 |
| 3 | [33] | 0.532 |
| 4 | [34] | 0.533 |
| 5 | [35] | 0.566 |
| 6 | [36] | 0.565 |
| 7 | [25] | 0.0665 |
| 8 | [26] | 0.717 |
| 9 | [29] | 0.725 |
| 10 | Proposed method | 0.77 |
Table 7: Comparison with Existing CBIR methods under corel-10k Database.
| Sr. No | Method | Average precision |
| 1 | EOAC[27](65 Query images) | 0.210 |
| 2 | CSD3[26](10 categories) | 0.290 |
| 3 | MTH[37](100 categories) | 0.310 |
| 4 | TCM[28](100 categories) | 0.204 |
| 5 | EDBTC[38](20 categories) | 0.798 |
| 6 | Proposed method (100 categories) | 0.323 |
Table 8: Comparison with Existing CBIR methods under COIL-100 Database.
| Sr. No | Method | Average precision |
| 1 | [39](10 categories) | 0.86 |
| 2 | [40](15 categories) | 0.88 |
| 3 | [41](15 categories) | 0.78 |
| 4 | [42](10 categories) | 0.86 |
| 5 | [43](10 categories) | 0.93 |
| 6 | Proposed method(100 categories) | 0.858 |
8. Conclusion
The semivariogram and robust semivariogram techniques are applied to the color images for the feature extraction and retrieval processes from the large database.These techniques gives promising texture feature for the images.Both methods are analysed and compared with different distance metrics. The experiment tested using three databases having images of natural scenes, color, texture, and objects. The results are computed in terms of precision and recall. The precision rate achieved for the Coil-100 database is 85% and the
Corel-1K database is 76%. The improved performance is observed with Euclidean distance measure over three distance measures. The experiment results show that the semivariogram is more effective for the content-based image retrieval system but not limited to remote sensing images.
- N. Rajani, A. Sreenivasa Murthy, “Semivariogram based feature extraction for content based image retrieval,” in ACM International Conference Proceeding Series, 2019, doi:10.1145/3332340.3332348.
- M. Singha, K. Hemachandran, “Content based image retrieval using color and texture,” Signal & Image Processing, 3(1), 39, 2012.
- D. Srivastava, S. Goel, S. Agarwal, “Pipelined technique for image retrieval us- ing texture and color,” in 2017 4th International Conference on Power, Control & Embedded Systems (ICPCES), 1–6, IEEE, 2017.
- H. Kebapci, B. Yanikoglu, G. Unal, “Plant image retrieval using color, shape and texture features,” The Computer Journal, 54(9), 1475–1490, 2011.
- R. M. Haralick, K. Shanmugam, I. H. Dinstein, “Textural features for im- age classification,” IEEE Transactions on systems, man, and cybernetics, (6), 610–621, 1973.
- J.M. Guo, H. Prasetyo, “Content-based image retrieval using features extracted from halftoning-based block truncation coding,” IEEE Transactions on image processing, 24(3), 1010–1024, 2014.
- T. Ruziˇc, A. Pi ́zurica, “Context-aware patch-based image inpainting using Markov random field modeling,” IEEE transactions on image processing, 24(1), 444–456, 2014.
- Y. Dong, J. Ma, “Wavelet-based image texture classification using local energy histograms,” IEEE Signal Processing Letters, 18(4), 247–250, 2011.
- Y. Qiao, L. Weng, “Hidden markov model based dynamic texture classification,” IEEE Signal Processing Letters, 22(4), 509–512, 2014.
- Y. Dong, D. Tao, X. Li, J. Ma, J. Pu, “Texture classification and retrieval using shearlets and linear regression,” IEEE transactions on cybernetics, 45(3), 358–369, 2014.
- R. A. Olea, “The Semivariogram,” in Geostatistics for Engineers and Earth Scientists, 67–90, Springer, 1999.
- N. Cressie, “Statistics for spatial data New York,” 1993.
- A. Balaguer, L. A. Ruiz, T. Hermosilla, J. A. Recio, “Definition of a compre- hensive set of texture semivariogram features and their evaluation for object- oriented image classification,” Computers & Geosciences, 36(2), 231–240, 2010.
- K. Kitada, K. Fukuyama, “Land-use and land-cover mapping using a gradable classification method,” Remote Sensing, 4(6), 1544–1558, 2012.
- J. R. Carr, F. P. De Miranda, “The semivariogram in comparison to the co- occurrence matrix for classification of image texture,” IEEE Transactions on geoscience and remote sensing, 36(6), 1945–1952, 1998.
- A. Yue, C. Zhang, J. Yang, W. Su, W. Yun, D. Zhu, “Texture extraction for object-oriented classification of high spatial resolution remotely sensed im- ages using a semivariogram,” International Journal of Remote Sensing, 34(11), 3736–3759, 2013.
- X. Wu, J. Peng, J. Shan, W. Cui, “Evaluation of semivariogram features for object-based image classification,” Geo-spatial Information Science, 18(4), 159–170, 2015.
- M. Kokare, P. K. Biswas, B. N. Chatterji, “Texture image retrieval using new rotated complex wavelet filters,” IEEE Transactions on Systems, Man, and Cybernetics, Part B (Cybernetics), 35(6), 1168–1178, 2005.
- H. Zhang, X. Jiang, “An improved algorithm based on texture feature extraction for image retrieval,” in 2015 12th International Conference on Fuzzy Systems and Knowledge Discovery (FSKD), 1270–1274, IEEE, 2015.
- M. Jian, L. Liu, F. Guo, “Texture image classification using perceptual texture features and Gabor wavelet features,” in 2009 Asia-Pacific Conference on Information Processing, volume 2, 55–58, IEEE, 2009.
- H. J. So, M. H. Kim, N. C. Kim, “Texture classification using wavelet-domain BDIP and BVLC features,” in 2009 17th European Signal Processing Confer- ence, 1117–1120, IEEE, 2009.
- N. Varish, A. K. Pal, R. Hassan, M. K. Hasan, A. Khan, N. Parveen, D. Banerjee, V. Pellakuri, A. U. Haqis, I. Memon, “Image retrieval scheme using quantized bins of color image components and adaptive tetrolet transform,” IEEE Access, 8, 117639–117665, 2020.
- W. Li, J. You, D. Zhang, “Texture-based palmprint retrieval using a layered search scheme for personal identification,” IEEE Transactions on Multimedia, 7(5), 891–898, 2005.
- T. D. Pham, “The semi-variogram and spectral distortion measures for image texture retrieval,” IEEE Transactions on Image Processing, 25(4), 1556–1565, 2016.
- T.-C. Lu, C.-C. Chang, “Color image retrieval technique based on color features and image bitmap,” Information processing & management, 43(2), 461–472, 2007.
- F.-X. Yu, H. Luo, Z.-M. Lu, “Colour image retrieval using pattern co- occurrence matrices based on BTC and VQ,” Electronics letters, 47(2), 100– 101, 2011.
- F. Mahmoudi, J. Shanbehzadeh, A.-M. Eftekhari-Moghadam, H. Soltanian- Zadeh, “Image retrieval based on shape similarity by edge orientation autocor- relogram,” Pattern recognition, 36(8), 1725–1736, 2003.
- C.-H. Lin, D.-C. Huang, Y.-K. Chan, K.-H. Chen, Y.-J. Chang, “Fast color- spatial feature based image retrieval methods,” Expert Systems with Applica- tions, 38(9), 11412–11420, 2011.
- M. Subrahmanyam, Q. M. J. Wu, R. P. Maheshwari, R. Balasubramanian, “Modified color motif co-occurrence matrix for image indexing and retrieval,” Computers & Electrical Engineering, 39(3), 762–774, 2013.
- G.-H. Liu, J.-Y. Yang, “Image retrieval based on the texton co-occurrence matrix,” Pattern Recognition, 41(12), 3521–3527, 2008.
- M. R. Gahroudi, M. R. Sarshar, “Image retrieval based on texture and color method in BTC-VQ compressed domain,” in 2007 9th International Symposium on Signal Processing and Its Applications, 1–4, IEEE, 2007.
- N. Jhanwar, S. Chaudhuri, G. Seetharaman, B. Zavidovique, “Content based im- age retrieval using motif cooccurrence matrix,” Image and Vision Computing, 22(14), 1211–1220, 2004.
- P.-W. Huang, S. K. Dai, “Image retrieval by texture similarity,” Pattern recogni- tion, 36(3), 665–679, 2003.
- T.-W. Chiang, T.-W. Tsai, “Content-based image retrieval via the multireso- lution wavelet features of interest,” Journal of Information Technology and Applications, 1(3), 205–214, 2006.
- S. Silakari, M. Motwani, M. Maheshwari, “Color image clustering using block truncation algorithm,” arXiv preprint arXiv:0910.1849, 2009.
- M. Saadatmand-Tarzjan, H. A. Moghaddam, “A novel evolutionary approach for optimizing content-based image indexing algorithms,” IEEE Transactions on Systems, Man, and Cybernetics, Part B (Cybernetics), 37(1), 139–153, 2007.
- G. H. Liu, L. Zhang, Y. K. Hou, Z. Y. Li, J. Y. Yang, “Image retrieval based on multi-texton histogram,” Pattern Recognition, 43(7), 2380–2389, 2010, doi:10.1016/j.patcog.2010.02.012.
- J.-M. Guo, H. Prasetyo, J.-H. Chen, “Content-based image retrieval using error diffusion block truncation coding features,” IEEE Transactions on Circuits and Systems for Video Technology, 25(3), 466–481, 2014.
- J. Kavya, H. Shashirekha, “A Novel approach for image retrieval using combi- nation of features,” International Journal of Computer Technology & Applica- tions, 6(2), 323–327, 2015.
- K. Velmurugan, L. D. S. S. Baboo, “Content-based image retrieval using SURF and colour moments,” Global Journal of Computer Science and Technology, 2011.
- A. Bahri, H. Zouaki, “A SURF-color moments for images retrieval based on bag-of features,” European Journal of Computer Science and Information Technology, 1(1), 11–22, 2013.
- A. Mukherjee, S. Chakraborty, J. Sil, A. S. Chowdhury, “for Content-Based Image Retrieval,” 79–87, doi:10.1007/978-981-10-2104-6.
- K. Kavitha, M. V. Sudhamani, “Object based image retrieval from database using combined features,” Proceedings – 2014 5th International Conference on Signal and Image Processing, ICSIP 2014, 1(12), 161–165, 2014.
No related articles were found.