
SEA: An UML Profile for Software Evolution Analysis in Design Phase
Volume 6, Issue 1, Page No 1334-1342, 2021
Author’s Name: Akram Ajouli1,2,a)
View Affiliations
1Department of Computer Science, College of Computer and Information sciences, Jouf University, Sakaka 2014, KSA
2High Institute of Applied Sciences and Technology of Gafsa, Gafsa University, Gafsa, 2100, Tunisia
a)Author to whom correspondence should be addressed. E-mail: asajouni@ju.edu.sa
Adv. Sci. Technol. Eng. Syst. J. 6(1), 1334-1342 (2021); ![]() DOI: 10.25046/aj0601153
DOI: 10.25046/aj0601153
Keywords: Software Evolution, Tyranny of decomposition, Modular Maintenance, Software Concerns, UML Profile

Export Citations
Software evolution is one of the software process activities that occupies a major percentage of software development cost. Since requirements change continually and new technologies emerge, software should be adapted to satisfy these new changes to continue to survive. Despite software evolution being performed after software validation and deployment, software developers should predict at earlier stages how software would evolve in the future to avoid surprises. Although many works focus on how to enhance the program structure to facilitate maintenance tasks, only few works treat software evolution in earlier phases of software development process. In this direction, we propose an UML profile that permits to tackle software maintenance issues at the early phases of software development process. The proposed approach helps software developers to predict in design phase the kind of maintenance tasks that could occur in the future.
Received: 25 December 2020, Accepted: 14 February 2021, Published Online: 28 February 2021
1. Introduction
According to [1], software evolves and changes continually in order to support new emerging technologies and satisfy customers and business needs. Some studies estimate that software evolution could reach more that 60% of software development total cost [2]. This issue pushes software engineering community to focus on how optimizing software evolution cost.
In fact, software maintenance cost varies depend on the kind of maintenance tasks that will be performed. For example, if the source code to be maintained is crosscutting among software modules, maintenance tasks performed on that source code are as well, the thing that could generate an extra cost. But, if the source code to be maintained is encapsulated in a single module, software maintenance applied to that source code is modular (less time and less cost).
Duality among crosscutting maintenance and modular maintenance motivates the community to provide solutions to keep software maintenance being modular. For example, some design patterns [3] and some program structuring/decomposition [4]–[8] facilitate software reuse and maintenance. But, even though some solutions could assure modular software maintenance, the challenge still existing since software maintenance could be modular for the same program with respect to a given architecture/structure but not with respect to another. A such problem is known as tyranny of decomposition or expression problem [9] (see Sect. 3 for more details). To resolve this problem, many works ( [10]–[14]) tried to attenuate the effect of tyranny of decomposition on software maintenance but results still relative and they treat this issue only in source code level.
In this paper, we illustrate how software developers could tackle software maintenance issues at the design phase of software development process. The early treatment and analysis of software maintenance tasks that could occur later permits to get a clear overview about how the program will evolve in the future. The main goal is to specify from the beginning the program structure that is more adaptable for future maintenance tasks. This could be realized by: first, identifying what kind of maintenance tasks is more probable to occur and then recommending the program architecture that is more adaptable to this kind of maintenance tasks. To concertize our approach, we define an UML profile that helps software developers to analyze and predict the kind of future software maintenance tasks that could occur.
The rest of this paper is organized as follows: first, we explore some related works (Sect. 2). Then, we give some explanations about tyranny of program decomposition problem. We show also how this problem affects modular maintenance (Sect. 3). Next, we present how we have defined SEA UML profile (Sect. 4). After that, we show how we validated SEA by applying some stereotypes in a real case study (Sect. 5). Finally, we resume our contributions and we propose some future works (Sect. 6).
2. Related work
In fact, this paper is an extension of the paper [15] (presented in the International Conference on Computer and Information Sciences (ICCIS) in 2019). In [15], the approach consists of proposing an UML profile called MODEM used to model maintenance tasks in design phase. This profile provides some UML stereotypes that permits to software developers to model and analyse maintenance tasks before occurring. The extension we propose in this work consists of adding more details and semantics to the previous work. We have modified some stereotypes, added new stereotypes and added tagged values in order to better analyse and predict in design phase future maintenance tasks that could occur. Further more, comparing to the previous work, we validate the extended UML profile by apply it to a real case study.
In [16], the author proposed a process of eight steps helping to supervise maintenance tasks that could occur later. Their approach simulates communications between stakeholders in order to design maintenance tasks, apply them and test software again before delivering the final version. In [17], the author proposed also an approach that aims to treat maintenance tasks in early phases of software development. They propose a software maintenance life cycle model that relies on a process of four steps. During this process, stakeholders interact between each other to study and analyze maintenance tasks to do in order to guarantee a consistent planning for performing maintenance tasks. The process is incremental and iterative and it stops when maintenance tasks analysis proves that software maintenance requests percentage becomes under a given threshold.
Although these works show a relevant contribution in planning maintenance tasks at earlier stages of software development, both of them involve different stakeholders to express needed maintenance tasks which could disturb software development process. In addition, maintenance issue is not expressed explicitly in models as we propose in our approach.
In [18], the author proposed an UML profile that permits to support requirements evolution. Their method is tool supported and consists of extending requirements engineering process by making it supporting requirements evolution. Although this approach facilitates requirements changes management, it still limited to specification phase. In our work, we focus more on design phase because we treat a problem which is related to software architecture rather than software requirements.
Some other works like [19]–[22] focus on analyzing and expressing design patterns explicitly at early phases of software development by defining the appropriate UML profiles. These works aim to enhance design patterns implementation comprehension for programmers since design pattern does not appear explicitly on source code. These works focus more on improving software comprehension rather than treating software evolution issue.
Some other works such as [13] and [23] treat maintenance issues in implementation phase by providing reversible transformations among dual design patterns (composite and visitor) in order to keep maintenance tasks modular. In [24], the author proposed also a relevant approach that treats software maintenance issue in source code level. Their approach consists first of exploring the best machine learning techniques used for predicting software maintenance and then improving their performance. Although these works show important contributions in treating software maintenance issues, they still limited to implementation phase while we focus more on tackling this issue in earlier software process activities.
3. Background
We present in this section an overview about potential challenges that software evolution could face. One of the issues that could affect software evolution is tyranny of decomposition or expression problem [9]. In fact, although software modularity enhances program structure and facilitates software maintenance, a modular program structure could be biased to one kind of modular maintenance and not to another. A maintenance task is called modular when changes are mostly encapsulated in one module. Contrary to this, if changes touches many modules at the same time, the maintenance task is called crosscutting.
For example, Figure 1 illustrates a program composed of two classes Circle and Rectangle that extend an abstract class Shape. The program contains also two methods print() and show() which represent the business code of the program. The structure of the program is a base form of Composite design pattern in which each data type is encapsulated in a module. A such program structure decomposes the program with respect to data-types axis.
The decomposition of the program (Figure 1) permits to perform modular maintenance with respect to data-types. For instance, if we add a new shape (a Triangle for example) to the hierarchy of shapes shown in Figure 1, we first create a new class, then, we redefine the code of methods print() and show() only in this new class. In this case, the maintenance task is modular (low cost). But, if we add a new feature to the program (for example a method color()), we have to implement it in all classes which causes a crosscutting maintenance (extra cost). We deduce that the architecture of the program shown in Figure 1 allows a modular maintenance with respect to data-types and not with respect to functions (methods). Hence, the program structure is dominated by the data-types decomposition axis (a tyranny of decomposition according to data-types).
Another axis of decomposition of the program described above is illustrated in Figure 2. This program represents the Visitor design pattern implementation of the program shown in Figure 1. The Visitor pattern encapsulates each business code in a single module: the business code print is encapsulated in module/class Print and the business code show is encapsulated in module/class Show. This program structure decomposes the program with respect to functions which permits to add a new function without touching other modules: for example if we add a feature color to the program, we add a new class in which we implement this new feature for all shapes. Thus, Visitor design pattern permits to perform modular maintenance with respect to functions since it provides a functions decomposition axis.
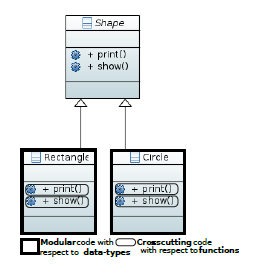
Figure 1: Decomposition axis of a simple variety of Composite design pattern.
But, if we add a new shape to the program shown in Figure 2, many modules would be changed since the new shape should be visited by both print and show business codes. In this case, the program maintenance is crosscutting. We say that the program structure is dominated by functions decomposition axis (a tyranny of decomposition according to functions).
The above two examples explain well the problem of tyranny of decomposition. A such issue still always a main problem that affects software evolution. In this work, we aim to contribute in attenuating tyranny of program decomposition effect on software maintenance. Our target is to help software developers in analyzing and predicting in earlier phases of software development the kind of maintenance tasks that could occur later and in recommending the right architecture (decomposition axis) of the program that could keep maintenance being modular.
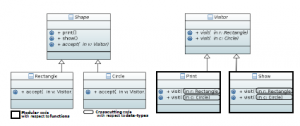
Figure 2: Visitor structure corresponding to the program shown in Figure1.
4. SEA specification
4.1 Overview
Many works have treated software evolution issue at the implementation phase. In this work, we tackle this issue in design phase of software development process. Since UML (Unified Modeling Language) [25] does not provide customized semantic constructs related to software maintenance, we propose an UML profile [26] that supports analyzing and predicting maintenance tasks that could occur in the future.
The UML profile we propose is called SEA (in short SEA for Software Evolution Analysis) (see Fig. 3) . SEA is defined in Papyrus [27] EMF-based editor and it provides the following features:
- tracing software evolution history by adding some information to each software version. This feature could help to get an overview about maintenance tasks characteristics, the thing that could provide some recommendations about choosing the right program structure.
- studying and deciding which parts of a given software are more stable than others. This feature could help to predict at earlier phases the program structure evolution.
- expressing explicitly some semantic terms related to software maintenance in class diagrams such as data-type module, function module, composite design pattern…etc. This feature enhances software comprehension and helps to identify the decomposition axis of a given software.
«Profile»
SEA
«Metaclass» «Metaclass»
Class Package
«Stereotype» «Stereotype» «Stereotype» «Stereotype» «Stereotype» «Stereotype» stable_module non_stable_module data_type_module function_module version evolution_history + name: String [1] + date_from_to: String [1]
+ number_of_total_functions: Integer [1] + versions: String [*]
+ number_of_total_data_types: Integer [1] + number_of_added_functions: Integer [1]
+ number_of_added_data_types: Integer [1]
+ number_of_changed_functions: Integer [1]
+ number_of_changed_data_types: Integer [1]
«Metaclass»
Operation «Metaclass»
Comment
«Stereotype» «Stereotype» «Stereotype» «Stereotype»
business_function stable_business_function non_stable_business_function used_design_pattern

Figure 3: SEA: an UML profile for analyzing software evolution.
4.2 Stereotypes for analyzing software modularity
Marking modular and crosscutting software parts. Modularity in software architecture helps to optimize software maintenance cost. It permits also to encapsulate concerns and minimize crosscutting concerns effect. Thus, expressing modularity concepts explicitly in models and diagrams helps software developers to explore at early stages of software development the decomposition axis that is dominant. This helps to recommend the right kind of future maintenance tasks that are modular and to avoid those which are crosscutting. In this direction, SEA permits to mark explicitly in class diagram which elements represent modular concerns and which elements represent crosscutting concerns.
Until now, SEA supports two concerns (or two decomposition axes): data-types concern and functions concern. In this context, we propose the following stereotypes:
- <<data type module>>: it extends the meta class Class and it is used to precise classes that belong to data-types concern when software architecture is built according to Composite design pattern.
- <<function module>>: it extends the meta class Class and it is used to precise classes that belong to functions concern and that encapsulate program business code when software architecture is built according to Visitor design pattern.
- <<business function>>: it extends the meta class Operation and it is used to mark methods that contain program business code. It could be used especially in Composite pattern structure to show that business code is crosscutting among different modules. This feature helps software developers to be aware of the cost of maintenance tasks performed with respect to functions.
Fig 4 shows an example of how to precise explicitly modules/classes that belong to the concern data-types by applying <<data type module>> to class diagram. In the example, we see explicitly that classes Rectangle and Circle are marked as data-type modules. In the same example, methods print() and show() are marked explicitly as business code. This shows visually that business code is crosscutting among program modules which gives an indication that maintenance tasks performed with respect to functions are costly.
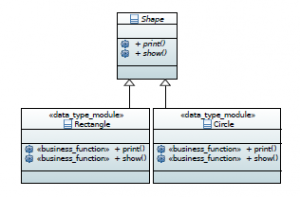
Figure 4: Use of SEA in marking modular data-types concern.

Figure 5: Use of SEA in marking modular functions concern.
Fig 5 shows how to use <<function module>> stereotype to indicate that business code is encapsulated. This is used when the program is structured with respect to Visitor design pattern. We remark that classes Show and Print encapsulate respectively show and print business codes. The fact that these two classes are marked explicitly as functions indicates that software maintenance performed with respect to functions is not costly.
Precising modular program decomposition visually on diagrams helps to guide software developers to perform the right kind of maintenance that respects the existing concern. If they have to perform a crosscutting maintenance, they could be at least ready early to apply some tools or techniques that transform automatically the actual architecture to another one that supports modular maintenance (for example using reversible transformations among Composite and Visitor [13]).
Marking stable and changeable software parts. In order to predict future software evolution at early stages, one should predict which software parts tend to change sharply. For this purpose, we propose the following stereotypes:
- stable business function vs non stable business function: these two stereotypes extend the meta class Operation. The former is used to mark functions/methods that would not be sharply changed. The latter marks probable functions that
could change drastically in the future.
- stable module vs non stable module: these two stereotypes extend the meta class Class. The former is used to mark classes/modules that would not be sharply changed, or will have small changes that do not influence the software architecture. The latter marks classes/modules that could radically change.
Fig. 6 shows how to apply stereotypes mentioned above to a class diagram. For example, after marking software parts as stable or non stable, one could identify which parts seems to be more stable than others. In case of finding that stable data-types modules number is greater than stable functions number, then, the decision could be biased to choose Visitor pattern as a future software architecture (since business code tend to change more than data-types).
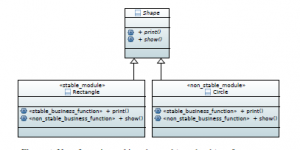
Figure 6: Use of SEA in marking changeable and stable software parts.
4.3 Stereotypes for software evolution history tracing
With time, software evolution could cause software architecture degeneration [28]. So, having a backup for each version is necessary and helps to get back to the non degenerated version. This is already existing by saving old versions. In our approach, we propose the stereotype <<evolution history>> (extends meta-class Package) which permits to precise explicitly on a package including all software versions that this package contains software evolution history. The proposed stereotype provides two tagged values: <<date from to>> and <<versions>>. The former is used to indicate visually the period of time during which versions included in a package stereotyped <<evolution history>> are built. The latter is used to list all versions that are built in the period of time indicated by <<date from to>>. These tagged values permit to add valuable visual data that could be used to assess the stability of software during a period of time.
Fig. 7 shows how to apply <<evolution history>> stereotype: the package software X (stereotyped <<evolution history>>) includes three sub-packages that include respectively three versions
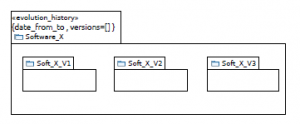
Figure 7: Tracing software evolution with <<evolution history>> stereotype.
The second stereotype that is related to software evolution history is the stereotype <<version>> which extends meta-class Package. It provides information about each version of a given software. It contains seven tagged values:
- name: version name
- number of total data types: total number of classes of current version
- number of total functions: total number of methods of current version
- number of added data types: number of classes that have been added to the previous version to get the current version
- number of added functions: number of methods that have been added to the previous version to get the current version
- number of changed data types: number of classes that have been changed to get the current version
- number of changed functions: number of methods that have been changed to get the current version
Tagged values mentioned above permit to provide visual information about the behavior of software evolution. Getting a visual access to added classes and methods number during switching among software versions helps to get an overview about the recommended software architecture that could optimize maintenance cost. For example, if the percentage of number of added data types comparing to number of total data types is always greater than the percentage of number of added functions comparing to number of total functions and the current architecture is implemented with respect to Visitor pattern, then it will be better to switch the program structure into Composite pattern in order to keep maintenance modular with respect to data-types (see more details in Sect. 5).
Fig. 8 shows how to apply <<version>> stereotype: the package soft X V1 (stereotyped <<version>>) shows the seven defined tagged values that permits to note helpful information about software evolution behavior related to soft X V1.
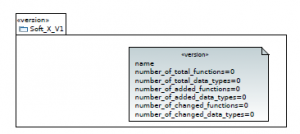
Figure 8: Adding helpful information to a software version by applying <<version>> stereotype.
4.4 Visualizing design patterns
Many programmers face some difficulties when implementing design patterns. Thus, visualizing in design phase some information about the design pattern that will be implemented later orients programmers early to cover any lack of knowledge about the indicated design pattern. In addition, marking design patterns explicitly on diagrams enhances software comprehension.
Marking information about chosen design patterns on diagrams could also assist used techniques in design pattern detection [29] and provide relevant data for data analysis and classification.
To reify this idea, we propose the stereotype <<used designpattern>> that extends the meta-class Comment. It could be associated to the package that includes the hole software project and indicates information about the chosen design patterns to implement. Provided information includes pattern name, pattern uses, modular maintenance tasks permitted, crosscutting maintenance tasks…etc. Fig. 9 shows how to apply <<used design pattern>> on comments.
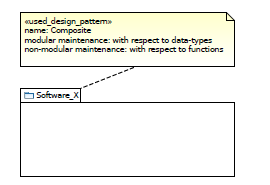
Figure 9: Use of SEA in visualizing information about chosen design patterns.
5. Application of SEA on a real software
5.1 An overview about JHotDraw evolutions
We study the utility of SEA in analyzing JHotDraw [30] evolutions. JHotDraw is a framework for two-dimensional graphics used for structured drawing editors. It is implemented in Java and it is based on Erich Gamma’s JHotDraw, which is copyright 1996, 1997 by IFA Informatik and Erich Gamma [31].
We define the following metrics to use them in the rest of this section:
- Vi: a version i of JHotDraw where 1 <= i <= 13 (we study here 13 versions of JHotDraw)
- CNVi: classes number in version Vi
- MNVi: methods number in version Vi
- ACV1: added classes number to version V1 to obtain version Vi ACV1 = CNVi − CNV1
- AMV1: added methods number to version V1 to obtain version Vi AMV1 = MNVi − MNV1
- ACVi−1: added classes number to version Vi − 1 to obtain version Vi ACVi−1 = CNVi − CNVi−1
- AMVi−1: added methods number to version Vi − 1 to obtain version Vi AMVi−1 = MNVi − MNVi−1
- RACV1: rate of added classes number to version V1 to obtain version Vi RACV1 = CNVACV11
- RAMV1: rate of added methods number to version V1 to obtain version Vi RAMV1 = MNVAMV11
- RACVi−1: rate of added classes number to version Vi − 1 to obtain version Vi RACVi−1 = CNVACVii−−11
- RAMVi−1: rate of added methods number to version Vi − 1 to obtain version Vi RAMVi−1 = MNVAMVii−−11
The table shown in Fig. 10(a) illustrates JHotDraw evolution during 11 years. During this period of time, there were 13 versions of JHotDraw (5.2, 5.3, 5.4 b1, 5.4 b2, 6.0 b1, 7.0.8, 7.0.9, 7.1, 7.2,
7.3.1, 7.4.1, 7.5.1 and 7.6). We call here each version by Vi where 1 <= i <= 13. The first column of the table mentions the version name (V1, V2,…,V13), the second column mentions classes number in Vi (CNVi) and the third column mentions methods number in Vi (MNVi).
Like any software, JHotDraw is influenced by Lehman law [1] as shown by the shape of both curves of CNVi progress (Fig. 10(b)) and MNVi progress (Fig. 10(c)). We remark that classes number, which was 148 in V1, increases to reach 672 in V13, and methods number jumps from 1229 in V1 to 5885 in V13. Considering these evolutions, we apply some stereotypes of SEA profile to show its utility in analyzing software evolution during earlier stages of software process.
| Vi | CNVi | MNVi |
| V1 | 148 | 1229 |
| V2 | 208 | 1896 |
| V3 | 296 | 2723 |
| V4 | 301 | 2809 |
| V5 | 301 | 2809 |
| V6 | 343 | 2809 |
| V7 | 487 | 4234 |
| V8 | 463 | 4285 |
| V9 | 621 | 5486 |
| V10 | 638 | 5627 |
| V11 | 639 | 5582 |
| V12 | 669 | 5845 |
| V13 | 672 | 5885 |
- Classes number and Methodsnumber of each version (data extracted from [32]).
- Evolution of JHotDraw classes number (CNVi) during 11 years.
- Evolution of JHotDraw methods number (MNVi) during 11 years.
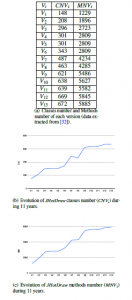
Figure 10: Variations of classes number and method numbers during JHotDraw evolution.
5.2 Using SEA to trace JHotDraw evolutions
To make JHotDraw evolutions easy to analyze in the design activity of software process, we apply stereotypes <<evolution history>> and <<version>>. The former is applied to a package that includes all versions of JHotDRaw during 11 years and the latter is applied to each package that includes a version Vi of JHotDraw.
Application of <<evolution history>> stereotype The target of applying <<evolution history>> stereotype is to add information about the period of time in which JHotDraw versions are built and also about number and names of versions. This information is represented by defined tagged values that characterize the mentioned stereotype.
Fig. 11 shows how <<evolution history>> stereotype and its tagged values are applied. By using this stereotype, software developers could create a package that includes all versions of JHotDraw and marks this package as a special package to trace JHotDraw evolutions history. In addition, they could note information such as ”date from to=2000 to 2011” and list different versions that has been elaborated during this period.
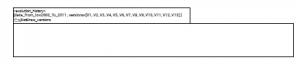
Figure 11: Application of <<evolution history>> stereotype to JHotDRaw.
In fact, the expressiveness provided by the stereotype <<evolution history>> permits to assess the stability of JHotDraw. The stereotype <<evolution history>> provides information about the rate of versions number of JHotDraw by a given period of time (here 13 versions by 11 years) which could evaluate the impact of JHotDraw evolution on total development cost. It motivates also software developers to focus on studying the switch from Vi to Vi+1 and deduce lessons for future evolutions.
Application of <<version>> stereotype As detailed in Sect. 4, the stereotype <<version>> has 7 tagged values. We consider here only name, number of total functions, number of total data types, number of added functions and number of added data types. For each version Vi of JHotDraw, software developers could apply the stereotype <<version>> to the package that contains Vi and they could assign a value to each tagged value. For example, Fig. 12 shows the main package that is stereotyped as <<evolution history>> and inside of it the set of packages stereotyped as <<version>> that represent the 13 versions of JHotDraw.

Figure 12: Application of <<version>> stereotype to JHotDRaw.
For each version Vi, we assume that software developers mark:
- name of the version (example: for version V1, name is 2)
- number of total data types (example: for version V13, number of total data types= 672)
- number of total functions (example: for version V13, number of total functions= 5885)
- number of added data types (example: for version V13, number of added data types= 524)
- number of added functions (example: for version V13, number of added functions= 4656)
5.3 Utility of SEA in JHotDraw evolutions analysis
As shown in the two last paragraphs, the application of stereotypes <<evolution history>> and <<version>> adds explicit information about each version of JHotDraw (the thing that UML does not provide). This information makes packages that includes different versions being more expressive and informative about how JHotDraw (or any other software) evolves. This helps software developers to analyze easily the growth of JHotDraw at design phase and to take the right design decisions.
Let’s assume a scenario in which a software developer analyzes information marked explicitly on packages that represents JHotDraw versions (each package is stereotyped as <<version>>):
JHotDraw evolution analysis scenario based on SEA application We associate to each tagged value a metric from those presented above:
- number of total data types is represented by CNVi
- number of total functions is respresented by MNVi
- number of added data types is represented by ACV1
- number of added functions is respresented by AMV1
The table shown in Fig. 13(a) resumes values that are calculated basing on data collected from packages stereotyped as <<version>>. It shows variations of RACV1 and RAMV1 for each version Vi. The curve shown in Fig. 13(b) visualizes the progress of RACV1 and RAMV1 during 11 years. We remark that in all versions RAMV1 is greater than RACV1 which means that the percentage of added methods in each version comparing to initial number of methods in V1 is greater than the percentage of added classes comparing to initial number of classes in V1.
The fact that RAMV1 is always greater than RACV1 during 11 years of JHotDraw evolution indicates that maintenance tasks are applied more on methods. We could deduce in this case that software developers should recommend to use Visitor design pattern if it is not already used in JHotDraw.
| Vi | RACV1 | RAMV1 |
| V2 | 0.4 | 0.54 |
| V3 | 1 | 1.21 |
| V4 | 1.03 | 1.28 |
| V5 | 1.03 | 1.28 |
| V6 | 1.31 | 1.64 |
| V7 | 2.29 | 2.44 |
| V8 | 2.12 | 2.48 |
| V9 | 3.19 | 3.46 |
| V10 | 3.31 | 3.57 |
| V11 | 3.31 | 3.54 |
| V12 | 3.52 | 3.75 |
| V13 | 3.54 | 3.78 |
- Rates of added classes and methods number in a version Vi comparing to first version of JHoDraw V
- Rates evolution of added classes and methods number in a version Vi comparing to first version of JHoDraw V1.

Figure 13: Study of Rates evolution of added classes and methods number in a version Vi comparing to first version of JHoDraw V1.
Let’s now interpret evolutions from one version to its successor version. The table illustrated in Fig. 14(a) shows variations of RACVi−1 and RAMVi−1. We remark that RACV of version V2 is 0.4 and its RAMV is about 0.54 which means that version V2 of JHotDraw grows by 40% of V1 classes number and 54% of V1 methods number. Hence, maintenance tasks that switches V1 to V2 are applied more on methods (functions decomposition axis). This case occurs 5 times against 7 times in which maintenance tasks are applied more on classes (data-types decomposition axis). So, the switch from version to version shows that maintenance tasks change their behavior: they are applied 5 times with respect to functions decomposition axis against 7 times with respect to data-types decomposition axis. In this case, Composite design pattern seems to be the best choice for the future versions.
Lessons By analyzing JHotDraw evolutions as done above, we deduce that long-term evolution shows that Visitor design pattern is the best choice to optimize maintenance cost. But, variation in targeted decomposition axis due to the switch from version to version indicates that JHotDraw should change its architecture in order to keep maintenance being modular (software developers could use automatic reversible transformations among Composite and Visitor each time they remark that maintenance tasks would change behavior when switching from version to version).
| Vi | RACVi−1 | RAMVi−1 |
| V2 | 0.4 | 0.54 |
| V3 | 0.42 | 0.436 |
| V4 | 0.017 | 0.031 |
| V5 | 0.0 | 0.0 |
| V6 | 0.14 | 0.15 |
| V7 | 0.42 | 0.3 |
| V8 | -0.049 | 0.012 |
| V9 | 0.34 | 0.28 |
| V10 | 0.027 | 0.025 |
| V11 | 0.002 | -0.007 |
| V12 | 0.047 | 0.039 |
| V13 | 0.004 | 0.006 |
- Rates of added classes and methodsnumber in a version Vi comparing to version Vi−1.
- Rates evolution of added classes and methods number in a version Vi comparing to version Vi−1.
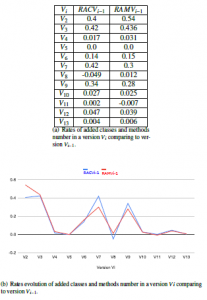
Figure 14: Study of Rates evolution of added classes and methods number in a version Vi comparing to version Vi−1.
6. Conclusion and future work
We have defined an UML profile called SEA which could help software developers to analyze and predict maintenance tasks in early activities of software process. To reify our approach we defined some stereotypes that support treating maintenance issue in design phase of software development. SEA treats three main issues related to software evolution:
- Analyzing and predicting maintenance tasks by defining stereotypes that allow to trace software evolution history. They permit also to precise software parts that are more probable to change in the future and those which could stay stable. This feature helps to recommend the right software architecture that supports changes without extra cost.
- Marking explicitly on class diagrams software parts that are encapsulated in modules and those that are crosscutting. For example, in Composite pattern, components classes represent data-types modules and methods/functions represent crosscutting concern. This feature permits to precise visually and easily modular concerns and crosscutting concerns, the thing that permits to identify quickly which kind of maintenance tasks is preferred.
- Visualizing in design phase design patterns that will be implemented later. This feature enhances software comprehension and helps to assimilate the chosen design pattern use and properties before implement it (sometimes programmers face difficulties to understand some design patterns). This could also give an overview about maintenance tasks that could be modular with respect to a given design pattern and those which could not. In the last case, software developers could use appropriate tools to switch program structure into another design pattern that is more convenient (such as automatic reversible transformation among Composite and Visitor [13]).
SEA is partially validated by apply it on JHotDraw evolution. This partial validation shows that it is possible to analyze software evolution history and predict the kind of maintenance tasks that could occur in the future. Our approach validation still partial until applying all SEA stereotypes to JHotDraw and also to other case studies. As a future work, we look for developing an algorithm based on supervised data analysis and classification to exploit data provided by SEA in models and diagrams to predict automatically future maintenance tasks kind.
Conflict of Interest
The authors declare no conflict of interest.
- M. M. Lehman, “Laws of software evolution revisited,” in 5th European Workshop on Software Process Technology (EWSPT’96), volume 1149/1996 of LNCS, 108–124, Springer, 1996.
- L. Erlikh, “Leveraging legacy system dollars for e-business,” in IT Profes- sional,, 17–23, 2000.
- E. Gamma, R. Helm, R. Johnson, J. Vlissides, Design patterns: elements of reusable object-oriented software, Addison-Wesley Longman Publishing Co., Inc., Boston, MA, USA, 1995.
- D. L. Parnas, “On the criteria to be used in decomposing systems into modules,” Commun. ACM, 15, 1053–1058, 1972.
- G. M. Rama, N. Patel, “Software modularization operators,” in IEEE Interna- tional Conference on Software Maintenance (ICSM), 2010.
- C. Szyperski, Component Software: Beyond Object-Oriented Programming, Addison-Wesley Longman Publishing Co., Inc., Boston, MA, USA, 2nd edition, 2002.
- G. Kiczales, E. Hilsdale, “Aspect-oriented Programming,” SIGSOFT Softw. Eng. Notes, 26(5), 313–, 2001, doi:10.1145/503271.503260.
- A. Ajouli, “A Shadow Structure for Modularity of Java Program Evolution,” in 2015 41st Euromicro Conference on Software Engineering and Advanced Applications, 39–42, 2015, doi:10.1109/SEAA.2015.28.
- P. Wadler, “The Expression Problem,” 1998, note to Java Genericity mailing list.
- K. B. Bruce., “Some challenging typing issues in object-oriented languages.” Electronic Notes in Theoretical Computer Science,, 82, 2003.
- C. Clifton, T. Millstein, G. T. Leavens, C. Chambers, “MultiJava: Design rationale, compiler implementation, and applications,” ACM Trans. Program. Lang. Syst., 28, 517–575, 2006.
- J. Garrigue., “Programming with polymorphic variants.” in ML Workshop,, 1998.
- A. Ajouli, J. Cohen, J.-C. Royer, “Transformations between Composite and Visitor Implementations in Java,” in Software Engineering and Advanced Applications (SEAA), 2013 39th EUROMICRO Conference on, 25–32, 2013.
- J. Cohen, R. Douence, A. Ajouli, “Invertible Program Restructurings for Continuing Modular Maintenance,” in Software Maintenance and Reengi- neering (CSMR), 2012 16th European Conference on, 347 –352, 2012, doi: 10.1109/CSMR.2012.42.
- A. Ajouli, K. Henchiri, “MODEM: an UML profile for MODEling and Pre- dicting software Maintenance before implementation,” in 2019 International Conference on Computer and Information Sciences (ICCIS), 1–5, 2019, doi: 10.1109/ICCISci.2019.8716421.
- R. Yongchang, X. Tao, L. Zhongjing, C. Xiaoji, “Software Maintenance Pro- cess Model and Contrastive Analysis,” 2011, doi:10.1109/ICIII.2011.324.
- H.-J. Kung, C. Hsu, “Software Maintenance Life Cycle Model,” 113 – 121, 1998, doi:10.1109/ICSM.1998.738499.
- I. Cote, M. Heisel, “A UML Profile and Tool Support for Evolutionary Require- ments Engineering,” 161 – 170, 2011, doi:10.1109/CSMR.2011.22.
- H. Marouane, C. Duvallet, A. Makni, R. Bouaziz, B. Sadeg, “An UML profile for representing real-time design patterns,” Journal of King Saud University – Computer and Information Sciences, 30(4), 478 – 497, 2018.
- J. Dong, S. Yang, “Visualizing design patterns with a UML profile,” in HCC, 2003.
- G. M. Ana Garis, Daniel Riesco, “Defining the Proxy Design Pattern using UML Profile,” in Software Engineering Project of National University of San Luis, 2006.
- K. Ngee Loo, S. Peck Lee, “Representing design pattern interaction roles and variants,” 6, 2010, doi:10.1109/ICCET.2010.5486125.
- J. Cohen, A. Ajouli, “Practical use of static composition of refactoring op- erations,” in ACM Symposium On Applied Computing, 6 pages, Portugal, 2013.
- R. Malhotra, K. Lata, “An empirical study on predictability of software main- tainability using imbalanced data,” Software Quality Journal, 28, 2020, doi: 10.1007/s11219-020-09525-y.
- M. Gogolla, Unified Modeling Language, 3232–3239, Springer US, Boston, MA, 2009, doi:10.1007/978-0-387-39940-9 440.
- L. Fuentes, A. Vallecillo, “An introduction to UML profiles,” UPGRADE, The European Journal for the Informatics Professional, 5, 2004.
- “Eclipse Papyrus,” https://projects.eclipse.org/projects/ modeling.mdt.papyrus.
- L. Hochstein, M. Lindvall, “Combating architectural degeneration: a survey,” Inf. Softw. Technol., 47, 643–656, 2005.
- N. Tsantalis, A. Chatzigeorgiou, G. Stephanides, S. T. Halkidis, “Design Pattern Detection Using Similarity Scoring,” IEEE Trans. Softw. Eng., 32, 896–909, 2006, doi:10.1109/TSE.2006.112.
- E. Gamma, I. Informatik, “JHotDraw as Open-Source Project,” http://www. jhotdraw.org/.
- “Source Forge: JHotDraw project,” https://sourceforge.net/ projects/jhotdraw/.
- K. Johari, A. Kaur, “Effect of Software Evolution on Software Metrics: An Open Source Case Study,” SIGSOFT Softw. Eng. Notes, 36(5), 1–8, 2011, doi:10.1145/2020976.2020987.