Analysis of qCON and qNOX Anesthesia Indices and EEG Spectral Energy during Natural Sleep Stages
 , Anaïs Espinoso, Juan Felipe Ortega, Umberto Melia, Carmen González, Erik Weber Jensen
Adv. Sci. Technol. Eng. Syst. J. 6(1), 1328–1333 (2021);
 DOI: 10.25046/aj0601152
The objective of this research is to study the behaviour of the anaesthesia monitor Conox during natural sleep to open the gate for this devices to assess subjects during this stage. The values of qCON and qNOX indices and EEG frequency bands are analysed during night sleep of 10 volunteers when they lose consciousness, in order to determine if they can be used for monitoring sleep. The possibility of using these indexes to differentiate between NREM/REM cycles of night sleep is studied. A reduction in the hypnotic index was observed while the nociception index stayed significantly higher. Statistical differences where found for qCON between sleep cycles, allowing this index to detect REM intervals and possibly opening the gate to use depth of anaesthesia devices to monitor sleep.
1. Introduction
This paper is an extension of work originally reported in 11th Conference of the ESGCO [1].
Sleep disorders such as insomnia, abnormal movements or behavior during night, and inability to control the sleep hours, can cause severe health problems such as depression or attention deficit hyperactivity disorder. Hence, sleep is widely studied in order to develop methods to detect these disorders by its monitoring. Some relevant laboratory tests for studying sleep disorders consists of an overnight polysomnography, measuring how fast the patients fall asleep and their attention for being awake as well as actigraphy [2]. Nowadays, there are commercial medical devices designed to monitor the level of consciousness during general anesthesia, allowing the anesthesiologists to individually tailor the administration of anesthetics. These devices monitor and process the electroencephalography (EEG) that is recorded by non-invasively locating electrodes on the forehead of the patient. The frequency and the amplitude of the EEG evolve because of changes in cerebral activity between wakefulness and sleep stages, and these variations can also be used to differentiate between the rapid eye movement (REM) and non-rapid eye movement (NREM) states of sleep. The energy of the EEG frequency bands Delta, Theta, Alpha, Beta and Gamma (from lower to higher frequencies) also varies between natural sleep stages according to literature [3], being the REM stage characterized by a decrease in the energy of low frequencies such as Delta band, and an increase in high frequencies as Beta and Gamma
bands. Previous studies [4, 5] have proposed to use EEG monitoring devices to measure also the natural sleep further than using them only for anesthesia assessment. In this work we analyzed the behavior of the anesthesia monitor Conox (Fresenius Kabi, Bad Homburg, Germany), during natural sleep. Sleep disorders such as insomnia, abnormal movements or behavior during night, and inability to control the sleep hours, can cause severe health problems such as depression or attention deficit hyperactivity disorder. Hence, sleep is widely studied in order to develop methods to detect these disorders by its monitoring. Some relevant laboratory tests for studying sleep disorders consists of an overnight polysomnography, measuring how fast the patients fall asleep and their attention for being awake as well as actigraphy [2].
Nowadays, there are commercial medical devices designed to monitor the level of consciousness during general anesthesia, allowing the anesthesiologists to individually tailor the administration of anesthetics. These devices monitor and process the electroencephalography (EEG) that is recorded by non-invasively locating electrodes on the forehead of the patient. The frequency and the amplitude of the EEG evolve because of changes in cerebral activity between wakefulness and sleep stages, and these variations can also be used to differentiate between the rapid eye movement (REM) and non-rapid eye movement (NREM) states of sleep. The energy of the EEG frequency bands Delta, Theta, Alpha, Beta and Gamma (from lower to higher frequencies) also varies between natural sleep stages according to literature [3], being the REM stage characterized by a decrease in the energy of low frequencies such as Delta
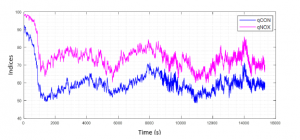
Figure 1: Mean qCON and qNOX for all volunteers from 15 minutes before loss of consciousness (qCON=60) until 4 hours after.
band, and an increase in high frequencies as Beta and Gamma bands. Previous studies [4, 5] have proposed to use EEG monitoring devices to measure also the natural sleep further than using them only for anesthesia assessment. In this work we analyzed the behavior of the anesthesia monitor Conox (Fresenius Kabi, Bad Homburg, Germany), during natural sleep.
2. Methods
In order to obtain the evolution of both anesthesia indexes during natural sleep, 10 volunteers were accepted for this study and agreed to be connected to a Conox device during one night sleep. Signal registration started a few moments before the subject falling asleep and lasted for at least six hours. As an indicator for unconsciousness, the same threshold as in clinical practice during a surgery was used, being a qCON value of 60. A Mann-Whitney U test and also a paired Wilcoxon test were performed in order to analyze if there was significant difference between the two indices. Instants of both indices falling below different thresholds (90, 80, 70 and 60) were also computed in order to know the time decay of each index when the subjects are losing consciousness.
From the EEG signal recorded we analyzed the spectrum in five frequency bands: Delta (0.5 – 4 Hz), Theta (4.5 – 8 Hz), Alpha (8.5 – 13.5 Hz), Beta 1 (14 – 20 Hz) and Beta 2 (20.5 – 30 Hz). Beta energy has been divided in two separate ranges for a better differentiation of the behavior of each frequency since the whole Beta range is very wide. The energy was calculated applying the Fast Fourier Transform (FFT) on 2-seconds EEG windows with overlap of 1 second. The FFT was normalized by the energy contained between the 0.5 and 30 Hz range. A 60 samples moving average smoothing filter was applied for a better visualization of the results, and the mean value of each frequency band was calculated during awake and asleep stages. It was considered that patients were awake when the qCON value was above 60, and asleep otherwise. To determine if there were significant differences between the values of the frequency bands between sleep and awake stages, a Wilcoxon signed rank test was used, at significance level of 0.05.
Taking into consideration the variation of energy in high and low frequencies, to distinguish between REM and NREM stages, we proposed an adaptive threshold for Delta and Beta 2 energy based on a preliminary data analysis which indicated that these frequency bands are the most affected by the transition between sleep stages. Delta threshold is calculated as the 80 % of the difference between maximum and mean energy values during the last 3600 seconds of recording. Beta 2 threshold is calculated as the 80 % of the difference between mean and minimum energy values during the last 3600 seconds of recording. We considered that a REM interval was detected when Delta energy was below the threshold and Beta 2 energy was above it, short intervals being less than 5 minutes were not considered.

Figure 2: Boxplots of Beta 1 (above) and Beta 2 (below) bands during awake (qCON ≥ 60) and asleep (qCON < 60) stages. On each box, the central mark is the median, the edges of the box are the 25th and 75th percentiles. The outliers are marked with a +.
We studied the values of qCON and qNOX during the REM and NREM stages previously identified, and we performed a Wilcoxon signed rank test, at significance level of 0.05, for comparison of the indices.
Table 1: Column 1 shows the mean value ± standard deviation of the qCON for each volunteer when below 60 and column 2 shows the corresponding mean value of qNOX when qCON is below 60. The last column shows the difference between the mean values of qCON and qNOX. The last row indicates the mean and the standard deviation for all volunteers, where qNOX has significantly higher values as compared with qCON. (*p-value = 0.002)
Table 2: Difference of time decay between qCON and qNOX to reach thresholds during the first loss of consciousness (N.A: not available due to qNOX always above the threshold).
3. Results
In Figure 1, average indices values across volunteers are shown and it can be observed that nociception (qNOX index) stays higher than consciousness (qCON index) during sleep. The differences between the two indices were statistically significant (p-value < 0.05,
Mann-Whitney U test). In Table 1 mean values of both indexes are compared when qCON is below 60 for every subject. Results confirm that qNOX was higher for all patients than qCON (p-value < 0.05, Wilcoxon paired test). Table 2 includes the differences of time decay between indexes, showing that qNOX takes more time to fall under all thresholds set than qCON, and in some case never decreases under those values.
The spectrum analysis of the EEG showed that the energy in the low frequency bands Delta, Theta and Alpha present no significant differences between awake and asleep stages (p-values > 0.05, Wilcoxon signed rank test). On the contrary, the energy from Beta 1 and Beta 2 did have significant differences and showed on average higher values while the volunteers were awake (Table 3). The difference in energy value of these bands for both stages can also be observed in Figure 2.
In Figure 3 we can observe the transition between NREM and REM intervals after applying the adaptive thresholds designed. It can be observed that these transitions occurred with certain periodicity during all recording.
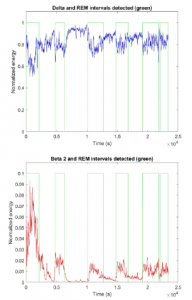
Figure 3: Delta (above) and Beta 2 (below) energy from one subject. The transition between REM and NREM, which corresponds with the moment where the value of Delta and Beta 2 pass their respective thresholds, is represented with the green line.
Table 3: Mean ± standard deviation values of the five selected EEG frequency bands for the periods where the subjects are awake and when they are asleep. P-value is obtained from a Wilcoxon signed rank test, at significance level of 0.05.
Table 4: Mean values of qCON during REM and NREM stages for each volunteer and Wilcoxon signed rank test between both sleep stages revealing statistically significant differences (p < 0.05).
Table 5: Mean values of qNOX during REM and NREM stages for each volunteer and Wilcoxon signed rank test, no significant differences were obtained (p > 0.05).
The results regarding the qCON and the qNOX values during the REM and NREM stages, previously delimited with the thresholds, showed significant differences in qCON values between stages (pvalue < 0.05, Wilcoxon signed rank test), which was not observed in qNOX values, as shown in Table 4 and Table 5 respectively. In the boxplot of Figure 4 there is a representation of the differences in the qCON values for REM and NREM.

Figure 4: Boxplot containing the values of the qCON index during the sections of NREM and REM of night sleep. On each box, the central mark is the median, the edges of the box are the 25th and 75th percentiles. The outliers are marked with a +.
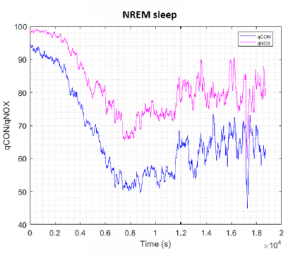
Figure 5: Mean qCON and qNOX for all volunteers during NREM interval. The indices have been aligned at the beginning of NREM interval of each subject.
The trends of the mean qCON and qNOX values for NREM and REM are shown in Figure 5 and Figure 6 respectively. The data of the volunteers has been aligned at the beginning of the REM interval that was around 5000 seconds for all cases. It can be noted from Figure 5 that in NREM sleep qCON and qNOX decrease until the minimum in the first part of the recording and then slightly increase in the last part, showing more variability. During REM sleep (Figure 6) qCON and qNOX time evolution decreases in the first part of the recording to a stable value that is maintained until the last part, where the index values are lower.
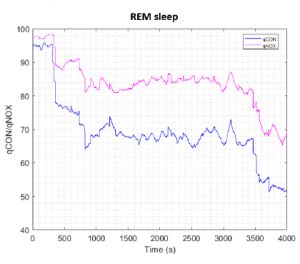
Figure 6: Mean qCON and qNOX for all volunteers during REM interval. The indices have been aligned at the beginning of REM interval of each subject.
4. Discussion
In this study it was found that qCON and qNOX indices behave differently during general anesthesia than compared to natural sleep. During anesthesia, anesthetic and analgesic agents are administrated to reduce both consciousness and nociception levels [6], whereas during night sleep, loss of consciousness is not accompanied by a similar nociception reduction.
Literature suggests that an increase in the energy of Beta is correlated with arousal during sleep [7], as higher values in this band are associated with an awake state. The increases in Beta during sleep found in this study could be related with sympathetic overactivity, which is associated with fragmented sleep [7].
Different NREM and REM sleep stages during natural sleep are characterized by changes in energy distribution in the frequency domain of EEG such as slow (Delta) and fast (Beta 2) oscillation patterns and also other physiological parameters. Indeed, in medical practice, polysomnography is considered the gold standard in sleep analysis because it takes into account several physiological signals such as electrooculogram (EOG) to identify rapid eye movements and electromyogram (EMG) to detect lack of muscular tone, which are characteristic physiological parameters of REM sleep [8]. Conox monitor performance is based on the processing of the EEG, hence it does not take into consideration as many parameters as a polysomnography. Despite that, from the results obtained in this study, qCON index has been able to correctly identify REM intervals
Other studies have been performed about depth of anesthesia monitors being used to monitor sleep since they provide real time EEG data that may be of some value for assessing sleep. A study performed with Sedline monitor (Masimo, Irvine CA) showed higher values during awake and the first parts of the sleep recording, as entering into deeper sleep stages the index of the monitor decreased considerably [5]. From the results obtained with the Conox it has been observed this same tendency, higher qCON values when awake and a decrease as the subject falls asleep. Nevertheless, qCON showed an increase during REM intervals, whereas the Sedline index continued at low values. Another sleep study performed with Bis Vista (Covidien, CO, USA) showed similar results than qCON during REM stage, with a mean (SD) BIS value of 75 (10) [9]. The mean (SD) value of qCON during REM interval was 64.81 (12.09), it is possible to differentiate this interval from an awake state where qCON values are higher.
In regard with nociception, qNOX index showed higher values during sleep than those observed in general anesthesia. Since qNOX index decreases with the administration of analgesic drugs, it could be expected to obtain higher values during sleep than in surgical procedures, where no analgesics are involved.
5. Conclusions
Analysis presented here allows to conclude that natural sleep is characterized by a reduction in consciousness which can fit into ranges similar to general anesthesia, especially during NREM sleep (qCON below 60), but that nociception (qNOX index) tends to remain higher, revealing that an asleep person can still respond to external painful stimuli. It has also been observed that when the subject is losing consciousness, the nociception index decreases slower than the consciousness index.
When studying the energy of the different EEG frequency bands, no significant differences were encountered in the low frequencies between the awake and asleep periods. Nevertheless, higher frequencies did show an increase in their energy when the subjects are awake.
By analyzing time series of energy contained in Delta and Beta 2 bands, one can identify cycles during night sleep. After studying qCON and qNOX indices evolution during these cycles, it can be concluded that qCON has greater values in REM intervals, whereas qNOX does not show significant differences between sleep stages. The significant differences of qCON values between NREM and REM cycles suggest that this index can also be used to differentiate these two stages of night sleep. The Conox monitor does not consider as many sleep parameters as the gold standard, polysomnography. Nevertheless, the present investigation is a preliminary study that might open the gate to use depth of anesthesia devices as Conox to monitor sleep, since it has proven to be able to detect the different sleep cycles by processing the energy of the EEG bands.
For future studies it would be interesting to consider a wider sample of patients, including some subjects with sleep disorders to observe differences in the results against healthy patients.
Conflict of Interest
The authors of this work Joana Canellas, Juan˜ Felipe Ortega, Umberto Melia, Carmen Gonzalez and Erik Weber´ Jensen are employees of Quantium Medical. Quantium Medical is the commercial developer of the indices qCON and qNOX.
- A. Espinoso, J. Can˜ellas, U. Melia, P. Gambu´s, C. Gonza´lez, E. Jensen, “Study of the evolution of the anaesthesia indices qCON and qNOX during natural sleep,” in 2020 11th Conference of the European Study Group on Cardiovascular Oscillations (ESGCO), 1–2, IEEE, 2020.
- S. Chokroverty, et al., “Overview of sleep & sleep disorders,” Indian J Med Res,
131(2), 126–140, 2010. - R. Ferri, F. I. Cosentino, M. Elia, S. A. Musumeci, R. Marinig, P. Bergonzi, “Re- lationship between Delta, Sigma, Beta, and Gamma EEG bands at REM sleep onset and REM sleep end,” Clinical Neurophysiology, 112(11), 2046–2052, 2001.
- C. McPherson, K. Behbehani, D. Dao, J. Burk, E. Lucas, “Characterization of sleep using bispectral analysis,” in 2001 Conference Proceedings of the 23rd Annual International Conference of the IEEE Engineering in Medicine and Biology Society, volume 3, 2216–2219, IEEE, 2001.
- C. Kapp, N. Punjabi, “Using a Sedation Monitor to Assess Sleep,” in B65. SRN: DIAGNOSIS AND MONITORING OF SLEEP AND SLEEP DISORDERS, A3884–A3884, American Thoracic Society, 2019.
- E. Jensen, J. Valencia, A. Lo´pez, T. Anglada, M. Agust´i, Y. Ramos, R. Serra, M. Jospin, P. Pineda, P. Gambus, “Monitoring hypnotic effect and nociception with two EEG-derived indices, qCON and qNOX, during general anaesthesia,” Acta Anaesthesiologica Scandinavica, 58(8), 933–941, 2014.
- T. B. Kuo, C.-Y. Chen, Y.-C. Hsu, C. C. Yang, “EEG beta power and heart rate variability describe the association between cortical and autonomic arousals across sleep,” Autonomic Neuroscience, 194, 32–37, 2016.
- “Polysomnography: Overview, Parameters Monitored, Staging of Sleep.” Available: https://emedicine.medscape.com/article/ 1188764-overview#a2 (visited on 18-12-2020).
- M.R. Benissa, S. Khirani, S. Hartley, A. Adala, A. Ramirez, M. Fernandez- Bolanos, M.-A. Quera-Salva, B. Fauroux, “Utility of the bispectral index for assessing natural physiological sleep stages in children and young adults,” Journal computing, 30(6), 957–963, 2016.