
Factors Impacting Digital Payment Adoption: An Empirical Evidence from Smart City of Dubai
Volume 6, Issue 1, Page No 1208-1214, 2021
Author’s Name: Anas Najdawi1,a), Zakariya Chabani2, Raed Said2
View Affiliations
1Faculty of Management, Amity University, Dubai, 12346, UAE
2Faculty of Management, Canadian University of Dubai, Dubai, 12346, UAE
a)Author to whom correspondence should be addressed. E-mail: anajdawi@amityuniversity.ae
Adv. Sci. Technol. Eng. Syst. J. 6(1), 1208-1214 (2021); ![]() DOI: 10.25046/aj0601137
DOI: 10.25046/aj0601137
Keywords: E-Payment Adoption, Digital Payment Technologies, Digital Transformation, Generations XYZ, Factor Analysis

Export Citations
The emergence of new digital payment technologies has introduced both opportunities and challenges across all industries. This research aims to examine the significant factors that influence the adoption of new e-payment technologies, specifically in smart cities, as in Dubai. A comprehensive theoretical framework based on several previous studies included the following factors; Perceived Usefulness, Perceived Trust, Perceived Personal Innovativeness, Perceived Ease of Use, Perceived Risk, and Generation Cohort. The results of this research confirm that all proposed factors significantly affect the adoption of e-payment in Dubai as a case of a smart city; however, the perceived usefulness is not as significant as the other factors. Moreover, comparative analysis across the three generations showed almost similar patterns of adopting e-payment systems.
Received: 02 January 2021, Accepted: 03 February 2021, Published Online: 25 February 2021
1.Introduction
E-payment is among the revolutionary changes caused by technology in the field of financial services that tremendously changed humans’ life by making them simpler and easier than before. Currently, e-payments have taken over the entire world of financial transactions whether these are meant for personal or commercial use [1] because it offers numerous benefits to the consumers including cost-effectiveness and conservation of time and energy. The UAE in general, and Dubai in particular, has extensively adopted new innovative e-payment systems with over 25 e-payment service providers offering more than 250 payment services for traffic fines, electricity bills, parking fines, university fees, etc… [2]. Moreover, the e-payment transactions in the UAE increased by 21% between 2015 and 2016, which represents $12.4 billion of goods and services [3] due to the Dubai government’s vision of creating the perfect smart city.
Despite their rapid growth, e-payment systems are not perfect. Some disfavors easily noticed, such as hacking risks, the high cost of setting-up, and upgrading the system. These disadvantages prevent some individuals from adopting e-payment systems. This paper investigates the key factors that influence the adoption of new e-payment technologies across several generations in smart cities such as Dubai. Consequently, help the organizations in Dubai, facilitating the adoption of innovative e-payment services through smart and effective design that is more conscious about the essential factors in the adoption criteria. The expansion of new e-payment adoption research allows companies and organizations to spend less effort and time, which can be invested in developing new e-payment services with more significant opportunities in the market.
A large number of studies employed the TAM or UTAUT models to investigate the factors affecting e-payment adoption. However, the framework proposed in [4] is considered more suitable for the goals of the current research. The study investigated the Malaysian consumers’ perception of e-payment and recommended the Benefits, Trust, Self-Efficacy, Ease of Use, and Security as the most critical factors affecting the consumers’ perception of e-payment. This research extended the previous frameworks by proposing the following factors: Perceived Usefulness, Perceived Trust, Perceived Personal Innovativeness, Perceived Ease of Use, and Perceived Risk. Moreover, the effect of age cohorts (X, Y, and Z Generations) on the previous factors and the users’ perception to adopt the e-payment system in Dubai is to be examined.
The research in [5], is the sole study among past studies that shed light on how Age influences the factors of e-payment adoption. However, only some of the factors (Perceived Ease of Use and Perceived Usefulness) were considered by the researchers, overlooking the impact of other significant factors.
In [6], the authors explored the factors affecting the adoption of e-payment systems among university students in the UAE. In this study, the researchers employed a modified TAM model in which the factor of trust was also incorporated. However, the population studied in this paper is limited to the university’s students only. Therefore, the age factor was not being taken into consideration. The authors addressed students residing in all the emirates of UAE.
In [7], the authors adds to the previous work the demographic variables and e-payment channel adoption in the UAE. The current paper is organized as follows. Section 2 is dedicated to reviewing the previous works. Section 3 will represent our framework. The next section will be the description of the methodology used in order to accept or reject the proposed hypotheses. After that, the results are listed and discussed in Sections 5 and 6. The conclusions and different implications are provided in Section 7. Finally, the research limitations and recommendations for future studies are stated in Section 8.
2. Literature Review
2.1. E-payment systems
Similarly to all e-services, an electronic platform is essential for the functioning of e-payment systems. The e-payment supports various kinds of monetary transactions [1], including regular transactions like paying for grocery or utility bills as well as B2B transactions besides others, and thus, it enables the buyer and seller to reap the benefits of a faster and more convenient payments system [2].
Various modes of payment, including e-money, debit or credit cards, and internet banking, may be considered as E-payment [3]. Moreover, another important revolution in this context is the introduction of mobile money by various organizations. For instance, two of the most successful companies in terms of mobile money are Apple pay and Samsung pay [4].
The e-payment systems have numerous advantages. For instance, they offer faster monetary transactions waiving the need for long queues and waiting periods for payments and receipt of money. People can remotely perform the payment and receipt of money through their cell phones or another mode of payment. Additionally, the fees related to financial transactions when using e-payment systems are far less than transaction fees when using traditional ways in most countries, especially in Dubai. Even in the absence of direct fees, the consumer may have to bear indirect fees, such as transportation fees, to go to the bank to withdraw money or go to the store to buy goods and services.
However, e-payment systems also have some disadvantages, for instance, the security threat that users face when using the e-payment system, the Risk of hacking the system, which causes a loss of money and personal information. Another disadvantage would be the cost; although the cost will be less for users, some costs related to securing the system and installing or upgrading it could be relatively high.
2.2. Generations X Y Z characteristics
The ICTs are changing and transforming individuals and society in general. Various generations are characterized by different traits, preferences, behaviors, principles, and concerns [5]. Therefore, all people with the same characteristics are grouped in what is called a cohort.
The author serves as the bridge that connects the previous and current generations [8]. One of the prominent attributes of Gen X is its reliance on reviews of other people. They make purchase decisions only after thorough research and review of feedback posted by others to make better decisions regarding the purchase [9]. However, they witnessed ICT development and then information society; hence, they became more familiarized with technology [10]. They are adapting to technology very fast.
The author evolved amidst technological advancements and internet growth, allowing them to acquire tons of information without hassle. Gen Y has been introduced to the internet and technology since childhood; hence, they are thoroughly familiar with technology [11], [10], and Media is part and parcel of their lives since they grew in the era of information [12]; therefore, they are comfortable with technology and would prefer to communicate with e-mail or text than talking face-to-face [13] and focus significantly on technical information [14].
Using computers and the internet is part and parcel of Gen Z’s lives, who deem social media platforms as the basis of communication and interaction [10]. Therefore, they are excellent with all the digital devices, and they are almost unable to exist without these devices [15].
2.3. Related frameworks and theories
TAM stands for Technology Acceptance Model, which was developed by Davis with the aim to determine and forecast the factors that affect a system before implementing it. TAM was employed by the majority of researchers to develop the framework in order to investigate the factors that influence e-payment adoption. The TAM model identified two major factors; Perceived Usefulness and Perceived Ease of Use, which can be affected by external variables [16]. Later, it was adapted to include more factors; some researchers included Perceived risk, Security, Perceived advantage, Trust, Web assurance seals and Usability [17]. Others, adopted the Perceived Risk and Information on e-payment as additional factors. Adopted Trust, Self-efficacy, and Security as additional factors [18].
In [19], the author performing research on the e-payment adoption in the context of Iran, the factors of Usability (Perceived Ease of use) and Technological and transaction system, as well as access to protection rules (Perceived Usefulness), were used by the authors. Moreover, Technical security, Security reports, Transaction system, and Personal experience pertaining to e-payment systems were identified in [20] as external variables. While the Age was added as a moderating factor in [21].
Other researchers adapted the UTAUT model to incorporate the factor of trust while discarding the factor of user behavior. Another change made in this model was the substitution of Behavioral intention with Continuance Intention [22]
3. Research model and hypotheses
The theoretical framework employed for the current research is shown in Figure 1. This study is carried out to investigate the factors affecting the Emirate of Dubai residents’ perception of using e-payment. The relationships between the factors affecting the residents’ perception of using e-payment are used to develop the hypotheses in the following subsections. The factors we used in our conceptual model in light of prior findings from the literature are the following:
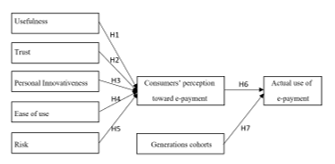 Figure 1: The Extended and Adopted Conceptual Framework
3.1. Perceived usefulness
Perceived usefulness implies the consumer’s perception regarding the effectiveness and convenience offered by e-payment systems in simplifying his daily transactions [23]. In other words, it is the benefits that a person can get from e-payment systems. E-payment systems provide the user with a convenient mean of payment and the ability to store and transport a currency value [24].
Moreover, e-payment systems can provide other benefits such as time and cost-saving. Usefulness is one of the most important factors for e-payment systems use [17], [18], [25], [26]. However, as per some researchers, considerable time and effort may have to be invested by the consumer to learn how to use the e-payment system [27]; therefore, e-payment systems may be costly rather than cost-saving systems. Thus, it is hypothesized that:
H1 – There is a significant relationship between perceived usefulness and consumers’ perception toward e-payments.
3.2. Perceived Trust
Perceived Trust in the context of e-payment systems implies the confidence bestowed by the user in the system regarding the reliability of the system in protecting the user’s personal data and money from misuse and theft [28] , [29].
Many researchers stated that a high level of trust is essential for an e-payment system adoption [29], [22]. Similarly, users’ concern over data privacy, internet security, etc., leads to a low level of trust, and thus, it will impact the adoption of e-payment systems negatively [32].
However, some researchers argue that trust alone is not sufficient to attract individuals adopting e-payment systems; for instance, if a reputed organization offers e-payment functions, the consumer will willingly use them; However, the user will hesitate in using the e-payment services provided by an untrustworthy organization [17]. Others found that trust is not significantly associated with individuals’ perception toward e-payment [20] [31]. Thus, it is hypothesized that:
H2 – There is a significant relationship between consumers’ perceived trust and perception toward e-payments.
3.3. Perceived personal innovation
Innovativeness is defined as the extent to which individuals consider themselves as technology leaders and pioneers [33]. This factor has been considered as an important factor influencing user’s adoption of e-payment systems [18], [34], [35]. Thus, it is hypothesized that:
H3 – There is a significant relationship between perceived personal innovativeness and consumers’ perception toward e-payments.
3.4. Perceived ease of use
Ease of use is defined as to which extent a person will not spend effort while using an e-payment system [23]. It can be attained via several factors, such as the content, design [29], information management, and speed [36]. E-payments systems can be affected significantly by these factors [37]. Previous researchers found that ease of use has a positive effect on the adoption of e-payment systems [18], [21]. Thus, it is hypothesized that:
H4: There is a significant relationship between perceived ease of use and consumers’ perception toward e-payments.
3.5. Perceived Risk
Risk is defined as the individual’s uncertainty about e-payment systems [38], due to their concern about fraud, theft, hacking, misuse of personal information, etc… Individuals may feel hesitant about the e-payment system due to Risk as an important factor influencing the adoption of the e-payment systems [39]. And the individuals’ concern about the system may be a barrier to its adoption [40].
Contrary to most studies, some researchers argue that there is no relation between Risk and intention to adopt e-payment systems; although the Risk affects the payment system’s adoption, it has no direct link; thus, individuals may use the system despite their concern [17]. Therefore, it is hypothesized that:
H5: There is a significant relationship between the perceived Risk and consumers’ perception toward e-payments.
3.6. Consumer’s perception towards the actual use of e-payment
User’s attitudes toward IT systems represent a paramount factor that influences a particular system’s actual use by individuals [16]. Thus, it is hypothesized that:
H6: Consumers’ perception toward e-payment has a positive effect on the actual use of e-payments
3.7. Generations XYZ
In the current study, the generation cohorts will be defined based on the results from the literature review as follow:
– Generation X (Gen X), born between 1965 and 1979
– Generation Y (Gen Y), born between 1980 and 1994, this generation is also commonly known as ‘Millennials’ and sometimes as ‘the children of Globalization’ [41].
– Generation Z (Gen Z), born between 1995 and Nowadays, this generation is also known as the “silent generation,” the iGeneration, generation quiet, and the next generation” [13].
The researchers believe that people from different generations do things differently when it comes to adopting e-payment systems in Dubai. Thus, it is hypothesized that:
H7: There are no significant differences among different generations toward the actual use of e-payments.
4. Methodology
The participants in this study were using e-payment in the emirate of Dubai. In this research, a nonprobability sample technique is used for collecting responses. Convenience sampling is a type of non-probability sampling where population elements are selected for inclusion in the sample based on access ease. In some cases, judgment sampling is used where the researchers’ judgment is used for selecting participants who are considered as representative of the population.
The survey was carried out using a self-administered online questionnaire, which consisted of two major sections. The first section comprises 10 questions intended to collect demographic information and some information about the use of e-payment. The second section contains 28 statements meant to examine those factors that influence the perception of using the e-payment. This section’s items essentially required the respondents to choose to what extent they agreed with each statement. The items were close-ended questions based on a 5-point Likert scale that each spectrum includes strongly disagree, disagree, no idea, agree, and strongly agree.
The proposed factors in accordance with the above hypotheses and the conceptual research framework constructed in section 3 are; Perceived Usefulness (abbreviated as PU), Perceived Trust (PT), Perceived Personal Innovation (PPI), Perceived Ease of Use (PEOU), Perceived Risk (PR), and Consumers’ Perception toward e-payment (CP). Notably, items of the questionnaire for each one of these factors were cautiously adapted from prior studies. However, the wording was kept as similar as possible across studies.
The pilot study was done on 20 consumers prior to its dissemination to satisfy face validity. Cronbach Alpha, which is a measure of reliability based on the internal consistency of the constructs, was calculated for each factor. The reliability for each factor was higher than the acceptable 0.75 limit that [42] suggests. The Cronbach Alpha for the data instrument in total was 0.913, indicating that the questionnaire has attained a rather high level of reliability. Hence, all items are retained.
Before the regression analysis, 7 variables were created. The items relating to each factor were added together for each respondent, and the average was found. The mean scores ranged from a possible score of 1 to 5, with 1 representing total disagreement with all stated items, and 5 representing total agreement with all stated items—two types of variables available in the research – dependent variable and independent variables. The main objective of this research is to investigate the predictors/variables that would determine the consumers’ perception of the use of e-payment in Dubai. In this study the independent variables are the PU, PEOU, PT, PR, PPI, and CP. These six independent variables would be tested to identify whether these variables possess an influence on the dependent variable, which is the actual use of e-payments (UEP).
5.Analyses and Results
5.1. Descriptive findings
We conducted an online survey to investigate factors affecting consumers’ perception of e-payment differences via generations based on our proposed conceptual framework. A total of 379 respondents visited the survey’s link, and 242 respondents (63.8%) completed the survey. Of the 242 respondents, 207 respondents (85.5%) were considered eligible for this study after we removed respondents who answered that they are not currently using any of the e-payment methods.
Table 1. Shows the demographic characteristics of the e-payment users in the Emirate of Dubai who use e-payment. From the respondents to the questionnaire, 52.9 % were male, and 47.1 % were female. 12.6 % of the participants have a year of birth less than 1980 (Generation X), 33.3% between 1980 and 1994 (Generation Y), and 54.1% born in 1995 or above (Generation Z). Twenty-two percent of the participants were married, and in terms of the current professional position, 12.1 % were Executive, 10.1% Non-executive, 2.4% Housewife, 61.4% students, 5.3% Self-employed, and 8.7% were in other positions. Also, 30 % of the participants had High school or lower, 12.6 Diploma, 37.7% Bachelor’s degree, 10.1% Masters and 9.7% Ph.D. holders. In term of the monthly income, the study found that 55.2% of the respondents having income below 10000 Dirhams, 14.3% between 10000 and 20000, 18.2% between 20000 and 30000, 5.9% between 30000 and 40000 and 6.3% having a monthly income above 40000 Dirhams
Table 1: Demographic characteristics of the sample (n=207)
| Criterion | Category | Frequency | % |
| Gender | Male | 109 | 52.9 |
| Female | 97 | 47.1 | |
| Generation | X | 26 | 12.6 |
| Y | 69 | 33.3 | |
| Z | 112 | 54.1 | |
| Marital Status | Single | 161 | 77.8 |
| Married | 46 | 22.2 | |
| Current Professional Position | Executive | 25 | 12.1 |
| Non-executive | 21 | 10.1 | |
| Housewife | 5 | 2.4 | |
| Student | 127 | 61.4 | |
| Self-employed | 11 | 5.3 | |
| Others | 178 | 8.7 | |
| Education | High school or lower | 62 | 30.0 |
| College (2 years program) | 26 | 12.6 | |
| Bachelor’s degree | 78 | 37.7 | |
| Masters | 21 | 10.1 | |
| Ph.D. | 20 | 9.7 | |
| Monthly Income | Below 10000 | 113 | 55.2 |
| 10000 up to less than 20000 | 29 | 14.3 | |
| 20000 up to less than 30000 | 38 | 18.2 | |
| 30000 up to less than 40000 | 12 | 5.9 | |
| 40000 or above | 14 | 6.4 | |
| Total: | 207 | 100 | |
5.2. Relationships between the factors affecting the Consumers’ perception towards e-payment
Table 2 shows the results of the regression model we have done so far using SPSS after we checked the assumptions of regression analysis. From these outputs, we conclude that the factors under investigation explained 78.2% of the variance of the consumers’ perception to use e-payments in Dubai. The remaining 21.8% of the variance can be explained by other factors not listed in our conceptual framework. As shown in the ANOVA table (Table 3), the minimal significance F indicates that our regression model is valid at a 0.05 significant level.
Table 2. Regression Model Summary
| Model | R | R Square | Adjusted R Square | Std. Error of the Estimate |
| 1 | .782a | .611 | .602 | .40269 |
| a. Predictors: (Constant), PR, PEOU, PPI, PT, PU | ||||
Table 3. ANOVA Table
| Model | Sum of Squares | Df | Mean Square | F | Sig. | |
| 1 | Regression | 51.303 | 5 | 10.261 | 63.274 | .000b |
| Residual | 32.595 | 201 | .162 | |||
| Total | 83.898 | 206 | ||||
| a. Dependent Variable: CP | ||||||
| b. Predictors: (Constant), PR, PEOU, PPI, PT, PU | ||||||
Table 4 shows the estimations of regression coefficients along with their t-ratios and probability values. It is seen that PEOU, PT, and PPI have a positive and statistically significant effect on the CP. In contrast, the PR has a negative and statistically significant effect on the CP. However, the results of Table 4 indicate that there is no significant relationship between PU and the CP (p-value 0.057). Therefore, hypotheses H2, H3, H4, and H5 of the present research have been validated, but there is no strong evidence to accept H1 at a 5% level of significance.
The sixth hypothesis of the study assumes that the consumers’ perception toward e-payment has a positive effect on the actual use of e-payment. To test this hypothesis, we used a correlation analysis. The result of the Pearson’s correlation coefficient between the consumers’ perception toward e-payment and the actual use of e-payments is significant at 0.01 level (r = 0.452, p-value=0.000). The findings support the stated hypothesis H6 and confirm that consumers’ perception toward e-payment has a positive effect on the actual use of e-payments
Table 4: Regression coefficients of the factors affecting consumers’ perception of e-payment
| Model | Unstandardized Coefficients | Standardized Coefficients | T | Sig. | ||
| B | Std. Error | Beta | ||||
| 1 | Constant | .656 | .239 | 2.742 | .007 | |
| PU | .144 | .076 | .143 | 1.911 | .057 | |
| PT | .116 | .056 | .110 | 2.073 | .039 | |
| PEOU | .446 | .077 | .452 | 5.782 | .000 | |
| PPI | .219 | .048 | .238 | 4.529 | .000 | |
| PR | -.096 | .034 | -.127 | -2.797 | .006 | |
| a. Dependent Variable: CP | ||||||
5.3. Differences among generations towards the use of e-payments
This section discusses the differences among generations towards the use of e-payments. As indicated in Table 5, the findings show that the respondents of generation X have a better agreement in using e-payments (average 4.10) than that of generation Y (with an average of 3.88) and of generation Z (with an average of 3.99). However, the value of the standard deviation (SD), reveals no significant differences between the respondents of generation X (SD=0.69) and the respondents of generation Z (SD=0.65). This contrasts with the respondents of generation Y (SD=0.97). This means there is a more significant difference among generation Y than the two other generations in regards to their perception to use e-payments.
Moreover, we used ANOVA test to verify the seventh and final hypothesis (H7). The hypothesis assumes a statistically significant difference in the consumers’ perception of respondents from different generations toward the use of e-payment. As illustrated in Table 6, the p-value is above 0.05 (Sig. = 0.425). This indicates that there are no significant differences in the consumers’ perception of respondents from different generations toward the use of e-payment. Therefore, the seventh hypothesis H7 is supported.
Table 5: Averages and Std. deviations of respondents from different generations toward the use of e-payment
| Gen. | N | Mean | Std. Deviation | Std. Error | 95% Confidence Interval for Mean | Min. | Max. | |
| Lower Bound | Upper Bound | |||||||
| X | 26 | 4.1026 | .69134 | .13558 | 3.8233 | 4.3818 | 2.33 | 5.00 |
| Y | 69 | 3.8841 | .97991 | .11797 | 3.6487 | 4.1195 | 1.00 | 5.00 |
| Z | 112 | 3.9970 | .65070 | .06149 | 3.8752 | 4.1189 | 2.33 | 5.00 |
| Tot. | 207 | 3.9726 | .77987 | .05420 | 3.8658 | 4.0795 | 1.00 | 5.00 |
Table 6: ANOVA Table of the respondents from different generations toward the use of e-payment
| Sum of Squares | df | Mean Square | F | Sig. | |
| Between Groups | 1.047 | 2 | .523 | .859 | .425 |
| Within Groups | 124.242 | 204 | .609 | ||
| Total | 125.289 | 206 |
6. Discussion
In the first hypothesis H1, Perceived Usefulness was found not to have a significant relationship with the consumers’ actual use of e-payment in Dubai. The finding was consistent with previous studies [27]. The result implied that regardless of the persons’ belief that using an e-payment system will enhance the performance of his day to day activities; consumers are more likely to use e-payment.
In the second hypothesis, H2, Perceived Trust was found to have a significant relationship with the consumers’ actual use of e-payment in Dubai. Similar results were demonstrated from previous studies [22], [29]-[32]. And this implied that a high level of trust is essential for an e-payment adoption.
Perceived personal innovation was found to have a significant relationship with the consumers’ actual use of e-payment in Dubai, which supported the third hypothesis H3, which was in line with many past studies. [18], [34], [35]. And this implied that the extent to which individuals consider themselves as technology leaders and pioneers is considered an important factor influencing the user’s adoption of e-payment.
Perceived Ease of Use was found to have a significant relationship with the consumers’ actual use of e-payment in Dubai, which supported the fourth hypothesis H4, which was in line with many past studies [18], [21], [37]. And this implies that ease to use of handling e-payment, such as convenience, speed, flexibility, simplicity, accessibility, and availability, is also considered a vital factor influencing the user’s adoption of e-payment.
Perceived Risk was found to have a significant negative impact found to have a significant relationship with the consumers’ actual use of e-payment in Dubai, which supported the fifth hypothesis H5. This was in line with many past studies [39], [40]. This implies that individuals’ concern about the system may be a barrier to its adoption.
In the sixth hypothesis, H6, the Consumers’ Perception toward e-payment was found to have a significant positive relationship with the consumers’ actual use of e-payment in Dubai. And this implied that the user’s attitude toward IT systems represents a paramount factor that influences the actual use of e-payment.
Finally, this study’s results did not show significant differences among the different generations toward the use of e-payment, which supported our seventh hypothesis, H7. This might be indicated that most consumers in Dubai, as a smart city, are sufficiently familiar with using e-payment and accepting any new technologies easily.
7. Conclusion and implications
In this paper, the researchers studied the effect of some factors that might affect the adoption of new e-payment services and technologies. Based on an extended framework that captures the unique status of smart cities such as Dubai that move faster in digital transformation rather than less developed ones. The extended framework included all of Perceived Usefulness, Perceived Trust, Perceived Personal Innovativeness, Perceived Ease of Use and Perceived Risk on the adoption of e-payment systems in Dubai while considering the age cohorts (X, Y, and Z generations).
The results show that most of the factors used in the study are indeed critical and significant to the users’ adoption of e-payment systems in Dubai. However, perceived usefulness is not as significant as the other factors; we think it is because some users care more about the system being easy to use than to be useful.
Unexpectedly, we found no serious differences between the generation cohorts regarding the adoption of e-payment in Dubai. We think that this due to the government of Dubai’s efforts to in digital transformation of all of its E-Government services, and the adoption of digital payments toward a cashless economy might be a reason. The results imply that the government’s strategies encourage consumers to use technologies in general as e-payment systems are working fine. This research will help future studies that focus on more recent technologies in the region based, such as adopting cryptocurrencies by individuals and businesses in the Middle East’s smart city context.
8. Study limitations and recommendation for future work
This study is not free from some limitations. And to begin with, the sample employed in our empirical analysis is collected by nonprobability sampling techniques. The use of a convenient sample limits the research results to the specific sample, which means that the findings cannot be generalized to a larger population [43]. Other factors and dimensions, including the individual differences, system characteristics, social influence, and facilitating conditions missing in this study, will be considered in future research.
Additionally, the exact e-payment channels and factors toward adoption in Dubai and the preferred e-payment methods should be conducted to understand how Dubai as a smart city is moving toward the digital transformation of e-payment channels and their diffusion among the consumers; this will compared to other smart cities in the region including Saudia Arabia and Singapore [44], [45] and my be focused on specific sector such as banking [46]. The expected results will be useful to financial institutions, government, and e-payment technology providers in this region and marketers and, will encourage the innovative design of e-payment services that are most likely will be adopted by individuals, businesses, and governments.
Conflict of Interest
The authors declare no conflict of interest.
- Z. J. Zuopeng and J. M. Sajjad, “Knowledge market in organizations: incentive alignment and IT support,” Industrial Management & Data Systems, 1101 – 1122, 2012. doi:10.2991/ijcis.d.191025.002
- T. Pikkarainen, K. Pikkarainen, H. Karjaluoto and S. Pahnila, “Consumer acceptance of online banking: An extension of the technology acceptance model,” Internet Research , 224-235, 2004. DOI: 10.1108/10662240410542652
- W. Chaiyasoonthorn and W. Suksa-ngiam, “The diffusion and adoption of electronic payment systems in bangkok,” International Journal of e-Business Research, 15(2), 102-115, 2019.doi:10.1086/261933
- J. M. Gray, “How apple pay coincides with the consumer financial protection act: will apple become a regulated entity,” Journal of High Technology Law, 170-194, 2015.
- S. Lissitsa and O. Kol, “Generation X vs. Generation Y – A decade of online shopping,” Journal of Retailing and Consumer Services, 31, 304-312, 2016. DOI: 10.1016/j.jretconser.2016.04.015
- S. A. Salloum and M. Al-Emran, “Factors affecting the adoption of e-payment systems by university students: extending the TAM with trust,” International Journal of Electronic Business, 371-390, 2018. DOI: 10.1504/IJEB.2018.098130
- A. Najdawi, . Z. Chabani, . S. Raed and O. Starkova, “Analyzing the Adoption of E-Payment Technologies in UAE Based on Demographic Variables,” in 2019 International Conference on Digitization (ICD), Sharjah, 2019. DOI: 10.1109/ICD47981.2019.9105908
- J.-G. Heaney, “Generations X and Y’s Internet banking usage in Australia,” Journal of Financial Services Marketing, 196-210, 2007.doi: 10.1057/palgrave.fsm.4760052
- E. Peralta, “Generation X: The Small But Financially Powerful Generation,” 17 September 2015. [Online]. Available: https://www.centro.net/blog/generation-x-the-small-but-mighty-generation/.
- E. Csobanka, “The Z Generation,” Acta Technologica Dubnicae, 6-10, 2016. doi: 10.1515/atd-2016-0012
- I. BAKANAUSKIENĖ, R. BENDARAVIČIENĖ and I. BUČINSKAITĖ, “EMPLOYER’S ATTRACTIVENESS: GENERATION Y EMPLOYMENT,” Human Resources Management & Ergonomics, X(1), 2016.
- M. Muda, R. Mohd and S. Hassan, “Online Purchase Behavior of Generation Y in Malaysia,” Procedia Economics and Finance, 37, 292 – 298 , 2016.doi: 10.1016/S2212-5671(16)30127-7
- J. G. Harber, “Generations in the Workplace: Similarities and Differences.,” East Tennessee State University, Johnson City, 2011.
- M. Rahulan, O. Troynikov, C. Watson, M. Janta and V. Senner, “Consumer behavior of generational cohorts for compression sportswear,” Journal of Fashion Marketing and Management: An International Journal, 87–104, 2015. doi: 10.1108/JFMM-05-2013-0072
- A. Kolnhofer-Derecskei, R. Zs. Reicher and A. Szeghegyi, “The X and Y Generations’ Characteristics Comparison,” Acta Polytechnica Hungarica, 14(8), 2017. doi: 10.12700/APH.14.8.2017.8.6
- F. D. Davis , “Perceived usefulness, perceived ease of use, and user acceptance of information technology,” MIS Quarterly, 19-340, 1989. doi: 10.2307/249008
- S. Ozkan , G. Bindusara and R. Hackney, “Facilitating the adoption of e-payment systems: theoretical constructs and empirical analysis,” Journal of Enterprise Information Management, 305 – 325, 2010. doi: 10.1108/17410391011036085
- C. Lin and C. Nguyen, “Exploring E-Payment Adoption in Vietnam and Taiwan,” Journal of Computer Information Systems, 51(4), 41-52, 2011.doi: 10.1080/08874417.2011.11645500
- M. Barkhordari, Z. Nourollah, H. Mashayekhi, Y. Mashayekhi and M. S. Ahangar, “Factors influencing adoption of e-payment systems: an empirical study on Iranian customers,” Information Systems and e-Business Management, 15(1), 89–116, 2017.doi:10.1007/s10257-016-0311-1
- E. Oney, G. O. Guven and W. H. Rizvi, “The determinants of electronic payment systems usage from consumers’ perspective,” Economic Research-Ekonomska Istraživanja, 30( 1), 394-415, 2017. doi: 10.1080/1331677X.2017.1305791
- A. Riskinanto, B. Kelana and D. R. Hilmawan, “The Moderation Effect of Age on Adopting E-Payment Technology,” Procedia Computer Science, 536–543, 2018. doi: 10.1016/j.procs.2017.12.187
- Indrawati and D. A. Putri, “Analyzing Factors Influencing Continuance Intention of E-Payment Adoption Using Modified UTAUT 2 Model,” in 6th International Conference on Information and Communication Technology, 2018. doi: 10.1109/ICoICT.2018.8528748
- S. Roy and I. Sinha , “Determinants of Customers’ Acceptance of Electronic Payment System in Indian Banking Sector – A Study,” International Journal of Scientific & Engineering Research, 177- 187, 2014.
- S. Chakravorti, “Theory of Credit Card Networks: A Survey of the Literature,” Review of Network Economics, 50-68, 2003. doi: 10.2139/ssrn.419944
- S. San Martín , B. López-Catalán and M. A. Ramón-Jerónimo , “Factors determining firms’ perceived performance of mobile commerce,” Industrial Management & Data Systems, 946-963, 2012. doi: 10.1108/02635571211238536
- Y. Chou, C. Lee and J. Chung, “Understanding m-commerce payment systems through,” Journal of Business Research, 1423 – 1430, 2004. doi:10.1016/S0148-2963(02)00432-0
- C. Kim, W. Tao, N. Shin and K.-S. Kim, “An empirical study of customers’ perceptions of security and trust,” Electronic Commerce Research and Applications, 84–95, 2009. doi:10.1016/j.elerap.2009.04.014
- T. Kongprapunt and N. Pupat, “FACTORS INFLUENCING GENERATION Y’S ONLINE PURCHASE INTENTION TOWARD XYZ ONLINE STORE IN THAILAND,” Assumption University GSB e-journal, 94-106, 2018.
- D. Abrazhevich, Electronic Payment Systems: a User-Centered Perspective and Interaction Design, Eindhoven: Eindhoven University of Technology, 2004.doi: 10.6100/IR575913
- S. Kurnia and B. Lim, “Exploring the Reasons for a Failure of Electronic Payment,” Journal of Research and Practice in Information Technology, 231-243, 2007.doi: 10.1007/s10660-011-9083-3
- W. M. Teoh, S. C. Chong, B. Lin and J. W. Chua, “Factors affecting consumers’ perception of electronic payment: An empirical analysis,” Internet Research, 23(4), 465-485, 2013.doi: 10.1108/IJBM-05-2013-0048
- N. B. Tasin, “Factors Influecing Customer’s Trust in Online Shopping Among Executives in a Bank,” Malaysian Journal of Social Sciences and Humanities, 47-60, 2017.doi: 10.47405/mjssh.v2i3.47
- A. Parasuraman and C. Colby, Techno-Ready Marketing: How and Why Your Customers Adopt Technolog, New York: The Free Pres, 2002.
- E. M. Rogers, Diffusion of Innovations, 5 ed., New York: Free Press, 2003.
- C. Kim , K. Takashima and S. Newell , “How do retailers increase the benefits of buyer innovativeness?,” Asia Pacific Journal of Marketing and Logistics, 571-586, 2018.
- M. Jun and S. Cai, “The key determinants of Internet banking service quality: a content analysis,” International Journal of Bank Marketing, 276-291, 2001.doi: 10.1108/02652320110409825
- P. Guriting and N. O. Ndubisi , “Borneo online banking: evaluating customer perceptions and behavioural intention,” Management Research News, 6-15, 2006. doi: 10.1108/01409170610645402
- S. Ram and J. .. sheth, “Consumer resistance to innovations: the marketing problem and its solution,” Journal of Consumer Marketing, 5-14, 1989. doi:10.5281/zenodo.1094243
- S. L. Jarvenpaa, N. Tractinsky and M. Vitale, “Consumer trust in an Internet store,” Information Technology and Management, 45-71, 2000. doi: 10.1023/A:1019104520776
- S. Sarin, T. Sego and N. Chanvarasuth, “Strategic Use of Bundling for Reducing Consumers’ Perceived Risk Associated with the Purchase of New High-Tech Products,” Journal of Marketing Theory & Practice Theory & Practice, 71-83, 2003. doi:10.1080/10696679.2003.11658502
- S. B. Berkup, “Working With Generations X And Y In Generation Z Period: Management Of Different Generations In Business Life,” Mediterranean Journal of Social Sciences, 5(19), 218-229, 2014. doi: 10.5901/mjss.2014.v5n19p218
- J. C. Nunnally, Assessment of Realibilty, IN: Pschometric Theory, New York: McGraw-Hill, 1978.
- J. Hair, R. Anderson, R. Tatham and W. Black, Multivariate data analysis, NY: Macmillan, 1998.
- K. Baskaran, “The impact of digital transformation in Singapore e-tail market,” International Journal of Innovative Technology and Exploring Engineering (IJITEE), 8(11), 2320-2324, 2019.
- A. R. Chaudhry, B. Rajput and R. Mishra, “Influence of IoT &AI in place making and creating Smart Cities,” in 2019 10th International Conference on Computing, Communication and Networking Technologies (ICCCNT), Kanpur, 2019.
- A. Mehrotra, “Artificial Intelligence in Financial Services – Need to Blend Automation with Human Touch,” in 2019 International Conference on Automation, Computational and Technology Management (ICACTM), London, 2019.