Recognition of Maximal Lift Capacity using the Polylift
Volume 6, Issue 1, Page No 121-127, 2021
Author’s Name: Jennifer Snell Ballard1,a), Jerry Lee2
View Affiliations
1Huntingdon College, Department of Sport Science and Physical Education, Montgomery, AL 36106, United States
2Alabama State University, Department of Physical Therapy, Montgomery, AL 36104, United States
a)Author to whom correspondence should be addressed. E-mail: jballard@hawks.huntingdon.edu
Adv. Sci. Technol. Eng. Syst. J. 6(1), 121-127 (2021); ![]() DOI: 10.25046/aj060113
DOI: 10.25046/aj060113
Keywords: Maximal Lift, Functional Capacity Evaluation, Polylift

Export Citations
Background: Occupational injuries are an issue of huge significance in the United States. After a work injury, health care providers often utilize functional capacity evaluations to determine readiness of a patient to return to work. However, it can be difficult to determine if a patient is providing maximal “effort” during the evaluation. The aim of this study was to determine if the use of the Polylift could assist in recognizing when a subject reached maximal lift capacity of a manual lift from waist to shoulder. The Polylift is a computerized data collection instrument that measures velocity, acceleration, distance, time, and force during lifting activities. Subjects: 42 healthy college students (20- males, 22- females) ages 20-27. Methods: Participants first performed repeated lifts from waist to shoulder until fatigue and the number of repetitions was noted. Using this information, Brzycki’s 1 Repetition Maximum (1RM) formula was used to predict each subject’s maximal load. Next, the Polylift recorded information during four lifts (25% of 1RM, 50% of 1RM, 75% of 1RM and 100% of 1RM). Results: The Polylift recorded a consistent, significant relationship between time and acceleration. As loads approached subjects 1RM, time required to lift the weight increased, and acceleration decreased in a predictable pattern. Conclusion: The Polylift assisted researchers in determining when a subject reached maximal lift capacity by demonstrating a significant decrease in acceleration and increase in time with progressively increasing loads.
Received: 02 November 2020, Accepted: 26 December 2020, Published Online: 15 January 2021
1.Introduction
Occupational injuries are an issue of huge significance in the United States. [1] reported that, “The medical and indirect costs of occupational injuries and illnesses are sizable, at least as large as the cost of cancer”. Employers bear the burdens of absenteeism, loss of productivity, increased health care, disability, and workers compensation costs after an employee is injured [2]. Often, the employee requires subsequent rehabilitation and may eventually participate in a functional capacity evaluation [3], [4].
Physical therapists, athletic trainers, and exercise physiologists often play vital roles in the case management of patients with a work injuries. These practitioners often participate in evaluation and treatment of musculoskeletal disorders, assist in injury prevention, provide ergonomic education, perform functional capacity evaluations, prescribe conditioning exercises, and complete pre-work screening activities [5]. Operating in that capacity, these providers first identify and address risk factors along with utilizing gross objective measurements and observation to ascertain an individual’s readiness to return to work, their ability to perform optimally on the job and most importantly assist in the prevention of re-injury.
A tool that practitioners often utilize within industrial medicine is the functional capacity evaluation (FCE). These evaluations are effective tools that are dynamic, comprehensive and mimic tasks such as lifting, carrying, reaching, squatting and gripping which are vital to effectively perform work functions [5], [6]. FCE’s are comprised of bending and lifting activities that directly relate to musculoskeletal disorders. According to the U.S. Bureau of Labor and Statistics, injuries involving the musculoskeletal system accounted for thirty-one percent of the total cases reported in 2015 and are typically diagnosed as sprains or strains [7]. After a diagnosis is made and skilled therapy services are completed, a FCE is often performed utilizing equipment such as handheld dynamometer, Purdue pegboard, weights, step ladder, sled station, weight box and workstation equipped with shelves, heart rate monitor, sphygmomanometer and a stop watch which is assist in collecting measurements. During the evaluation, practitioners rely on both subjective information, objective measurements and clinical judgement to assess many of the musculoskeletal aspects of the test [8].
One of the more popular methods of the evaluation, the kinesiophysical method, involves practitioners determining maximal lifting capacity by observing altered lifting mechanics and use of accessory muscles, which does not involve objective measurements or validated equipment [3]. Experienced clinicians possess excellent clinical judgment and observation skills, and are often required to express an opinion as to whether the patient is providing their maximal effort during lifting activities. While patients have been known to manipulate FCE results by conscious and unconscious efforts, there are certain variables that cannot be manipulated. In particular, as maximal effort and maximal weight loads are achieved, the expected outcome is slower time to complete the lift, along with decreased velocity and acceleration. Up to this point, validated technology that can produce data to assist in deciphering if maximal effort has been produced has not existed. While indicators such as mechanical breakdown, postural breakdown, recruitment of accessory muscles, and heart rate may be used, the application of these indicators is to some degree subjective and thus subject to question. Technology of this nature could improve credibility of reports by providing tangible evidence to accompany sound clinical judgement during functional capacity evaluations. Objective measurements of this nature would reinforce evidence provided in medicolegal cases [8]. A machine such as the Polylift has the ability to provide such objective data and improve the reinforce the credibility of a functional capacity evaluation [8], [9].
The Polylift is a mechanized, data collection machine that is constructed to mimic a lifting workstation. The machine consists of an adjustable rack with shelves equipped with a control module and sensors to detect motion within the sagittal plane (see Figures 1, 2, and 3). The control module contains the necessary hardware and software, microcontroller and other components to collect data from the sensors. The microcontroller is based on a Real-Time Operating System that scans the logic and Inputs/Outputs approximately every 5 ms. The sensors utilize matched LED emitter / receiver pairs to capture the users lift movement and provide data related to the time at which the user both begins and completes the lift. The lifting box includes grasping handles on each side and an area inside to hold various configurations of weights. The machine comes equipped with an electronic device (such as an I-pad) which communicates with and stores data in a cloud database. The lifting box triggers the sensors to obtain data in real time related to the movement, position, orientation, velocity and acceleration of the box while a user is lifting. Users can perform different combinations of lifts such as floor to waist, waist to shoulder and shoulder to overhead lifts. To collect data, the clinician first uses the computerized software application (located on the I-Pad) to identify which type of lift will be performed. Once the subject lifts the box, the lower LED emitter/receiver beam is triggered to start the timing of the lift and collecting data. When the upper LED emitter/receiver beam is triggered, the data collection ends for that lift and a time stamp is created. Information regarding the amount of time required to complete the lift, the average velocity and the average acceleration of the attempt is recorded by the computerized software application. The standing force plate also records the weight of the subject and provides data on the amount of foot pressure being placed through both feet throughout the lift. The electronic device (I-pad) collects data from lifts and can be used to perform one or more calculations, provide graphs of one or more lifts, and assist the health care practitioner in determining when maximal load is being reached. Data collected and displayed in the application of the I-pad electronic device includes the weight of the box and the weights therein, the distance of the lift from start to finish position, the time from start to finish of the lift, average velocity (in/s), average load applied to the force plate by the left foot and the right foot, and the foot disparity (%).
The goal of this study was to investigate the claims of the originators of the Polylift, who state that the machine is able to recognize that as the weight lifted by the participant increases, the velocity and acceleration of the lift decreases and the amount of time of the lift increases. In other words, as the weight that a subject lifts approaches their maximal lift capacity, researchers should note a significant increase in the time it takes to lift that load, with a subsequent decrease in velocity and acceleration. Note: the goal of this study was not to validate that the variables (time, velocity and acceleration) were being measured accurately by the machine. The Polylift is calibrated by an electrical engineer prior to use to ensure that those measurements are being accurately collected. The researcher’s main goal was to determine whether the machine was able to recognize the time increase and velocity and acceleration decrease as the participant approaches maximal lift capacity. The benefit of the Polylift is its ability to assist in determining whether maximal “effort” and lift capacity is being reached by a participant. If the machine is able to recognize the natural increase in time and decrease in velocity and acceleration that occurs as a participant approaches maximal lift capacity, then the machine can be considered a helpful device in objectifying maximal lift “effort” during functional capacity evaluations. The claims regarding the Polylift would then be validated if it accurately, and significantly produced data that agreed with Newton’s second law of motion (Force=mass x acceleration) indicated by a decrease in acceleration and increase in time with increasing load. Historically, health care practitioners have had to make judgement calls when determining whether patients were providing full effort during lifting activities. If the Polylift can objectify the normal relationship between time and velocity/acceleration during lifting activities, then practitioners will have a tool to mitigate the subjective aspect of the functional capacity evaluation. In this study, researchers wanted to determine if the Polylift could recognize a consistent, significant difference (increase) in the amount of time required to complete lifts as the subject approached maximal lift capacity. Researchers also wanted to determine if there was a concurrent significant decrease in acceleration as subjects approached maximal load.
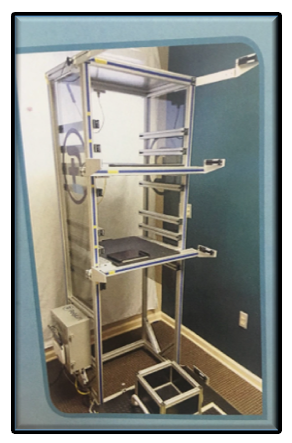 Figure 1: The Polylift (Permission granted for use by Polylift, LLC)
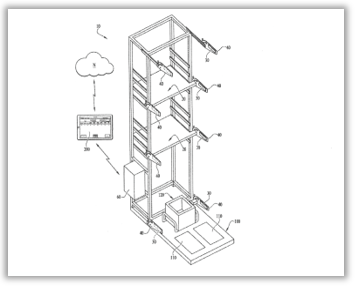 Figure 2: Illustration of the Polylift
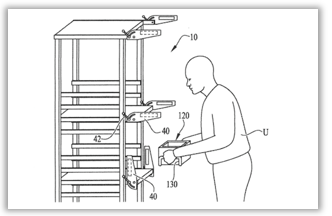 Figure 3: Illustration of a Subject Utilizing the Polylift During a Lift
2. Materials and Methods
To investigate the claims associated with the Polylift, two sets of data were collected. First, the participants’ one repetition maximum (1RM) was determined to quantify “maximal lift capacity” in each subject in order to have a baseline for “maximal effort”. Each participant performed repeated repetitions of a waist to shoulder lift at a submaximal level until they could no longer perform the lift with proper form. The number of repetitions performed was plugged into the Brzycki’s One Repetition Maximum (1RM) formula [10]. The results were used to determine the participant’s maximal lifting capacity. In the second portion of data collection, each participant performed a total of four waist to shoulder lifts. The weight of the first lift was 25% of the 1RM weight that was pre-determined. The second lift was 50%, the third lift was 75%, and the final lift was 100% of the pre-determined 1RM weight. The Polylift was utilized in this portion of the study to collect information regarding time, velocity and acceleration of each lift.
The subject sample was one of convenience drawn from healthy, uninjured college age students. Forty-two college students (20- Male, 22- Female), age 20 to 27 years old, volunteered to participate in this study. The exclusion criteria were as follows: any “yes” response noted on the Physical Activity Readiness Questionnaire (PAR-Q) [11], the presence of back pain within the last year, or any history of cardiac issues. Exclusion criteria was selected specifically to ensure the safety of the participants [12]. After clarity of the study’s purpose and procedures were established, all participants signed an informed consent form. Subjects were informed that they were free to withdraw from the study or stop testing at any time. Participation length requirement was a single day of data collection. A baseline heart rate measurement was utilized prior to beginning data collection to maintain an objective measurement for the subject’s safety, as well as serve as a baseline for continuing the second half of data collection.
2.1. Phase One Data Collection: One Repetition Maximum (1RM) Determination
A standardized lift from waist to shoulder was chosen to be performed for this study [13]. Waist to shoulder lifting is a commonly utilized technique in many Functional Capacity Evaluations. Safe lifting guidelines provided by the Occupational Safety and Health Administration Technical Manual 7 were utilized as protocol along with correct demonstration from an investigator [14]. Each subject’s 1RM prediction was calculated by using the submaximal repeated lift equation developed by Brzycki [10], [15]. Each subject’s starting lift load was chosen by using a standardized maximum lift chart based on the subject’s body weight [16]. All subjects were blind to the amount of weight placed inside the box. The starting waist position height was set at 35” from the floor, and the shoulder height at 55” from the floor [17], [18]. The subjects were instructed to perform the repeated lift as many times as possible with the same technique, speed, and form until fatigue [19], [20]. Prior to the investigation, operational definitions established by Gross et al. were observed by researchers in order to determine when maximal effort has been exceeded and when to safely stop the lift [8]. After completion of the repeated lift, the number of times each subject correctly performed the lift was inserted into Brzycki’s 1RM formula {Load Lifted/ 1.0278 – (reps x 0.0278)} for calculation [10]. Subjects were then required to take a minimum of fifteen-minute rest break. Each subject’s heart rate was re-measured to ensure that resting heart rate had returned to baseline level prior to beginning phase two of data collection.
2.2. Phase Two Data Collection: Polylift Data Collection
The second portion of data collection utilized a progressive resistance protocol along with the Polylift’s ability to record the objective measurements time, acceleration, velocity, and distance. The progressive resistance protocol involved one waist to shoulder lift of each of the following loads: 25% of 1RM, 50% of 1RM, 75% of 1RM, and 100% of 1RM. The subjects were completely blind to their established 1RM and the amount of load used for each single trial. The subjects were instructed to lift the box as quickly but as safely as possible from waist height to shoulder height shelf. The Polylift’s specialized data collection system was utilized, and the researchers carefully monitored to ensure that the subject maintained safe form and technique established with each lift. In between each trial, the subjects were allotted at least a one-minute rest break, as established by Matuszak et al. as sufficient time for recovery during 1RM testing [21].
3. Results
3.1. Descriptive Statistics
The criteria adopted to determine the 1RM produced results of subjects lifting between 12 and 65 pounds for 1-18 repetitions. Those results assisted in determining the computation of the subject’s 1RM using the Brzycki formula. The resistance progression is demonstrated in Table 1 below.
In table 1, the data demonstrates the variable load lifted between subjects during Phase 1 data collection ranging from 12-65 lbs. for the initial calculation of 1RM using the Brzycki formula. During Phase 2 of data collection, subjects lifted between 15.43-104.29 lbs. during the actual 1RM lift.
Table 1: Descriptive Statistics of Load Lifted by Test Subjects (n=42)
| Variables | Range | Mean | Standard Deviation |
| Phase 1 Load lifted (lbs.) | 12-65 | 38.262 | 15.800 |
| Phase 1 Repetitions | 1-18 | 7.929 | 4.319 |
| Phase 2: 25% of 1RM (lbs) | 3.86-26.07 | 12.394 | 6.095 |
| Phase 2: 50% of 1RM (lbs) | 4-52.14 | 24.700 | 12.331 |
| Phase 3: 75% of 1RM (lbs) | 11.57-78.21 | 37.182 | 18.285 |
| Phase 4: 100% of 1RM (lbs) | 15.43-104.29 | 49.577 | 24.382 |
Table 2: Mean Time & Acceleration during Trials of Progressive Resistance
| Variable | Mean Time
[s] |
Standard deviation for time [s] | Mean acceleration
[in/s2] |
Standard Deviation for acceleration
[in/s²] |
| 25% of 1RM | 0.342
|
0.117 | 245.104 | 196.385 |
| 50% of 1RM | 0.354
|
0.086 | 185.567 | 79.557 |
| 75% of 1RM | 0.416
|
0.100 | 132.909 | 52.687 |
| 100% of 1RM | 0.548
|
0.204 | 85.607 | 41.080 |
In table 2, the data demonstrates the mean time and acceleration change with each stage of progression. The results of this study demonstrate how the mean time consistently increases with each stage of progression from 0.342 to 0.548 seconds. Therefore, the Polylift collected data that demonstrates that as the weight gets heavier, the test subject requires more time to successfully lift the weight. The results also demonstrate a decrease in acceleration with each stage of progression.
3.2. Pearson Product Moment Correlation
In this study, subjects varied greatly in their fitness levels and ability to lift heavy loads. Therefore, to perform a correlation, the load lifted was calculated as a percentage of each subject’s body weight. A Pearson Product Moment Correlation was determined for each lift (25% of 1RM, 50% of 1RM, 75% of 1RM, and 100% of 1RM) for every subject and was compared to the velocity during each lift. Load lifted and velocity were found to be moderately negatively correlated r(166)= -.283, p<.001. Figure 4 displays this relationship.
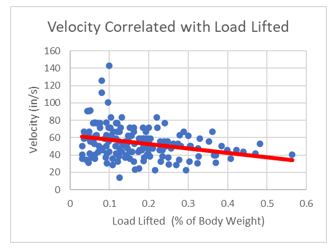 Figure 4: Velocity Correlated with Load Lifted (as % of body weight)
Table 3: Post-hoc Analysis Pairwise Comparisons for Time (LSD)
|
Mean Difference (I) Percent_1RM (J) Percent_1RM (I-J) |
Std. Error |
Sig.b |
95% Confidence Interval for Differenceb | |||
| Lower Bound | Upper Bound | |||||
| 1 | 2 | -.012 | .013 | .347 | -.039 | .014 |
| 3 | -.074* | .015 | .000 | -.105 | -.043 | |
| 4 | -.206* | .027 | .000 | -.261 | -.150 | |
| 2 | 1 | .012 | .013 | .347 | -.014 | .039 |
| 3 | -.062* | .011 | .000 | -.084 | -.039 | |
| 4 | -.193* | .025 | .000 | -.245 | -.142 | |
| 3 | 1 | .074* | .015 | .000 | .043 | .105 |
| 2 | .062* | .011 | .000 | .039 | .084 | |
| 4 | -.131* | .026 | .000 | -.184 | -.079 | |
| 4 | 1 | .206* | .027 | .000 | .150 | .261 |
| 2 | .193* | .025 | .000 | .142 | .245 | |
| 3 | .131* | .026 | .000 | .079 | .184 | |
3.3. Repeated Measures ANOVA (Time)
A repeated measures ANOVA was also conducted to analyze the time needed to lift 25%, 50%, 75%, and 100% of a test subject’s 1RM. There was a statistically significant effect on time across the four conditions, F(3, 123)=40.874, p<.001) with significance level set at p<.05. Post hoc analysis pairwise comparisons utilizing LSD method further revealed that there were significant differences (p<0.01) in time between all conditions except for between 25% of 1RM and 50% of 1RM(p=0.347). Figure 5 displays this effect and Table 3 outlines results of post hoc analysis.
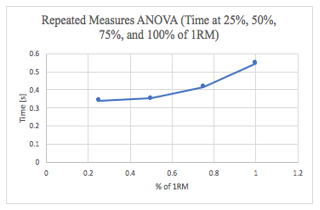 Figure 5: Time (seconds) Required at (1) 25%, (2) 50%, (3) 75%, and (4) 100% of 1RM (Repeated Measures ANOVA)
3.4. Repeated Measures ANOVA (Acceleration)
A second repeated measures ANOVA was conducted to examine the effects of acceleration at 25%, 50%, 75%, and 100% of 1RM. There was a statistically significant effect on acceleration across the four conditions, F(3, 123)=21.811 p<.001) with significance level set at p<.05. Post hoc analysis pairwise comparisons utilizing LSD method further revealed that there were significant differences in acceleration at 25%, 50%, 75%, and 100% of 1RM in all scenarios. Figure 6 displays this effect and Table 4 outlines results of post hoc analysis.
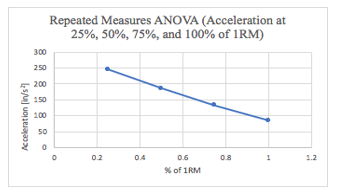 Figure 6: Acceleration at 25%, 50%, 75%, and 100% of 1RM (Repeated Measures ANOVA)
Table 4: Post-hoc Analysis Pairwise Comparisons for Acceleration (LSD)
| Mean Difference
(I)Percent_1RM_Accel(J) Percent_1RM_Accel (I-J) |
Std. Error |
Sig.b |
95% Confidence Interval for Differenceb | |||
|
Lower Bound |
Upper Bound |
|||||
| 1 | 2 | 59.537* | 26.200 | .028 | 6.626 | 112.448 |
| 3 | 112.194* | 28.061 | .000 | 55.525 | 168.864 | |
| 4 | 159.497* | 29.687 | .000 | 99.543 | 219.451 | |
| 2 | 1 | -59.537* | 26.200 | .028 | -112.448 | -6.626 |
| 3 | 52.658* | 8.971 | .000 | 34.541 | 70.775 | |
| 4 | 99.960* | 10.102 | .000 | 79.559 | 120.361 | |
| 3 | 1 | -112.194* | 28.061 | .000 | -168.864 | -55.525 |
| 2 | -52.658* | 8.971 | .000 | -70.775 | -34.541 | |
| 4 | 47.303* | 7.495 | .000 | 32.166 | 62.439 | |
| 4 | 1 | -159.497* | 29.687 | .000 | -219.451 | -99.543 |
| 2 | -99.960* | 10.102 | .000 | -120.361 | -79.559 | |
| 3 | -47.303* | 7.495 | .000 | -62.439 | -32.166 | |
4. Discussion
The pattern of the results suggests that as the weight lifted by the participants increased, the acceleration of the lift decreased and the amount of time required for each lift increased. The variables of load lifted and velocity were significantly negatively correlated, demonstrating that as each participant lifted a higher percentage of their body weight, the velocity decreased. This correlation was present despite the fact that the subjects varied greatly in individual fitness levels and ability to lift heavy loads. There were significant differences in the amount of time for a participant to lift 25%, 50%, 75%, and 100% of their 1RM. In comparing each of these four conditions, there was a significant increase in time required to lift the weight in all conditions except for 25% and 50% of the 1RM. There were significant differences in the acceleration required to lift 25%, 50%, 75%, and 100% of the participant’s 1RM. In comparing each of these four conditions, there was a significant decrease in acceleration between all four conditions.
A primary finding of this study is that the Polylift machine is able to recognize the variables of time and acceleration and display a consistent and significant relationship between these variables. As expected, when a person lifts a weight that is increasingly closer to their 1RM, the time required to lift this weight increases, and the acceleration of lifting this weight decreases. While this may be a well-known and understood fact, a device to measure and objectify this phenomena has not existed up to this point.
This study utilized established theories and validated calculations to assist in the investigation of claims related to the machine. Newton’s second law of motion, which involves the variables of mass and acceleration during the production of force, was the basis of the hypothesized outcome. The formula Force = Mass x Acceleration establishes an inverse relationship between the variables such that an increase in the force required to move an object of a higher weight would result in a decrease in acceleration. Because lifting involves an object being moved through space with either submaximal or maximal force, the time to move the heavier object from one point to the other should increase as the load increases. Advantageously, all of the mentioned variables involved in the task of lifting are able to be collected by the Polylift, as demonstrated in this study.
Another calculation involved in the study was the validated Brzycki formula which is a commonly used tool to assess muscle strength. In order to generate force, strength is a vital factor to successfully perform a lift and cause change in acceleration. The formula provided baseline data of the 1RM for each subject, which was used to progress the resistance in the second phase of data collection. The Polylift demonstrated the ability to detect changes in the variables. In reviewing the results, it was significantly demonstrated that the Polylift is able to indicate maximal lift capacity by accurately demonstrating a consistent decrease in acceleration with increasing loads due to the diminishing ability to generate force. In particular, the load lifted at 25% of 1RM and 100% of 1RM demonstrated the Polylift’s ability to detect a considerable difference in acceleration between both lifts.
It should be mentioned that there were some results during the 25% of 1RM lift that were not expected. When reviewed, these results produced slower acceleration rates when compared to the acceleration of the 50% 1RM lift. Researchers hypothesize that this can be attributed to the subject being cautious with the first trial after the completing submaximal lifts of a moderate weight in the initial data collection portion of the study. This occurrence brings to the forefront the many complex factors involved, especially the psychological aspect of lifting [22].
The data from this study suggests that the use of the Polylift to determine maximal lifting capacity will deliver measurable results indicated by the change in variables during the lifting procedure. The implications of these findings could be highly important as they can be applied during the functional capacity evaluation.
Limitations and Indications for Future Studies
Nacimento et al. determined that the Brzycki formula was most accurate when maximum repetitions ranged between 7-10 [23]. Our study included all results, with repetitions ranging between 1-18. This should be considered a limitation based on the premise that the repetitions sometimes went beyond the 7-10 range. Another limitation to be considered is the psychological aspect of performing the 1RM trials following repeated lifts during phase one data collection [24]. Many subject’s acceleration and velocity measurements were inconsistent during the first single trial at 25% 1RM, likely because of the subject’s expectation of a heavy load. A test trial with cueing for speed may be considered for future studies.
5. Conclusions
The significance of the results in this study demonstrate that the Polylift is able to indicate maximal lift capacity by accurately demonstrating a consistent decrease in acceleration with increasing loads due to the diminishing ability to generate force. Practitioners who are well versed in ergonomics and the area of human performance now have available to them a piece of equipment that provides objective measurements to assist in determining an individual’s readiness to return to work. The use of the Polylift during functional capacity evaluations and rehabilitation in general allows clinicians not to rely solely on their observational skills or subjective reports from the patient when full lifting capacity has been reached. The Polylift is able to reveal, through change in time and acceleration, if physical “effort” matches the expected outcomes. Conversely, if the machine does not identify an obvious increase in time with a decrease in acceleration, then the clinician can objectively assert that full “effort” and maximal lift capacity has not been demonstrated by the participant. The impact of this type of tool in functional capacity evaluations is significant and may be of great use to clinicians tasked with evaluating patients who have sustained industrial injuries. The Polylift assists in objectifying results and determining a patient’s readiness to return to work.
Conflict of Interest
The authors of this study have no business and/or financial interests in the Polylift or other potential conflicts of interest to disclose regarding this research.
Acknowledgment
Special thanks to Tony Bridges of Polylift LLC for donating equipment for research testing purposes and to Steve Windham for your expertise. Also, special recognition goes to Myrez Bosfield, DPT, Jouan Cox, DPT, and Ahmad Kaskas, DPT for their assistance in data collection and interpretation for this study.
- J. P. Leigh, “Economic burden of occupational injury and illness in the United States,” The Milbank Quarterly, 89(4), 728–772, 2011, https://doi.org/10.1111/j.1468-0009.2011.00648.x.
- N. Z. Ratzon, T. Jarus, A. Catz, “The relationship between work function and low back pain history in occupationally active individuals,” Disability and Rehabilitation, 29(10), 791–796, 2007, https://doi.org/10.1080/09638280600919681.
- S. J. Isernhagen, “Functional capacity evaluation: Rationale, procedure, utility of the kinesiophysical approach,” Journal of Occupational Rehabilitation, 2(3), 157– 168, 1992, https://doi.org/10.1007/BF01077187.
- J. J. Chen, “Functional capacity evaluation & disability,” The Iowa Orthopaedic Journal, 27, 121–127, 2007, http://www.ncbi.nlm.nih.gov/pubmed/17907444.
- S. J. Isernhagen, “Physical therapy and occupational rehabilitation,” Journal of Occupational Rehabilitation, 1(1), 71–82, 1991, https://doi.org/10.1007/BF01073281.
- R. J. Smeets, H. J. Hijdra, A. D. Kester, M. W. Hitters, J. A. Knottnerus, “The usability of six physical performance tasks in a rehabilitation population with chronic low back pain,” Clinical Rehabilitation, 20(11), 989–997, 2006, https://doi.org/10.1177/0269215506070698.
- U.S. Bureau of Labor and Statistics, “Nonfatal Occupational Injuries and Illnesses Requiring Days Away From Work, 2015,” 2016, Retrieved from www.bls.gov/iif/oshcdnew.htm.
- D. P. Gross, & M. C. Battié, “Reliability of Safe Maximum Lifting Determinations of a Functional Capacity Evaluation. Physical Therapy,” 82(4), 364–371, 2002, https://doi.org/10.1093/ptj/82.4.364.
- M. Lemstra, W. P. Olszynski, W. Enright, “The sensitivity and specificity of functional capacity evaluations in determining maximal effort: a randomized trial,” Spine, 29(9), 953–959, 2004, http://www.ncbi.nlm.nih.gov/pubmed/15105664.
- M. Amarante, E. S. Cyrino, F. Y. Nakamura, “Validation of the Brzycki equation for the estimation of 1-RM in the bench press,” Rev Bras Med Esporte, 13(1), 40-42, 2007, https://doi.org/10.1590/S151786922007000100011.
- D. E. R. Warburton, S. S. D. Bredin, V. K. Jamnik, N. Gledhill, “Validation of the PAR-Q+ and ePARmed-X+,” The Health & Fitness Journal of Canada, 4(2), 38-46, 2011, https://doi.org/10.14288/hfjc.v4i2.15.
- R. Adams, “Revised Physical Activity Readiness Questionnaire,” Canadian Family Physician Medecin de Famille Canadien, 45, 992, 995, 1004–1005, 1999, http://www.ncbi.nlm.nih.gov/pubmed/10216799.
- U. Abdul-Hameed, P. Rangra, M. Y. Shareef, & M. E. Hussain, “Reliability of 1-repetition maximum estimation for upper and lower body muscular strength measurement in untrained middle aged type 2 diabetic patients,” Asian Journal of Sports Medicine, 3(4), 267–273, 2012. http://www.ncbi.nlm.nih.gov/pubmed/23342225.
- Occupational Safety and Health Administration, “(OSHA) Technical manual,” 2014, https://www.osha.gov/dts/osta/otm/index.html.
- J. L. Mayhew, B. D. Johnson, M. J. Lamonte, D. Lauber, W. Kemmler, “Accuracy of prediction equations for determining one repetition maximum bench press in women before and after resistance training,” Journal of Strength and Conditioning Research, 22, 1570–1577, 2008, www.nsca-jscr.org.
- C. Kisner, L. A. Colby, J. Borstad, (2018). Therapeutic Exercise: Foundations and Techniques, (7th ed.), Philadelphia, PA: F.A. Davis Company, 2018.
- R. J. Savage, M. A. Jaffrey, D. C. Billing, D. J. Ham, “Maximal and sub-maximal functional lifting performance at different platform heights,” Ergonomics, 58(5), 762–769, 2015, https://doi.org/10.1080/00140139.2014.983185.
- Y. Blache, L. Desmoulins, P. Allard, A. Plamondon, M. Begon, “Effects of height and load weight on shoulder muscle work during overhead lifting task,” Ergonomics, 58(5), 748–761, 2015, https://doi.org/10.1080/00140139.2014.980336.
- R. L. Smith, “Therapists’ Ability to Identify Safe Maximum Lifting in Low Back Pain Patients During Functional Capacity Evaluation,” Journal of Orthopaedic & Sports Physical Therapy, 19(5), 277–281, 1994. https://doi.org/10.2519/jospt.1994.19.5.277.
- L. Gardener, K. McKenna, “Reliability of occupational therapists in determining safe, maximal lifting capacity,”Australian Occupational Therapy Journal, 46(3), 110–119, 1999, https://doi.org/10.1046/j.1440-1630.1999.00184.x.
- M. E. Matuszak, A. C. Fry, L. W. Weiss, T. R. Ireland, M. M. McKnight, “Effect of rest interval length on repeated 1 repetition maximum back squats,” Journal of Strength and Conditioning Research, 17(4), 634–637, 2003, http://www.ncbi.nlm.nih.gov/pubmed/14636099.
- M.E. Geisser, M.E. Robinson, Q.L. Miller, et al., “Psychosocial Factors and Functional Capacity Evaluation Among Persons with Chronic Pain,” Journal of Occupational Rehabilitation, 13, 259–276, 2003, https://doi.org/10.1023/A:1026272721813.
- M. A. Nascimento, E. S. do Cyrino, F. Y. Nakamura, M. Romanzini, H. J. C. Pianca, M. R. Queiróga, “Validação da equação de Brzycki para a estimativa de 1-RM no exercício supino em banco horizontal,” Revista Brasileira de Medicina Do Esporte, 13(1), 47–50, 2007, https://doi.org/10.1590/S1517-86922007000100011.
- G. M. Kaplan, S. K. Wurtele, D. Gillis, “Maximal effort during functional capacity evaluations: an examination of psychological factors,” Archives of Physical Medicine and Rehabilitation, 77(2), 161–164, 1996, http://www.ncbi.nlm.nih.gov/pubmed/8607740.
Citations by Dimensions
Citations by PlumX
Google Scholar
Scopus
Crossref Citations
No. of Downloads Per Month
No. of Downloads Per Country