
Parameters Degradation Analysis of a Silicon Solar Cell in Dark/Light Condition using Measured I-V Data
Volume 6, Issue 1, Page No 1151-1156, 2021
Author’s Name: Dominique Bonkoungou1,a), Toussaint Guingane1, Eric Korsaga1, Sosthène Tassembedo1, Zacharie Koalaga1, Arouna Darga2, François Zougmore1
View Affiliations
1Laboratory of Materials and Environment (LAME), University of Ouagadougou, Ouagadougou, 7021 Burkina-Faso
2Group of electrical engineering, Paris (LGEP) 11, rue Joliot Curie, Plateau de Moulon, 91192, Gif sur Yvette
a)Author to whom correspondence should be addressed. E-mail: bonkoung@gmail.com
Adv. Sci. Technol. Eng. Syst. J. 6(1), 1151-1156 (2021); ![]() DOI: 10.25046/aj0601129
DOI: 10.25046/aj0601129
Keywords: Parameters degradation, Dark condition, Light condition, Efficiency, Shade condition

Export Citations
In this paper, we investigate and analyze parameters degradation in a typical photovoltaic (PV) cell, which lead to power loss under dark as well as light condition using measured current-voltage (I-V) data. A nonlinear least squares method to extract the parameters such as the reverse saturation currents, the ideality factors, the series and shunt resistances of the cell from the dark current-voltage (I-V) curves is used. In order to analysis the sensitivity of the dark current-voltage (I-V) measurement to each of the six extracted parameters as a function of the voltage as well as the temperature and the density current, we simulate the operation of a silicon solar cell (KXB0022-12X1F). The analysis of the dark current-voltage (I-V) curves permit us to detect variation as small as 15% in the series resistance. We also extends the use of dark as well as light current-voltage (I-V) measurements to modules configurations of cells and uses a nonlinear least squares method to evaluate the cell efficiency parameters in the modules. Results obtained show a degradation of the values of the maximum power (Pmax) as compared to initial values by about 12, 3%, 12, 06% and 10, 21 % respectively in Total-Cross-Tied (TCT), Bridge-Link (BL) and Honey-Comb (HC) configurations.
Received: 26 December 2020, Accepted: 31 January 2021, Published Online: 25 February 2021
1.Introduction
The analysis of the current-voltage curves of solar cells parameters is an important tool for quality control and evaluation of their efficiency. Though photovoltaic (PV) cells are a very important source of electrical energy, some studies [1-5] show that in a number of ways, the photovoltaic (PV) cells/modules can fail. In the circumstances; it is very important to understand the origin and behavior of these faults, before trying to improve them. However, the analysis approach required for determining the source of power loss within a solar cell depend on the fault itself, and may necessitate an analysis process which adds to system operation costs and may not always be feasible [6-8]. Authors in [9] have classified the degradation of PV cells into groups such as early degradation and long-term degradation. Early degradation are defined as encapsulant discoloration and delamination; cracks in the cell [7, 8], burnt cell caused by hot spot; soiling and shading cell, defect in anti-reflective [9]. The early degradation are also inspected in long-term field-aged PV cells/modules. Long-term degradation can be defined as corrosion of solar joint or crack in solder joint of the PV cells connection [9]. Understanding the cause of PV cell fault and how they affect the efficiency of the PV cells is essential to improve their dependability.
In this paper, we will focus on investigating and analyzing some parameters degradation that lead to power loss in PV cells under dark/light condition using measured I-V data. The 2-diodes equivalent circuit is used to describe the electronic properties of the solar cell. A set of analyzed parameters are determined from the dark/light I-V characteristics that can identify some fault of the PV modules aggregation of electrical components and solar cells, as well as shunting and recombination losses occurring due to cell cracks, shading cell [8, 10]. An experimental setup for measuring both dark and light I-V characteristics of solar cells is performed for this purpose. It is a complementary study of a previous work in which parameters of a typical solar cell named KX0B22-12X1F have been extracted under dark condition. This work also extends the use of dark as well as light I-V measurements to modules configurations of cells and uses a nonlinear least squares method [11] to evaluate the cell efficiency parameters in the modules. Results obtained are used to analyze the shade impact in the PV cell efficiency and the effect of the cell imperfection on PV module efficiency.
2. Experiment
We have made measurement on 270 mm² silicon solar cell (KXB0022-12X1F). The I-V characteristics of the cell have been measured with a system according to international standard consisting of a Keithley 2400 multimeters; a sol-UV simulator (Oriel 81192/ 1000 W); an arc lamp source (Oriel -68920). A desktop computer is used to processes the measured data using LABVIEW. To measure the I-V curve under dark we used the procedure described into [11]. For light I-V curve measurements, the cell is illuminated by a halogen (ORIEL) .This last is fed by a halogen power supply. We performed two experiments for the measurements with homogeneous as well as heterogeneous impacts on light I-V curves. Pictures of the experiment approach are displayed in figure 1. Under dark condition, the data are measured in the forward and reverse direction using a power supply. For the power supply, the voltage is measured from – 5 Volts to 1 Volt with a resolution of 0.01 Volt. The maximum current was 1 A, which corresponds to 42.4 mA/cm².
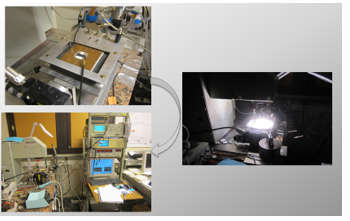 Figure 1: Experimental setup
3. Parameters extraction and fault analysis
3.1. I-V characteristics under dark condition
The 2-diodes model is used to describe the dark I-V curves of the PV cell [11].
![]() where is the thermal voltage, is the electron charge, is the Boltzmann’s constant, is the temperature; is the series resistance; is the dark saturation current of the diode; is the shunt resistance; is the ideality factor. In our previous work [11], the six parameters like are obtained by fitting (1) to a set of measured data using a nonlinear squares method of dark I-V measurement data. The standard deviation (SD) between the computed and measured data is less than 3% [11].
where is the thermal voltage, is the electron charge, is the Boltzmann’s constant, is the temperature; is the series resistance; is the dark saturation current of the diode; is the shunt resistance; is the ideality factor. In our previous work [11], the six parameters like are obtained by fitting (1) to a set of measured data using a nonlinear squares method of dark I-V measurement data. The standard deviation (SD) between the computed and measured data is less than 3% [11].
3.2. I-V characteristics under illuminated condition
To analyze the results obtained for the various parameters under dark condition [11], we have made additional measurements in light condition. Under illuminated condition, the PV cell generate a photocurrent and this last has to be added to (1) expressed by (2):
![]()
All the parameters are defined previously. To study the efficiency of the PV cell in light condition, it is important to analyze the following parameters such as: the open circuit voltage ( ), the short circuit photo-generated current ( ) and the fill factor ( ) [3]. For the determination of the cell parameters under illumination, we proceeded as follows. We have determined the value by assuming that the short circuit condition is verified i.e. for and . We get the following equation:
![]() Likewise, for and at open circuit condition, we obtain:
Likewise, for and at open circuit condition, we obtain:
![]()
Using (3) and (4), we yield a relationship between and given by equation 5:
![]() where .To fitting the illuminated I-V characteristics, we inserted the parameters values obtained in dark condition into (2) and determined as well as . For , we have exploited the value of given by (1) whose expansion for low voltages allows us to establish the following relation:
where .To fitting the illuminated I-V characteristics, we inserted the parameters values obtained in dark condition into (2) and determined as well as . For , we have exploited the value of given by (1) whose expansion for low voltages allows us to establish the following relation:
![]()
The fill factor (FF) can be calculated by means of the definition:
![]() where is the upper value of the voltage-current (V.I) product.
where is the upper value of the voltage-current (V.I) product.
4. Results and Discussion
4.1. PV cell parameters sensitivity analysis both in dark and light condition
In order to analysis the sensitiveness of the dark current-voltage measurement to each of the six parameters as a function of the voltage as well as the temperature, we simulate the operation of a typical solar cell (KXB0022-12X1F). The results are illustrated in Figure 2. A reference curve (Ref) has been defined on which the linked to the parameters such as , are relatively neglected. We analyze the different power losses by progressively degrading the parameters of the cell, one at a time. We varied the parameters such as , , and by increasing their value. During this time, we decreased the value of and . It can be seen in Figure.2 that increased impact the low value voltage as well as the medium voltage region of the dark I-V curve. This phenomenon can be explained by the increase of the number of fault in the cell junction. Unlike , the increase in affects both the medium and the high voltage ranges of the dark I-V curve. The sensitivity to and are important at low and medium voltage ranges. We can conclude that the increase in , , and affect and present distinct curvatures in the low and medium voltage ranges of the curve.
 Figure 2: Dark I-V curves of a particular solar cell (KX0B22-12X1F) affected by variant faults
Then, an exhaustive analysis of these different variations (see Figure 1) can make it possible to detect operating faults. Using the measured dark I-V characteristics, we analyzed the sensitivity of each extracted parameter as a function of the current, shown in Figure 3. The parameter β is defined as being the sensitivity ratio described as follow: where represents the different parameters i.e. , , , , and . These sensitivity coefficients show the dependencies of the solar cell parameters on the current level. As can be observed that for currents smaller than 400 mA/cm², the sensitivity coefficient to rises to 0, 3% as well as 0, 45% for . And at high current ranges, the sensitivity to increases from 0% to 0, 15% in the studied interval.
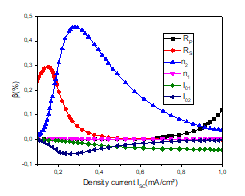 Figure 3: Sensitivity analysis of each extracted parameter as a function of density current
The increase of the value of drastically affect the high current and voltage regions shown in Figure 4. This shows that the analysis of the dark I-V characteristics of a solar cell is a very important tool which permit us to detect variations as small as 15% in . Besides, the disturbance of under dark condition made it possible to identify the faults which hinder the proper functioning of the PV cell, when we realize that the in a particular PV cell as well as module would have to double before a 5% drop in power resulted [12]. The analysis of disturbances in the other parameters such as can allow us to identify certain operating faults. And it could make easier to modify the manufacturing process to improve cell performance.
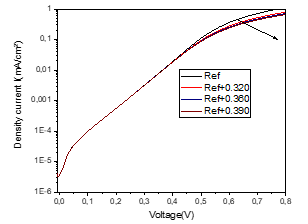 Figure 4: Effects of series resistance on the semilog plot of the dark I-V curves
Figure 5 presents the fitted and measured I-V characteristics of the PV cell in light condition. As can be noted that the fitted I-V curve agreed very well to the measured I-V characteristic. From this figure, one has determined the values of and by extrapolation to axis respectively to and by using equation 7.
The different parameters , and are directly obtained from the light I-V curve. The values of these parameters are given in Table1. In this table, we compares the fitted and measured data at room temperature. We can remark that the results obtained reveal a good approximation with the two Isc-Voc characteristics.
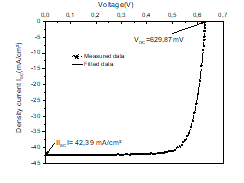 Figure 5. Fitted and measured light I-V curves at 300K.
Table 1: Measured and fitted parameters of the studied PV cell under illumination condition
| Parameters | ISC (mA/cm²) | VOC (mV) | FF (%) |
| Measured data | -42,39 | 629,87 | 72, 21 |
| Fitted data | -42,39 | 628,76 | 71,32 |
| Deviation (%) | 0 | -0,27 | -1,2 |
The plots in Figure 6 present the effects of temperature on the light I-V characteristics of a particular silicon solar cell. The plot clearly demonstrates that the open circuit voltage ( ) decreases with increasing temperature; whereas the short circuit current ( ) remains unchanged throughout the temperature range studied i.e. mA/cm². This shows that considerably depends on the temperature.
 Figure 6: Density current versus voltage for variant temperatures
In order to analyze the effect of partial or total shading on the studied PV cell, we performed two experiments for the measurements with homogeneous as well as heterogeneous impacts on light I-V curves. Firstly, we measured the light I-V curves of the PV cell with uniform irradiances at Standard Test Condition (STC: 1000 W/², 25° C; AM.1.5) shown in Figure 7; these data are used as a baseline for the future analysis.
 Figure 7: measured I-V characteristic of the studied PV cell under illumination in direct (a) and reverse (b) bias at STC
Secondly, we covered 25% (respectively 50% and 75%) of the area of the PV cell with a light-tight lid. Afterwards, the PV cell was illuminated over about 25% (respectively 50% and 75%) of its area. Results can be observed in Figure 8. It can be noted that the increase in the rate of shading of the cell produces a higher reduction of short circuit current , which causes a reduction in maximum power. It clearly demonstrate that the cell generated current is a function of the rate of light transmittance.
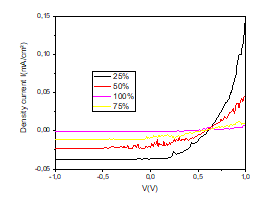 Figure 8: effect of partial shading of the studied PV cell on light I-V characteristics
4.2. Analysis of three (3) types cell interconnections under partial shade conditions
This section offers an extensive study of different reconfigurations of PV cells operating under partial shade conditions. For this purpose, we have studied the shading rate of 3 types of configurations such as Total-Cross-Tied (TCT), Bridge-Link (BL) and Honey-Comb (HC) of PV cells shown in Figure 9.
- TCT
- BL
- HC
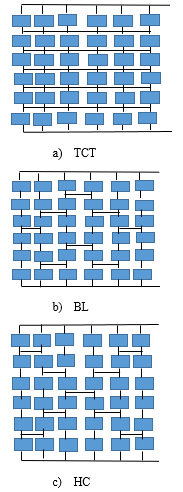 Figure 9: Types of 36 PV cells interconnection in a typical PV module
The results of shading rate of these configurations have been analyzed by shading completely selected cells in the PV module. Two experiments are made: firstly, one of the 6 X 6 PV cells is 100% shade for each type of configuration; secondly, nine (9) cells are 100% shaded and twenty-seven (27) working properly. I-V and P-V characteristics of these conditions are shown in Figures 10 and 11. First thing that can be observed is that there is a degradation of the power produced depending of the type of configuration. For the first experiment, shading one cell involve an efficiency decrease; for the second case, shading nine (9) cells involve efficiency to decrease further. We can note that in Figure 10, the values of the maximum power (Pmax) decreased as compared to initial values by about 12, 3%, 12, 06% and 10, 21 % respectively in TCT, HC and BL interconnections. Figure 11 proves that the decrease of Pmax can be imputed to the decrease of the short circuit current . The reduction in is explained by the rate of shading cells which limit the light transmittance. The influence of the number of shaded cell is presented in bar chart form in Figure 12. The TCT and BL configurations exhibit themself as the most
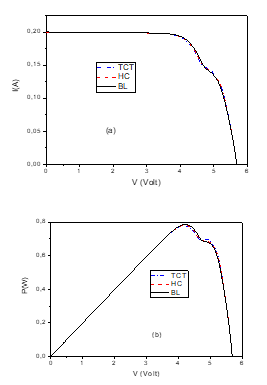 Figure 10: effect of shading one cell in a typical PV module (36cells) for three various configurations: (a) I-V curve and (b) P-V curve
 Figure 11: effect of shading nine cells in a typical PV module (36cells) for three various configurations: (a) I-V curve and (b) P-V curve
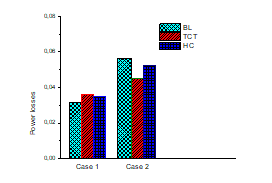 Figure 12: effect of the number of shaded cells on power losses
5. Conclusion
In this paper, an analysis parameters degradation in a typical PV cell, which lead to power loss under dark as well as light condition using measured I-V data was made. In order to analysis the sensitivity of the dark I-V measurement to each of the six extracted parameters as a function of the voltage as well as the temperature and the density current, we simulated the operation of a silicon solar cell (KXB0022-12X1F). The analysis of the dark I-V curves permit us to detect variation as small as 15% in the series resistance. We have also extended the use of dark as well as light I-V measurements to modules configurations of cells and uses a nonlinear least squares method to evaluate the cell efficiency parameters in the modules. Results obtained have shown a degradation of the values of the maximum power (Pmax) as compared to initial values by about 12, 3%, 12, 06% and 10, 21 % respectively in Total-Cross-Tied (TCT), Bridge-Link (BL) and Honey-Comb (HC) configurations. The decrease of Pmax could be imputed to the decrease of the short circuit current Isc. The reduction in Isc is explained by the rate of shading cells which limit the light transmittance.
Conflict of Interest
The authors declare no conflict of interest.
Acknowledgment
The authors wish to express their gratitude to the Laboratory of Materials and Environment (LA.M.E), Burkina Faso and the Group of electrical engineering, Paris (GeePs) who permit to realize the experimental setup.
- S. K. Firth; K.J. Omas, S.J. Rees,” A simple model of PV system performance and its use in fault detection ” Solar Energy, 84 (4), 2009, 624- 635, doi:10.1016/j.solener.2009.08.00
- M.A. Munoz, M.C Alonso-Gracia, N. Vela, F. Chenlo.,” Early degradation of silicon PV modules and guaranty conditions ” Solar Energy, 85(9), 2011, 2264- 2274 doi:10.1016/j.solener.2011.06.011
- J.I Van Molken, U.A. Yusufoglu, A. Safiei, H. Windgassen, R. Khandelwal, T. M. Pletzer, H. Kurz,” Impact of micro-cracks on the degradation of solar cell performance based on two-two model parameters” SiliconPV: April 03-05, Leuven, Belgium, Energy Procedia 27, 2012, 167- 172 doi:10.1016/j.egypro.2012.06.046
- E.L. Meyer and E.E. Van Dyk,”Assessing the reliability and degradation of photovoltaic module performance parameters”, 53(1), 83-93, 2004, doi:10.1109/TR.2004.824831.
- P. Hacke, R. Smith, K. Terwiliger, S. Glick, D. Jordan, S. Johnson, M. Kempe and S. Kurtz,” Testing and analysis for lifetime prediction of crystalline silicon PV module undergoing degradation by system voltage stress”, 38 th IEEE Photvoltaic specialists conference, Austin, TX, 2012, 001750-001755 doi:10.1109/PVSC.2012.6317933.
- D. Sera, S. Spataru, L. Mathe, T. Kerekes, R. Teodorescu,” Sensorless PV array Diagnostic method for residential PV system” 26 th European photovoltaic Solar Energy conference and exhibition, 2011, 3776- 3782, doi:10.4229/26thEUPVSC.2011-4AV.3.37
- A. Drews, A. C. de Keizer, H.G. Beyer, E. Lorenz, J. Betcke, W. G. J.H. van Sark, W. Heydenreich, E. Wiemken, S. Stettler, P. Toggweiler, S. Bofinger, M. Schneider, G. Heilscher, D. Heinemann,” Monitoring and remote failure detection of grid connected PV systems based on satellite observations ” Solar Energy, 81(9), 2007, 548- 564, doi:10.1016/j.solener.2011.06.011
- S. V. Spataru, D. Sera, P. Hacker, T. Kerekes, R. Teodorescu ” Fault identification in crystalline silicon PV modules by complementary analysis of light and dark current-voltage characteristics ” Progress in photovoltaics: research and applications., 2015, doi:10.1002/pip.2571.
- N.C Park, J.S. Jeong, B.J. Kang, D.H. Kim, “The effect of encapsulant discoloration and delimination on the electrical characteristics of photvoltaics module,” Microelectronics reliability 53(2013), , 1818-1822, doi:10.1016/j.microrel.2013.07.062.
- P. Hacke, K. terwilliger, R. smith, S. Glick, J. Pankow, M. Kempe, S. Kurtz, I. bennett, M. Kloos,” System voltage potential-induced degradation mechanisms in PV modules an methods for test” 37 th IEEE Photovoltaic Specialists Conference, Seatle WA, 2011, 000814-000820,, doi:10.1109/PVSC.2011.6186079.
- D. Bonkoungou, T. Guingane, E. Korsaga, S. Tassembedo, K. Zacharie, A. Darga, F. Zougmore” Measurement and analysis of the I-V-T characteristics of a photovoltaic cell: KX0B22-12X1F”, 8 International conference on smart Grid (icSmartGrid), Paris, France, 2020, 157-162 doi:10.1109/icSmartGrid49881.2020.9144904
- D.L.King, B. R. Hansen, J.A. Kratochvil, and M. A. Quintana, “Dark current-voltage measurement on photovoltaic modules as a diagnostic or manufacturing tool”. conference record of the twenty sixth IEEE Photvoltaic specialists conference, Anaheim, CA, USA, 1997, 1125-1128 doi:10.1109/PVSC.1997.654286.