Allocation of Total Congestion Cost and load participation to Generators for a PoolCo Market in Deregulated Power System

Adv. Sci. Technol. Eng. Syst. J. 6(1), 1145–1150 (2021);
 DOI: 10.25046/aj0601128
The objective of this paper is to allocate transmission congestion cost to responsible generators using a novel method. Deregulation of the electrical power system leads to the compulsion of open access to the transmission system for all entities of the power system. There is a trend to utilize cheaper generators by all loads. This leads to a violation of the operational and physical constraints of transmission corridors connected to those generators. It is not possible to utilize cheaper generators all the time due to the operational and physical constraints of the transmission lines. Hence there is an increase in the cost of energy produced. This increase in energy cost is taken into account as total congestion cost. Allocation of total congestion costs among various entities is always a complex task. Here, generators liable for the increase in total congestion cost identified using Bialek’s algorithm. Bialek’s upstream algorithm was applied to allocate congestion costs to generators. Results are obtained on IEEE-14 bus and IEEE-30 bus standard test systems.
1.Introduction
The electric power industry was operated as a “regulated monopoly” up to the nineties decade. Then after the structure of the electric power industry took a major shift and all its operations were unbundled, i.e. de-regulated. Because of the restructuring of the power utilities, the power industry is becoming turbulently competitive, and going through technological and regulatory changes, which affect its planning, operation, control, and services to customers. It is important to spot the consequences and impacts of those changes on the planning, operation, control and cost of the power system. In a deregulated power system, the transmission system must be available to all users without any discrimination. Due to physical and operating constraints of transmission corridors, not all the load be served by the cheaper generators, leading to the increased generation cost. The system operator (SO) must identify the responsible entity for this increase in cost. Determination of congestion cost and distribution of this among all participants is a crucial issue with the operation of a deregulated power grid.
Market-based methods are methods that used either dispatch methods, generator rescheduling, load management or nodal pricing based methods. Pool and contract dispatch models with a priority of load curtailment applied using social welfare and contracts between generators and load [1, 2]. Optimal bus price-based simple methods were proposed [3] to calculate congestion cost supported the very fact that additional flow increases congestion. Various dispatch methodologies introduce [4] for open access of transmission line by representing a conceptual model of pool dispatch, bilateral dispatch and multilateral dispatch alongside the need for dispatch coordination between these models. Effectiveness of congestion clusters method for congestion management discussed for cost and loss minimization [5] with the definition of transmission congestion distribution factors (TCDFs) which used to evaluate the change in the flow of a rise in the injection of power at any bus. Two sets of sensitivity indices: Real Power transmission Congestion distribution Factors (PTCDFs) and Reactive Power transmission Congestion Distribution Factors (QTCDFs) used for congestion management [6] during which selection and participation of generators depend upon both their reactive sensitivity and bid price for up/downregulation. A simplified approach proposed [7] for security-oriented power system operation in which the first contribution of each generator for a particular overloaded line is identified and then based on the relative electric distance (RED) concept the specified proportion of generation for the specified overload relieving obtained. A combined objective function [8] was obtained using the generation cost function and congestion management cost function incorporating additional penalty factors that were further solved by a bacterial foraging algorithm. A multi-objective congestion management framework with optimization of congestion management cost, voltage security and dynamic security called augmented ԑ-constraint technique discussed in which the first objective function is that the cost of congestion management while the second and third objective function is of voltage stability margin (VSM) and Corrected Transient Energy Margin (CTEM) [9]. Simple indices introduced [10] for effective and agreeable load curtailment in congested lines because of the sensitivity of load to a congested branch, economic incentives to reduce consumption and customer willingness to curtail load during congestion. These indices are achieved by mathematical formulation for maximizing social welfare, the overall index for possible load management and generator re-dispatch. Zonal congestion management approach discussed in[11,12], using real and reactive power sensitivity index as well as balancing energy up/down service settlement and other similar factors. Based on the calculation of the congestion cost index (CCI) total congestion cost index (TCCI) is minimized for a given number of buses [13]. CCI is obtained by difference of bidding rate and power during the pre-dispatch and re-dispatch era. Security constraint optimal power flow (SCOPF) with and without line flow constraints [14] used to determine total congestion cost which further distributed into line-wise congestion cost, whereas same SCOPF with inputs from energy management system (EMS) and state estimator applied iteratively [15] with contingency analysis used to estimate the actual cost of congestion. The participation of generators and loads within the use of the transmission network is decided employing a modified z-bus matrix [16]. The modified z-bus matrix is formed by modeling both generators and loads as constant admittances in the network considering them separately. A novel topological approach to MW-Mile proposed based on electricity tracing method [17]. The equation for topological generation distribution factor almost like that of generalized generation distribution factor defined, which further used for formation of supplement transmission charge of any generator in the network. Distributed energy sources (DERs) plays important role for alleviating transmission congestion cost. The usage based transmission cost division method is introduced in which transmission capacity is divided into four capacities to gauge the contribution of DERs to transmission cost [18]. A modified inage domain method for power flow tracing [19] used to allocate transmission cost and advance congestion management. Power tracking coefficient developed [20]with the help of kirchof’s law for the active power flow tracking and revenue collected by individual generator determined. A method [21] suggested allocating the transmission fixed charge based on the modification of the impedance matrix in which real power flow through the line expressed in terms of load current also as electrical distance and voltage injection at the bus. Iteratively one by one impact of every generator selected on the network using the z-bus of the network [22] and transmission congestion cost determined based on the current decomposition method. A DC power flow based problem [23] using generation shift factor is defined as a lossless system to work out contribution-based congestion cost allocation methods in a bilateral market.
A fair allocation of transmission congestion cost to the generation companies is required in poolco market where generator dispatch pattern changes due to congestion. Here in this work transmission line congestion is identified by observing the value of the dual variable associated with constraints [14]. Total congestion cost (TCC) evaluated by generator re-dispatch method with and without constraints. The dual variable associated with the congested line is utilized to find the line allocation factor. Line-wise congestion cost (LWCC) of each congested line is evaluated with help of the line allocation factor. For power flow tracing, results obtained from common methods like graph method and node method are not accurate and it takes more computational time. To allocate congestion cost, the cost associated with congested lines should only be considered. A novel method discussed here using bialek’s upstream algorithm [17,24] to allocate this TCC to all generators as well as the generator’s contribution to supplying the load of the system.
2. Problem formulation
2.1. Total Congestion Cost (TCC) and Allocation to Line
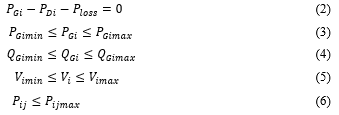
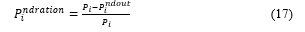
A simple method to evaluate TCC is the generator re-dispatch method. In this method, optimal power flow (OPF) is applied with and without line flow constraints. The difference in evaluated costs of both cases is identified as TCC. This TCC is allocated to the lines under congestion. Generalized optimal power flow problem with constraints is formulated as:
![]() where,
where,
Number of generators in the system
The above optimized problem is with several constraints as follows:
where,
= Active power generation in MW at bus i.
= Load in MW at bus i.
= Minimum limit of active power generation at bus i.
= Maximum limit of active power generation at bus i.
= Minimum limit of reactive power generation at bus i.
= Maximum limit of reactive power generation at bus i
= Voltage at bus i
= Maximum voltage limit at bus i
= Minimum voltage limit at bus i
= Power flow in MW between bus i and j
= Power flow limit in MW between bus i and j
In the above constraints (2) is power balance constraint whereas (3) to (6) are inequality constraints.
Following are steps to evaluated TCC and its allocation to the congested line:
- Run optimal line flow without and line flow constraints and obtain total generation cost (TGC) as per (1).
- With line flow constraints, repeat optimal power flow for obtaining a revised total generation cost (TGC’).
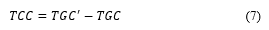
- Total congestion cost (TCC) is evaluated as:
 The dual variable associated with the constraint of (6) is utilized to obtain the line allocation factor as [14],
![]() where,
where,
= Dual variable associated with constrained line
= Actual line flow between bus i and j
= Maximum line flow limit between bus i and j
- Congested cost allocated to the constrained line is evaluated as:
![]() Equation (9) determines the line-wise congestion cost allocated to the constrained line from that of TCC.
Equation (9) determines the line-wise congestion cost allocated to the constrained line from that of TCC.
2.2. Generator share to line congestion cost
In poolco model of the deregulated power system, it requires to identify generators (suppliers) liable for line congestion as well as the allocation of congestion cost to those generators is equally important. For fair allocation of congestion cost to the generators, generator share to line flow is to be determined. Here bialek’s upstream algorithm [17,24] is employed to spot generators participation for the corresponding line flows from congested lines. The subsequent steps demonstrate to determine the sharing of line congestion cost to generators:
- After carrying out OPF, convert net real power into lossless line flows .
- Next to determine node injection power as,
![]() where,
where,
n = number of buses
j = node directly supplying to the node I
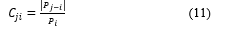
- The ratio of line flow to the node injection power, Generation cost coefficient (GCC), determined as,
 An up-stream distribution matrix evaluated whose elements are determined as,
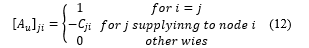 Take the inverse of the upstream distribution matrix evaluated with help of (12).
- Determine the topological distribution factor by,
 Generator share to line flow is determined as,
 Line congestion cost allocated to generators as,
![]() Distribution of line congestion cost to the generators on the proportional sharing base is obtained by (15).
Distribution of line congestion cost to the generators on the proportional sharing base is obtained by (15).
2.3. Generator participation to supply each load
With help of the same upstream algorithm suggested by bialek, generator participation to supply the load can be determined. Following are steps to be followed for evaluating the same.
- Power outflow from each node is determined as,
![]() For every node j connected to node i.
For every node j connected to node i.
- The ratio of net power flow to the node injection power is given as,
 Generator at node I participation to each load at bus j is calculated as,
![]() where,
where,
= Power generation at bus i
= Upstream distribution matrix evaluated in section 2.2
3. Results and Analysis
The problem formulated during the previous section was solved with help of MATLAB programming. Initially, test results are obtained on small test bus systems like 6-bus and 9-bus test systems. Then after standard IEEE-14 and IEEE-30 test bus systems are used for obtaining results. In this section, the results of higher test bus systems are discussed. These test results are obtained for TCC, line congestion cost, and share of generators to TCC as well as line congestion cost.
3.1. IEEE-14 bus test results
IEEE-14 bus test system is with 20 lines and 5 generators. Figure 1 shows the line diagram of IEEE-14 bus system. OPF is carried out without line flow constraints then after imposing line flow on line number 1 (connecting bus 1 and 2) and 4 (connecting bus 2 and 4). Generators’ cost function is of 3rd order polynomial function. Bus number 1 is considered as slack bus for OPF. After that TCC, line congestion cost and generator share to the TCC as well as generator participation to each load are obtained as described in the previous section.
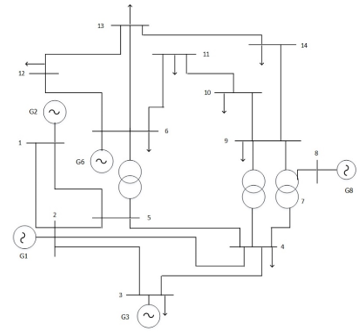 Figure 1: IEEE-14 bus test system
Table 1 shows the results obtained for the line congestion cost. Power flow without line flow constraints is 129.667 MW through line 1. With an imposing line flow limit of 110 MW, it is reduced to 109.94 MW. Similarly, for line number 4, after imposing a line flow limit of 40 MW, line flow is reduced to 38.392 MW from that of 55.3137 MW.
Table 1: IEEE-14 bus results for line congestion cost
| Line no | Fbus | Tbus | Pflow w/o constraints in MW | Pflow with constraints in MW | Max line flow in MW | Line constraints allocation factor | Line congestion cost in $/hr | Total congestion cost in $/hr |
| 1 | 1 | 2 | 129.667 | 109.94 | 110 | 0.493 | 28.53 | 57.88 |
| 4 | 2 | 4 | 55.3137 | 38.392 | 40 | 0.507 | 29.34 |
Total congestion cost is 57.88 $/hr, further allocated to the congested line from line constraints allocation factor is 28.53 $/hr and 29.35 $/hr. Equation (14) is for identifying generator share to line flows. For IEEE-14 bus system, the generator share to the line flows is shown in Figure 2.
As shown in Figure 2, generator 1 at bus 1 is responsible for the major contribution to the line flow because the generation of the generator is remarkably high compared to all other generators. Subsequent contributor to the line flow is generator 2 connected at bus 2, whereas other generators are contributing very less to the line flow. Table 2 shows the allocation of congestion cost to the generators from that of line congestion cost.
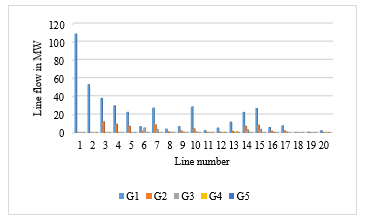 Figure 2: IEEE-14 bus generator share to line flows
Table 2: IEEE-14 bus line congestion cost allocated to generators
| From bus | To bus | G1 | G2 | G3 | G6 | G8 | Total | Line Cong Cost |
| 1 | 2 | 28.532 | 0 | 0 | 0 | 0 | 28.532 | 28.532 |
| 2 | 4 | 22.175 | 7.173 | 0 | 0 | 0 | 29.348 | 29.348 |
| Total Cost | 50.707 | 7.173 | 0 | 0 | 0 | 57.880 | 57.880 | |
All congestion costs are in $/hr in Table 2. As described in Table 2, generator 1 is sharing most of the line congestion cost as it is a major supplier to the load. It is observed that the summation of congestion cost shared by generators is equal to the total of the line congestion cost as well as that of TCC. Hence results of TCC and line congestion costs allocated to generators are self validated.
Generation participation to the system load is identified with help of bialek’s upstream algorithm described in section 2.3. . The total load of the IEEE-14 bus system is 259 MW and the total generation of the system is 264.13 MW. Following Figure 3 is depicting how each load of the system is shared by individual generators.
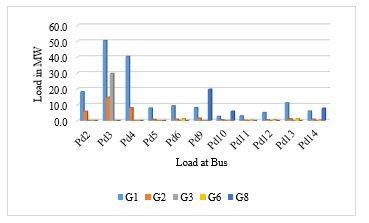 Figure 3: IEEE-14 bus load share by individual generators
Pd2, Pd3… Pd14 are the power demands (loads) at corresponding buses of the system. It is observed that generator 1 is sharing most load of the system followed by generator 2. This is in line with the sharing of line flow by all generators. Generation of generator 1 is 162.15 MW and so it serves a total load of 162.15 MW of the system with maximum sharing of 50 MW load connected at bus 2. Generators connected at bus numbers 1, 2 and 3 are supplying a load of 227.03 MW load, almost 85% of the system load.
3.2. IEEE-30 bus test results
Another standard test bus system, IEEE-30 bus system is used to get similar results as obtained on IEEE-14 bus system. As shown in Figure 4, IEEE-30 bus system having 41 lines along with six generators. The entire load connected to the system is 283.4 MW.
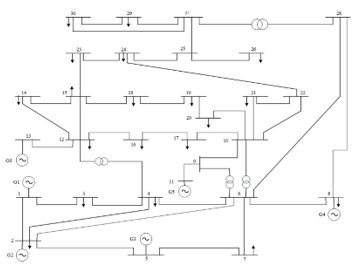 Figure 4: IEEE-30 bus system
TCC and line congestion costs are evaluated for the IEEE-30 bus system and the result obtained are tabulated in Table 3. Here, OPF is carried out without line flow constraints and then imposing line flow constraints on line one (connecting bus 1 and 2) and seven (connecting bus 4 and 6) to identify TCC. Allocation of TCC to line congestion cost is shown in Table 3.
Table 3: IEEE-30 bus results for line congestion cost
| Line no | Fbus | Tbus | Pflow w/o constraints in MW | Pflow with constraints in MW | Max line flow in MW | Line constraints allocation factor | Line congestion cost in $/hr | Total congestion cost in $/hr |
| 1 | 1 | 2 | 139.115 | 99.997 | 100 | 0.0511 | 8.16 | 159.48 |
| 7 | 4 | 6 | 55.314 | 38.393 | 40 | 0.9489 | 151.32 |
Here it is revealed that after imposing line flow limits, power flow reduced to 99.99 MW and 38.39 MW through line numbers one and seven. TCC evaluated is 159.48 $/hr due to congestion. With help of line allocation factors of every congested line, this TCC was further allocated as 8.16 $/hr for line number 1 and 151.32 $/hr for line number 7.
Figure 5 shows the line flow share of generators up to line number 20. Again in this case also generator 1 is sharing the remarkable load of the system, hence the line flow share of generator 1 is high compared to all other generators. For the remainder of the lines, it is noticed that only except that of generator 2, a generator connected at bus 4 (generator 4) is sharing somewhat of line flow particularly of line number 36 and 40.
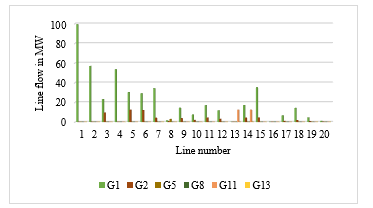 Figure 5: IEEE-30 bus generator share to line flows (up to line 20)
Table 4: IEEE-30 bus line congestion cost allocated to generators
| From bus | To bus | G1 | G2 | G3 | G4 | G8 | Total | Line Cong Cost |
| 1 | 2 | 8.16 | 0 | 0 | 0 | 0 | 8.16 | 8.16 |
| 4 | 6 | 134.84 | 16.48 | 0 | 0 | 0 | 151.32 | 151.32 |
| Total Cost | 143.0 | 16.48 | 0 | 0 | 0 | 159.48 | 159.48 | |
Table 4 states line flow congestion cost allocation to individual generators. Although IEEE-30 bus system contains a total of six generators, Table 4 shows five generators as only two generators (at bus numbers 1 and 2) are sharing line congestion cost. Here also the summation of individual sharing of line congestion cost by generators is equal to TTC and summation of line congestion cost.
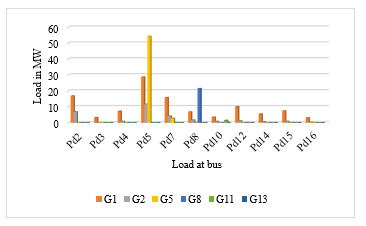 Figure 6: IEEE-30 bus load share by individual generators (first 11 loads)
 Figure 7: IEEE-30 bus load share by individual generators (Rest10 loads)
Figure 6 and Figure 7, show the load participating by all generators of IEEE-30 bus system. There are a total of 21 loads connected to various buses as shown in Figure 5 and Figure 6. Out of a total system load of 283.4 MW, generator 1 is sharing 155.2 MW of load, and generator 3 is connected at bus 5 sharing a load of 57.13 MW.
4. Conclusion
In this paper, a method is proposed to allocate TCC to congested lines with help of a dual variable associated with these congested lines. Further, a novel method discussed to allocate these line congestion costs to generators with help of bialek’s upstream algorithm of tracing the flow of electricity. Also, with help of the same algorithm formulation is done for the participation of system generators to each load connected to the system. Results are obtained for IEEE-14 bus and IEEE-30 bus test systems. Results obtained are self-validictory, and reveal that TCC is equal to the summation of individual line congestion cost as well as equal to the summation of individual congestion cost shared by all accountable generators. \
- A.K. David, R.S. Fang, “Congestion management of electric power systems under open transmission access,” IEE Conference Publication, (450), 469–474, 1998, doi:10.1049/cp:19971879.
- R.S. Fang, A.K. David, “Transmission congestion management in an electricity market,” IEEE Transactions on Power Systems, 14(3), 877–883, 1999, doi:10.1109/59.780898.
- T.W. Gedra, “On transmission congestion and pricing,” IEEE Transactions on Power Systems, 14(1), 241–248, 1999, doi:10.1109/59.744539.
- A.K. David, “Dispatch methodologies for open access transmission systems,” IEEE Transactions on Power Systems, 13(1), 46–53, 1998, doi:10.1109/59.651612.
- S. Charles Raja, P. Venkatesh, B. V. Manikandan, “Transmission Congestion Management in restructured power systems,” 2011 International Conference on Emerging Trends in Electrical and Computer Technology, ICETECT 2011, 23–28, 2011, doi:10.1109/ICETECT.2011.5760085.
- E. Muneender, D.M. Vinod Kumar, “Optimal rescheduling of real and reactive powers of generators for zonal congestion management based on FDR PSO,” Transmission and Distribution Conference and Exposition: Asia and Pacific, T and D Asia 2009, 1–6, 2009, doi:10.1109/TD-ASIA.2009.5356989.
- G. Yesuratnam, M. Pushpa, “Congestion management for security oriented power system operation using generation rescheduling,” 2010 IEEE 11th International Conference on Probabilistic Methods Applied to Power Systems, PMAPS 2010, 287–292, 2010, doi:10.1109/PMAPS.2010.5528719.
- A. Ramesh Kumar, L. Premalatha, “Security constrained multi-objective congestion management in transactional based restructured electrical network using bacterial foraging algorithm,” Proceedings of IEEE International Conference on Circuit, Power and Computing Technologies, ICCPCT 2013, (1), 63–67, 2013, doi:10.1109/ICCPCT.2013.6528913.
- M. Esmaili, N. Amjady, H.A. Shayanfar, “Multi-objective congestion management by modified augmented-constraint method,” Applied Energy, 88(3), 755–766, 2011, doi:10.1016/j.apenergy.2010.09.014.
- Y. Niu, Y.L. Cong, T. Niimura, “Transmission congestion relief solutions by load management,” Canadian Conference on Electrical and Computer Engineering, 1, 18–23, 2002, doi:10.1109/ccece.2002.1015168.
- J. Yu, J. Galvin, “Zonal congestion management and settlement,” Proceedings of the IEEE Power Engineering Society Transmission and Distribution Conference, 1(SUMMER), 249–254, 2001, doi:10.1109/pess.2001.970021.
- A. Kumar, S.C. Srivastava, S.N. Singh, “Congestion management in competitive power market: A bibliographical survey,” Electric Power Systems Research, 76(1–3), 153–164, 2005, doi:10.1016/j.epsr.2005.05.001.
- K.Y. Lee, S. Manuspiya, M. Choi, M. Shin, “Network congestion assessment for short-term transmission planning under deregulated environment,” Proceedings of the IEEE Power Engineering Society Transmission and Distribution Conference, 3(WINTER MEETING), 1266–1271, 2001, doi:10.1109/pesw.2001.917258.
- A. Jana, “A new approach to transmission congestion cost calculation,” 2008 Joint International Conference on Power System Technology POWERCON and IEEE Power India Conference, POWERCON 2008, 9–12, 2008, doi:10.1109/ICPST.2008.4745363.
- T.J. Overbye, “Estimating the actual cost of transmission system congestion,” Proceedings of the 36th Annual Hawaii International Conference on System Sciences, HICSS 2003, 2003, doi:10.1109/HICSS.2003.1173857.
- Y.P. Molina, O.R. Saavedra, C. Portugal, “Allocation of transmission network cost using modified Zbus matrix,” International Journal of Electrical Power and Energy Systems, 63, 323–330, 2014, doi:10.1016/j.ijepes.2014.06.007.
- J. Bialek, “Topological generation and load distribution factors for supplement charge allocation in transmission open access,” IEEE Transactions on Power Systems, 12(3), 1185–1193, 1997, doi:10.1109/59.630460.
- J.X. Wang, H.W. Zhong, Q. Xia, “A usage-based transmission cost allocation scheme considering impacts of DERs,” IET Conference Publications, 2016(CP705), 2016, doi:10.1049/cp.2016.1184.
- A. Baczynska, W. Niewiadomski, “Power flow tracing for active congestion management in modern power systems,” Energies, 13(18), 2020, doi:10.3390/en13184860.
- D. Bhowmik, A.K. Sinha, “An efficient cost based allocation approach for individual generators associated with the system,” Computers and Electrical Engineering, 70, 212–228, 2018, doi:10.1016/j.compeleceng.2017.12.040.
- J. Nikoukar, M.R. Haghifam, A. Parastar, “Transmission cost allocation based on the modified Z-bus,” International Journal of Electrical Power and Energy Systems, 42(1), 31–37, 2012, doi:10.1016/j.ijepes.2012.03.002.
- H. Zein, “Cost allocation of transmission usage based on current magnitude,” 2013 International Conference on Quality in Research, QiR 2013 – In Conjunction with ICCS 2013: The 2nd International Conference on Civic Space, 175–179, 2013, doi:10.1109/QiR.2013.6632560.
- M.P. Abdullah, M.Y. Hassan, F. Hussin, “Assessment of contribution-based congestion cost allocation using AC and DC for bilateral market,” PECon2010 – 2010 IEEE International Conference on Power and Energy, (2), 897–901, 2010, doi:10.1109/PECON.2010.5697706.
- J. Bialek, Tracing the flow of electricity, IEE Proceedings: Generation, Transmission and Distribution, 143(4), 313–320, 1996, doi:10.1049/ip-gtd:19960461.