Modeling Watershed Health Assessment for Five Watersheds in Lampung Province, Indonesia
Modeling Watershed Health Assessment for Five Watersheds in Lampung Province, Indonesia
Volume 6, Issue 1, Page No 99-111, 2021
Author’s Name: Eva Rolia1,a), Dwita Sutjiningsih1, Yasman2, Titin Siswantining3
View Affiliations
1Departmen of Civil Engineering, University of Indonesia, Depok, 16424, Indonesia
2Departmen of Biology, University of Indonesia, Depok, 16424, Indonesia
3Departmen of Mathematics, University of Indonesia, Depok, 16424, Indonesia
a)Author to whom correspondence should be addressed. E-mail: roliaeva@yahoo.com
Adv. Sci. Technol. Eng. Syst. J. 6(1), 99-111 (2021); ![]() DOI: 10.25046/aj060111
DOI: 10.25046/aj060111
Keywords: Indicator model, Influential indicators, Lampung Province, The watershed health assessment

Export Citations
A healthy watershed is important not only for the ecosystem but also for human socioeconomic activities. Therefore, a compatible assessment model is required to recognize watershed health. In Indonesia, the watershed health assessment is directed by the Ministry of Forestry regulation number 60/2014. A critic might be posed to this directive for not including the biotic aspects of the watershed. This research aims to assess the five watersheds in Lampung Province, Indonesia. Afterward, we develop a mathematical model using multiple linear regression analysis to identify influential indicators. In developing the model, we combined indicators in the Ministry of Forestry regulation number 60/2014 with the US-EPA directive to include the biotic indicators. To collect the data, we accessed secondary data officially launched by the authorities and did field observation if the secondary data is not available. Our assessment based on the Indonesian official regulation shows that 3 sub-watersheds are in unhealthy status while the rest can be categorized as healthy watershed. Furthermore, the mathematical model of the sub-watershed health assessment shows that the percentage of critical land and vegetation coverage plays an essential role in determining watershed health status. Besides, investment in the water-related infrastructure also significantly contributes to watershed health.
Received: 17 October 2020, Accepted: 28 December 2020, Published Online: 15 January 2021
1.Introduction
A watershed is an ecosystem where living organisms, biophysical elements, and chemical substances are interlinked and dynamically interact [1]. This ecosystem also plays an essential role in the dynamics of materials and energy flows. Therefore, the watershed deterioration might bring negative impacts on many sectors within various scales [2]. The watershed also has hydrological functions to accommodate rainwater overflow and to maintain the water quality. Besides, a watershed also acts as a compound ecosystem engaging natural landscape, economic activities, and social development [3]. Considering their important functions, all components of the watershed, which are generally categorized as input (i.e., rainwater), output (i.e., river flow, pollutants, sediments), and process (i.e., human activities, vegetation, soil, climate, and topography), are supposed to be well managed to meet basic requirements of ecosystem stability as well as socio-economic development [4–6].
Watershed health assessment refers to structural and functional measurement. To specify, the structural measurement is related to the issues of biodiversity, organic and inorganic resources, and physical attributes. Meanwhile, the functional measurement refers to the issues of ecological processes such as hydrology cycle, nutrient cycle, and energy flow [7]. In the watershed ecosystem, the hydrological biophysics process naturally occurs. It becomes a place for socioeconomic activities. Up to this point, the hydrological biophysics process is a part of the hydrology cycle while socioeconomic activities cannot be separated from human intervention to the watershed and the surrounding environments [1]. Indeed, the natural mechanisms and human interventions are inter-correlated and bring impacts one to another [8]. Therefore, more attention should be paid on the issue of watershed health to sustain human socioeconomic activities. The other way around, the socio-economic activities taking place on the watershed environments should be carefully managed to ensure watershed health.
Furthermore, various concepts are promoted to explore the issues of watershed health assessment. In [9], for instance, argued that the diversity in ecological and social structure and the ability to adapt with uncertainty are the key factors to maintain the mutual relationship between the watershed health and human activities taken place on the watershed environment. Thus, understanding the socio-ecological system is an essential approach to build sustainable and adaptive modern management [10]. Subsequently, various indicators have been developed around the globe to assess watershed health. For example, a report from the Lake Simcoe Region Conservation Authority (Canada) [11]used land, water, and social conditions as indicators to assess watershed health. Other indicators such as geological condition, groundwater, the quantity and quality of surface water, geomorphologic condition, aquatic system, cultural, natural recreation, and land use are indicators used to assess the watershed health in the Philippines [12]. Meanwhile, in Thailand, three main indicators namely climate and stream flow, stream water quality, soil erosion, and stream sediment are suggested as tools to do the watershed health assessment [13]. Besides geomorphologic and hydrological aspects, in China, living organism (e.g., flora, fauna, riparian vegetation) inhabiting the watershed are also counted in the watershed health assessment [14]while the United States refers its integrated evaluation of the watershed health assessment and protection on the condition of landscape, habitat, hydrology, geomorphology, water quality, and biology [15]. Furthermore, study in [16]considered the impact of climate variability on watershed health by analyzing the temporal and spatial variability of reliability, resilience, and vulnerability.
Indeed, indicators used in a certain location have respective benefits and drawbacks. Besides, they also depend on the local context. Indonesia, in particular, recognized two categories in determining the watershed health status. They are to be maintained and to be rehabilitated watershed. The assessment criteria are stated in the ministry of forestry regulation [17]to be a reference to develop watershed management planning and policy. The criteria are (1) land conditions; (2) the quality, quantity, and continuity of the water; (3) socio-economy and institutions; (4) water building investment; and (5) land use. In more detail, each criterion is broken down into several sub-criteria. To compare with other countries (e.g., the United States), the current indicators used in Indonesia do not include the biotic aspects of the watershed. Therefore, the determination of the watershed health status might be criticized since the existence of living organisms, either aquatic or terrestrial creatures, can be natural indicators to predict the quality of the water [18]. Another benefit to using biological indicators in the watershed health evaluation is that they also reflect physical and chemical characteristics of the water environment since the existence of living organisms are highly influenced by the physical and chemical environment [19], the more living organisms, the better water quality physically and chemically. Furthermore, macro-invertebrate and fish are usually used to indicate the river health because their disappearance represent environmental degradation either in local or regional scale [20].
Considering the importance of the biological indicators, we tried to add this aspect to the watershed health assessment in Indonesia. We took five watersheds in Lampung province, Indonesia as the case study areas. They are Sekampung, Seputih, Semangka, Mesuji, and Tulang Bawang. To introduce, Lampung province is located on the south-end of Sumatera Island. The five watersheds respectively have characteristics. For instance, the Sekampung watershed is the area with a dense population since it passes big cities and the capital of the province. Meanwhile, the Seputih watershed stretched from the north to the east part of this province. The land use of this area is dominated by rice field and horticulture cultivation. Farming activities also dominantly appear in Tulang Bawang and Mesuji watersheds. Nevertheless, rubber and palm plantations are the most common farming activities in these areas. Lastly, the land use of the Semangka watershed, which is located on the west part of Lampung province, is dominated by forest. Besides, farming activities, which mostly cultivate coffee, pepper, and clove, also appear in this area.
Furthermore, the objective of this research is to do a health assessment for these five watersheds using the Indonesian directive [17]and add the biological indicators to the assessment. Thus, we combined the assessment procedures proposed by the ministry of forestry and the US-EPA. Therefore, we compared our analysis with the health status attached to each watershed and investigated whether the biological indicators might change the current status. Moreover, we investigated the relationship between indicators and weighed the most influential ones to develop the indicator model. We weighed indicators resulted from the modeling to determine the optimum value of the watershed health using the linear regression statistical model.
2. Materials and Methods
In conducting this study, we did both secondary and primary data collection. At the beginning stage, we collected the secondary data related to hydrology and land cover of the watersheds. We also identified institutions that are in charge of the respective watershed as well as socio-economic activities that took place on it. We utilized data officially launched by the government institutions to elaborate on those indicators, which are required by the assessment method directed by the ministry of forestry. Furthermore, we analyzed indicators required by the US-EPA assessment method i.e., landscape, biology, geomorphology, habitat, water quality, and hydrology. Information related to these issues is gathered from the secondary data and the primary data as well. After gathering information about the indicators above, we analyzed the relationship between indicators using the multiple linear regression analysis. This stage aimed to optimize the use of indicators to assess watershed health. Eventually, we formulated policy scenarios and simulated through qualitative analysis.
This research was started by collecting information related to the current health status of the five assessed watersheds. Referring to the regulation launched by the Ministry of Forestry, we collected the data on five criteria. They are (1) land conditions; (2) water conditions (quality, quantity, and continuity); (3) socioeconomic and institutions; (4) investment; and (5) land use. In more detail, each criterion is broken down into more specific sub-criteria. The Ministry of Forestry regulation number 60/2014 also provides the formulas as a guidance to calculate all indicators. Furthermore, this regulation also provides the classification for each criterion and a justification for weighing. Then, based on this weighing procedure, we assessed the health status of the seventeen sub-watersheds in Lampung Province, Indonesia. In detail, the formula of the criteria, and the weighing system suggested by the Ministry of Forestry regulation number 60/2014 is presented in table 1.
Table 1: The Formula to Calculate Indicators Based on the Ministry of Forestry Regulation Number 60/2014 and the Scoring Justification
| Indicators (Formula) | Remarks | Scoring Justification | |
| Criteria | Score | ||
| Critical Land |
CL= Critical Land (%) ACL = The area of the critical land (Hectares) AW = The area of the watershed (Hectares) |
CL≤5 | 0.50 |
| 5<CL≤10 | 0.75 | ||
| 10<CL≤15 | 1.00 | ||
| 15<CL≤20 | 1.25 | ||
| CL>20 | 1.50 | ||
| Vegetation Coverage |
VC= Vegetation Coverage (%) AVC= The area of the vegetation coverage (Hectares) AW = The area of the watershed (Hectares) |
80<VC | 0.50 |
| 60<VC≤80 | 0.75 | ||
| 40<VC≤60 | 1.00 | ||
| 20<VC≤40 | 1.25 | ||
| VC≤20 | 1.50 | ||
| Erosion Index |
EI = Erosion Index Ai= The area of i-th segment Aw=The area of watershed EIi=Erosion index in i-th segment PEi=Predictive erosion in i-th segment TEi=Tolerable erosion in i-th segment |
EI≤0.5 | 0.50 |
| ; where | 0.5<EI≤1.0 | 0.75 | |
| 1.0<EI≤1.5 | 1.00 | ||
| 1.5<EI≤2.0 | 1.25 | ||
| EI>2.0 | 1.50 | ||
| Flow Regime Coefficient |
Qmax=Daily quantity (in the highest quantity year) QR=Reliable quantity Qav=Average quantity (within 10 years) |
FRC≤5 | 0.50 |
| ; where | 5<FRC≤10 | 0.75 | |
| 10<FRC≤15 | 1.00 | ||
| 15<FRC≤20 | 1.25 | ||
| FRC>20 | 1.50 | ||
| Annual Flow Coefficient |
AFC=Annual Flow Coefficient k=Conversion factor =(365 x 86,400)/10 Qan=Average annual quantity R=average annual rainfall AW=the area of the watershed |
AFC≤0.2 | 0.50 |
| 0.2<AFC≤0.3 | 0.75 | ||
| 0.3<AFC≤0.4 | 1.00 | ||
| 0.4<AFC≤0.5 | 1.25 | ||
| AFC>20 | 1.50 | ||
| Sediment Load |
SL=Sediment Load k=Conversion factor =(365 x 86.4) Cs=Sediment concentration (gram/Liter) Qan=Average annual quantity
|
SL≤5 | 0.50 |
| 5<SL≤10 | 0.75 | ||
| 10<SL≤15 | 1.00 | ||
| 15<SL≤20 | 1.25 | ||
| SL>20 | 1.50 | ||
| Annual Flood Event | Data on the annual flood is officially launched by the government | Never | 0.50 |
| Once in 5 years | 0.75 | ||
| Once in 2 years | 1.00 | ||
| Once in a year | 1.25 | ||
| More than once in a year | 1.50 | ||
| Water Usage Index |
WUI=Water Usage Index WRtot= Total water requirement HHtot=Total numbers of households |
WUI≤0.25 | 0.50 |
| 0.25<WUI≤0.50 | 0.75 | ||
| 0.50<WUI≤0.75 | 1.00 | ||
| 0.75<WUI≤1.00 | 1.25 | ||
| WUI>1.00 | 1.50 | ||
| Land Availability Index |
LAI=Land Availability Index Af=Area for farming activities HHf=Numbers f households that are farmers |
IKL>4 | 0.50 |
| 2<IKL≤4 | 0.75 | ||
| 1<IKL≤2 | 1.00 | ||
| 0.5<IKL≤1 | 1.25 | ||
| IKL≤0.5 | 1.50 | ||
| Population Welfare |
PW=Population Welfare HHpov=Numbers of households that are below poverty line living on the watershed area HHtot=total numbers of households living on the watershed area |
PW≤5 | 0.50 |
| 5<PW≤10 | 0.75 | ||
| 10<PW≤20 | 1.00 | ||
| 20<PW≤30 | 1.25 | ||
| PW>30 | 1.50 | ||
|
Pro-conservation regulation
|
The data refer to availability of pro-conservation regulation in the local government located on the watershed | Available, widely applied | 0.50 |
| Available, partly applied | 0.75 | ||
| Available, no longer applied | 1.00 | ||
| Unavailable | 1.25 | ||
| Available, has not been applied | 1.50 | ||
|
The existence of urban area
|
The data refers to the existence of urban areas and type of the city located on the watershed | No urban area | 0.50 |
| Small city | 0.75 | ||
| Medium sized city | 1.00 | ||
| Big city | 1.25 | ||
| Metropolitan | 1.50 | ||
|
Investment on the water building
|
The data refers to the investment (expressed in billion Rupiahs) on water building e.g. dam, irrigation, etc. | INV≤15 | 0.50 |
| 15<INV≤30 | 0.75 | ||
| 30<INV≤45 | 1.00 | ||
| 45<INV≤60 | 1.25 | ||
| INV>60 | 1.50 | ||
| Conserved Area |
Con A= Percentage of conservation area Aveg= The area of vegetation coverage in conservation area Acon= The total area of conservation in the watershed |
Con A>70% | 0.50 |
| x 100% | 45%<Con A≤70% | 0.75 | |
| 30%<Con A≤45% | 1.00 | ||
| 15%<Con A≤30% | 1.25 | ||
| Con A≤15% | 1.50 | ||
| Cultivated Area |
Cul A=Percentage of cultivated area A25=The area with the slope 0-25% Acul=The total area of cultivation in the watershed |
Cul A>70% | 0.50 |
| x 100% | 45%<Cul A≤70% | 0.75 | |
| 30%<Cul A≤45% | 1.00 | ||
| 15%<Cul A≤30% | 1.25 | ||
| Cul A≤15% | 1.50 | ||
Furthermore, we collected data required by the formulas to assess the health of the sub-watersheds. Afterwards, the accumulated score for each sub-water sheds was calculated to state the health status. This regulation defines a watershed is healthy when the total score is less than or equal to 100 and is unhealthy if the total score exceeds 100.
Moreover, we also assessed the watershed health by using the US-EPA assessment procedure which involves indicators such as habitat, hydrology, geomorphology, water quality, and biota. Since some indicators are not available in the Indonesian assessment system, we collected the data by direct observation. For example, habitat observation was carried out by tracing the rivers (about 200 meters long) to observe the riverbed substrate and disturbance factors surrounding the rivers and riparian. Besides, we calculated the geomorphology indicator based on the slope that is analyzed from the existing topographical data. To investigate the water quality, we utilized data from the environmental agency of the Lampung provincial government; the institution that is responsible for doing laboratory tests on the water quality.
Then, we developed a mathematical model representing the watershed health assessment. This predictive model aimed to investigate the relationship between independent variables and the dependent variable and the most influential indicators. We employed the multiple linear regression models following equation 1 and the numerical iteration is assisted by computer software (SPSS).
![]() The y indicates the watershed health, which is the expected dependent variable while x1, x1, x2, and so forth are the indicators that act as inputs of independent variables. Based on the collected data, we developed four models. The first model represents the Ministry of Forestry regulation number 60/2014 and the second model represents the US-EPA directive. Then, the third and fourth models combine both assessment procedures. At the end of statistical procedures, we validated the watershed health equation models with the assessment based on the Ministry of Forestry regulation number 60/2014 following the criteria listed in table 1 as the reference. This validation resulted in the percentage of the margin of error that can reflect the suitability of the model and confirm the watershed health status.
The y indicates the watershed health, which is the expected dependent variable while x1, x1, x2, and so forth are the indicators that act as inputs of independent variables. Based on the collected data, we developed four models. The first model represents the Ministry of Forestry regulation number 60/2014 and the second model represents the US-EPA directive. Then, the third and fourth models combine both assessment procedures. At the end of statistical procedures, we validated the watershed health equation models with the assessment based on the Ministry of Forestry regulation number 60/2014 following the criteria listed in table 1 as the reference. This validation resulted in the percentage of the margin of error that can reflect the suitability of the model and confirm the watershed health status.
3. Results
3.1. The description of the watershed
This research was taken place on five watersheds in Lampung Province located on the southern part of Sumatera Island. Figure 1 is to illustrate the situation of the five watersheds and each characteristic.The figure shows that each watershed has a different size and most of them stretch across the city administrative borders. The red line indicates the border of each watershed. It can be seen Tulang Bawang watershed (the middle part) occupies the biggest area while the smallest one is Semangka watershed. Besides, different coloured spots show various activities taken place on the watersheds that are characterized by different types of land covering. The green areas indiate forests while the blue areas indicate paddy fields.biggest area while the smallest one is Semangka watershed. Besides, different coloured spots show various activities taken place on the watersheds that are characterized by different types of land covering. The green areas indiate forests while the blue areas indicate paddy fields.Moreover, the red spots in the map shows the settlement areas. It can be seen that the existence of the forests in the case study area is still signifcant and the economic activities are dominated farming activities such as paddy fields, horticulture cultivation, and plantations. On the other hand, the mining activities also exist indicated by the dark brown spots.
Furthermore, table 2 compares the watersheds size, the length of the main river, and the three most dominant land covering in each watershed.
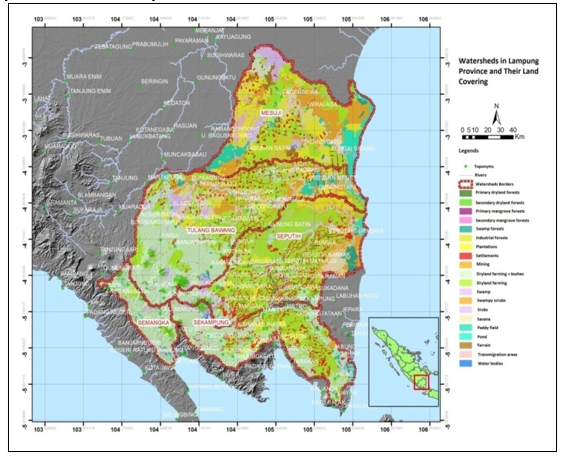 Figure 1: The land covering map of the case study area
Table 2: The watersheds size and their most dominant land covering
| Watershed | Area (Hectares) | The length of the main river (km) | Dominant land covering | |
| Type of land covering | Percentage (%) | |||
| Sekampung | 482,316.20 | 256 | Dryland farming | 73.8 |
| Settlement | 9.9 | |||
| Plantation | 4.2 | |||
| Seputih | 751,527.23 | 135 | Dryland farming | 58.7 |
| Waterbody | 13.2 | |||
| Bushes | 7.9 | |||
| Tulang Bawang | 979,818.53 | 136 | Dryland farming | 60.0 |
| Swamp | 11.1 | |||
| Bushes | 6.3 | |||
| Mesuji | 723,714.31 | 220 | Dryland farming | 23.7 |
| Transmigration area | 19.3 | |||
| Swamp | 18.8 | |||
| Semangka | 161,448.78 | 169 | Dryland farming | 82.9 |
| Forest | 6.5 | |||
| Bushes | 5.7 | |||
| The division of the watershed | ||
| Sekampung : | ||
| 1 | Sekampung 1 (SK-01) | |
| 2 | Sekampung 4 (SK-04) | |
| 3 | Sekampung 5 (SK-05) | |
| 4 | Sekampung 6 (SK-06) | |
| 5 | Sekampung 7 (SK-07) | |
| Seputih : | ||
| 1 | Seputih 1 (SP-01) | |
| 2 | Seputih 2 (SP-02) | |
| 3 | Seputih 3 (SP-03) | |
| 4 | Way Pengubuan 1 (PB-01) | |
| 5 | Way Pengubuan 2 (PB-02) | |
| 6 | Way Pegadungan 2 (PG-02) | |
| Tulang Bawang : | ||
| 1 | Tulang Bawang 1 (TB-01) | |
| 2 | Tulang Bawang 2 (TB-02) | |
| 3 | Terusan 1 (TR-01) | |
| 4 | Terusan 2 (TR-02) | |
| Mesuji : | ||
| 1 | Mesuji 3 (SM-03) | |
| Semangka : | ||
| 1 | Semangka 1 (SMK-01) | |
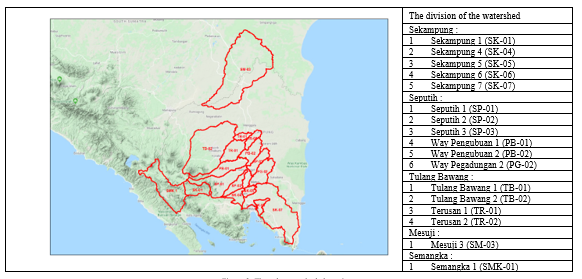 Figure 2: The sub-watershed clustering
Table 2 lists the three most dominant land covering the five observed watersheds. For all watersheds, the dryland farming is superior over other types of land covering with its respective portion. In the Semangka watershed, for instance, dryland farming shared 82.9% of the total area, which is the biggest percentage of land covering. Then, the percentage is followed by forest and swamp, which is respectively 6.5% and 5.7%. Similar with this watershed, the dryland farming is also the most dominant land covering in Sekampung, Tulang Bawang, and Seputih watershed, which is 73.8%, 60.0%, and 58.7% of the total area of each watershed. Although its percentage is not as superior as the other four watersheds’, dryland farming still shares the highest percentage in the Mesuji watershed, which is 23.7% of the total area.
To organize the data collection and analysis, the five watersheds are divided into seventeen sub-watersheds and are codified as is illustrated in figure 2. Further, our data collection and analysis are referred to as this sub-watershed clustering and codification. To specify, we assessed five sub-watersheds in Sekampung watershed, six sub-watersheds in Seputih watersheds, and four sub-watersheds in Tulang Bawang sub-watersheds. For Mesuji and Semangka watershed, respectively we took one sub-watershed.
3.2. The watershed health assessment based on the Ministry of Forestry number 60/2014
Referring to indicators and the formulas listed in table 1, we assessed the health status of the seventeen sub-watersheds. Firstly, we assessed the sub-watershed health based on the indicators of the land conditions. Critical land, vegetation coverage and erosion index are belonged to this indicator. Our analysis shows that the percentage of critical land varied, ranging from 0% to33.6%, in all assessed watershed. The three highest percentages of the critical land appear in SMK-01 (33.6%), SK-01 (28.62%), and SM-03 (22.309%). Moreover, we scored the percentage based on the classification listed in table 1. The shifting in land use can probably be highlighted as the cause of the increasing trend of the critical land. For example, the land-use changes from the forest to the plantations in the upstream while in the middle areas and the downstream the land use mostly shift into settlements and commercial areas, which is in line with the population growth.
Other indicators of the land condition that we assessed are the vegetation coverage and erosion index. These elements are essential considering their importance to influence soil’s physical and chemical characteristics and water flow. The data shows that there is a wide interval (from 0.005% to 89.838%) indicating a diverse situation of the vegetation coverage in the seventeen watersheds. The highest percentage of the vegetation coverage (89.838%) is in SK-01 while the lowest percentage (0.005%) is in SP-02. The higher percentage implicates on the lower score in the weighing procedure. Thus, the higher percentage of the vegetation coverage means the healthier watershed. In the case of erosion index, the calculation does not show a dramatic difference among all areas. The range of the erosion index is between 0.32% and 1.2% while the weight is within the interval 0.5 to 1.0. In general, based on the indicator of the erosion index, the assessed sub-watersheds have good conditions.
Furthermore, we continued the assessment on the indicator of the water quality, quantity, and continuity. We employed equations listed in table to calculate the assessment values using data recorded by the government institutions that are responsible for the watershed management in Lampung Province. We found that there is a variety among the sub-watersheds, but it is not as wide as in the land conditions. Thus, the sub-watersheds have a slight difference in the perspective of water quality, quantity, and continuity. The score of the respective indicator in the sub watersheds is illustrated in figure 3.
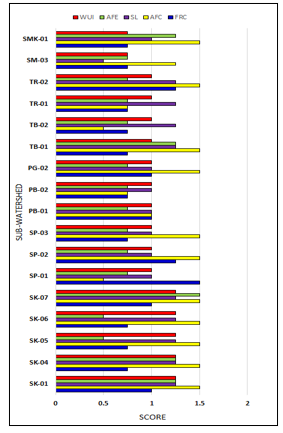 Figure 3: The score of the sub-watershed health assessment based on the quality, quantity, and continuity indicators
In the case of the Flow Regime Coefficient (FRC), which are represented by the blue bars, the highest score is in TR-02 (1.25) followed by TR-02 and SP-02 (1.25) while the result is dominated by the score 0.75. The uniform tendency also appears in the category of the Annual Flow Coefficient (AFC) that is represented by the yellow bars and the Sediment Load (SL) that is represented by the purple bars. On the other hand, more varied score appears in the category of the Annual Flow Event (AFE), which is illustrated by the green bars. In this category, SK-07 has the highest score (1.5) indicating that this sub-watershed has the most often annual flood event compared to other assessed sub-watersheds.
Subsequently, we summarized the sub-watershed health assessment on the socioeconomics and institution indicators. We found that the SK-01 sub-watershed has the lowest Land Availability Index (0.272 hectares/household) while the TB-02 sub-watershed has the highest LAI (9.946 hectares/households). However, it does not automatically implicate population welfare. The calculation shows that the watershed that has the highest LAI is not the most superior in the population welfare. Similarly, the lowest LAI does not implicate the most inferior in population welfare. In the case of population welfare, the highest percentage is SK-06 sub-watershed (20.21%), which implicates on the highest weighing score (1.25). Meanwhile, other assessed sub-watersheds share the same weighing scores (1.0) even though their percentage of population welfare is varied from 10.64% to 19.19%. In the case of pro-conservation regulations, only the Sekampung watershed that has widely applied their local regulations those is pro-conservations while other watersheds have pro-conservation regulations but partly applied.
In the case of the investment indicators, the existence of urban areas and water-related infrastructure (e.g., dam, reservoir, irrigation, etc.) were assessed. We found that the seventeen sub-watersheds are dominated by the small cities and only the SK-05 has a medium-size city. Meanwhile, six sub-watersheds, which are SK-04, SK-06, SK-07, PB-02, TR-01, and TR-02, do not have urban areas. We also found that there is a wide disparity in the existence of the investment on the water-related infrastructure. The data shows the biggest investment, which is the biggest dam in Lampung Province, is located on the SK-07 (IDR 1000 billion). By contrast, the smallest investment (IDR 2 billion) is located on the SK-06.
Lastly, we did the health assessment for the seventeen sub-watersheds on the indictors of the land use. The land use is generally divided into two categories: the conserved and the cultivated areas. The conserved area is defined as the proportion of the vegetation-covered land to the dedicated conservation area. Meanwhile, the cultivated area is defined as the area with the slope 0 to 25%, which is considered as the area that could be cultivated. We calculated the respective areas based on satellite image analysis. We found that the biggest portion of the conserved area (75.49%) belongs to the SK-01 while other sub-watersheds have small percentages. Besides, the zero percentage might indicate that the dedicated conservation area is not available on the sub-watersheds. In the category of the cultivated area, the SK-05 has a hundred percent cultivated area implying that the whole areas have a slope less than 25%.
Table 3: The watershed health status and classification
| Watershed | Sub-watershed | Code | Score | Health status | Classification |
| Sekampung | Sekampung 1 | SK-01 | 111 | Unhealthy | Rehabilitated |
| Sekampung 4 | SK-04 | 89.75 | Healthy | Maintained | |
| Sekampung 5 | SK-05 | 93.25 | Healthy | Maintained | |
| Sekampung 6 | SK-06 | 90 | Healthy | Maintained | |
| Sekampung 7 | SK-07 | 104 | Unhealthy | Rehabilitated | |
| Seputih | Seputih 1 | SP-01 | 87.5 | Healthy | Maintained |
| Seputih 2 | SP-02 | 86.25 | Healthy | Maintained | |
| Seputih 3 | SP-03 | 86.25 | Healthy | Maintained | |
| Way Pengubuan 1 | PB-01 | 88.75 | Healthy | Maintained | |
| Way Pengubuan 2 | PB-02 | 81.25 | Healthy | Maintained | |
| Way Pegadungan 2 | PG-02 | 90 | Healthy | Maintained | |
| Tulang Bawang | Tulang Bawang 1 | TB-01 | 84.75 | Healthy | Maintained |
| Tulang Bawang 2 | TB-02 | 84.75 | Healthy | Maintained | |
| Terusan Nunyai 1 | TR-01 | 79.75 | Healthy | Maintained | |
| Terusan Nunyai 2 | TR-02 | 93.5 | Healthy | Maintained | |
| Mesuji | Mesuji 3 | SM-03 | 95.75 | Healthy | Maintained |
| Semangka | Semangka 1 | SMK-01 | 108.75 | Unhealthy | Rehabilitated |
In more detail, the assessment on the five indicators suggested by the Ministry of Forestry regulation number 60/2014 is tabulated in the Appendix A (Table A1, A2, A3, A4, and A5).
After conducting an assessment for all indicators, we compiled the scores and justify the watershed health status. If the total score exceeds one hundred, the sub-watershed health status is considered as unhealthy. Furthermore, the health status justification also implicates the watershed classification whether it should be maintained or rehabilitated. The analysis shows that most of the sub-watersheds are still in healthy condition. Only three out of seventeen sub-watersheds are considered unhealthy. In detail, the tabulation is presented in table 3.
3.3. Constructing a model for the watershed health assessment
After assessing the watershed health using the Ministry of Forestry regulation number 60/2014, we did a comparison with the US-EPA directive to validate the results and construct a model for the watershed classification. In general, the US-EPA directive defined five indicators i.e. landscape, hydrology, geomorphology, water quality, and biota observation. We used the same scoring procedure for the indicators that can be associated with the Ministry of Forestry regulation number 60/2014. For example, the landscape indicators can be associated with the vegetation coverage and the percentage of the conserved area. We also associated the hydrology indicators with the flow regime coefficient and annual flow coefficient while the geomorphology indicators are associated with the critical land and the cultivated area. Nevertheless, the water quality and biota observation indicators are not accommodated by the Ministry of Forestry regulation number 60/2014. In this case, we did a field survey to collect the primary data if the data officially published by the authorities is not available.
To determine the water quality, we used the Water Quality Index (WQI) that considers nine parameters of water quality namely Dissolved Oxygen (DO), fecal coliform, pH, Biochemical Oxygen Demand (BOD), temperature, Nitrate, Phosphate, turbidity, and suspended materials. We utilized the data published by the Environmental Agency of the Lampung Provincial Government. The data is based on the measurement conducted from April to November 2018. Moreover, the sub-watershed health status is justified using the US-EPA directive. In the case of biota observation, we did a field survey to observe the appearance of macroinvertebrates along the river. Then, the biota observation index is calculated to determine the level of pollution [21,22]. In detail, the sub-watershed health assessment on the water quality and biota observation is presented in table 4.
Table 4: The sub-watersheds health assessment on the water quality and biota observation indicators
| Sub-watershed | Water quality index | Biota observation index | ||
| Score | Health status | Score | Pollution level | |
| SK-01 | 55.33 | Healthy | 2.00 | High |
| SK-04 | 58.00 | Healthy | 2.00 | High |
| SK-05 | 56.25 | Healthy | 2.00 | High |
| SK-06 | 55.00 | Healthy | 2.17 | Moderate |
| SK-07 | 57.00 | Healthy | 2.00 | High |
| SP-01 | 65.67 | Healthy | 2.00 | High |
| SP-02 | 65.33 | Healthy | 2.00 | High |
| SP-03 | 64.00 | Healthy | 2.00 | High |
| PB-01 | 60.33 | Healthy | 2.33 | Moderate |
| PB-02 | 60.67 | Healthy | 2.00 | High |
| PG-02 | 56.33 | Healthy | 2.50 | Moderate |
| TB-01 | 59.33 | Healthy | 2.10 | Moderate |
| TB-02 | 66.00 | Healthy | 2.00 | High |
| TR-01 | 55.67 | Healthy | 2.47 | Moderate |
| TR-02 | 63.00 | Healthy | 2.23 | Moderate |
| SM-03 | 46.00 | Healthy | 2.00 | High |
| SMK-01 | 62.00 | Healthy | 2.00 | High |
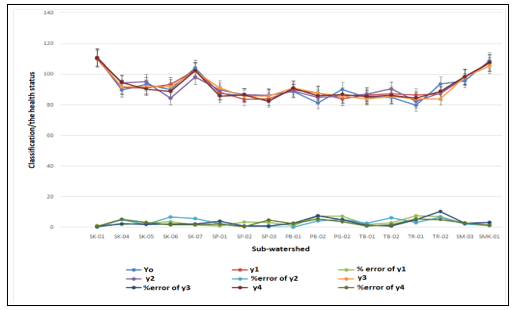 Figure 3: The validation of the models with the actual calculation
Furthermore, we used the weighing scores to develop assessment modeling. We develop four modeling scenarios. The assessment modeling aimed to identify the relationship between indicators and the most influential ones. We employed multiple linear regression, which follows equation 1, to construct those three models. To compute, we used computer software namely SPSS (Statistical Package for Social Science). The scores acted as inputs of independent variables and the watershed health is the dependent variable that is desired after the model runs. These four equations represent the result of the computation.
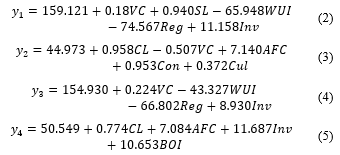 The equations show that each model has different influential indicators. In the first model (the Ministry of Forestry regulation) indicates vegetation coverage, sediment load, water usage index, pro-conservation regulation, and investment of the water-related infrastructure are the influential indicators determining the watershed health status. Similarly, the third model also has the same influential indicators except for the sediment load. Meanwhile, those indicators (except vegetation coverage) do not appear in the second model (the US-EPA directive). In this model, the percentage of critical land, annual flow coefficient, conserver area, and cultivated land are influential. Eventually, the fourth equation resulted in different influential indicators compared to the first three. In this model, the percentage of the critical land, annual flow coefficient, investment, and biota observation index play the most essential roles.
To validate the models, we calculated the error percentage of each equation referring to the scoring and health status justification (table 3). The result is presented in figure 3. Figure 3 shows an insignificant difference between the result gained from the calculation and modeling. In general, iteration resulted in the margin of error around six percent or less except the TR-02 and the PB-02 in the third model (y3). In this model, the margin of error respectively reaches 10.33% and 7.46%. The data insufficiency could probably be a major cause of this occurrence. Currently, the government agencies that involve watershed management have not recorded data required for the modeling. On the other hand, the primary data collected from the field survey did not suffice the requirement of the software iteration. Beyond this limitation, we have spent efforts to simplify the model using the available data.
4. Discussion
The main objective of watershed management is to maintain a healthy ecosystem. However, prioritization has to be taken due to various limitations. The watershed health assessment is one of the procedures to reveal the most urgent elements that require immediate measures. Indeed, the priority of watershed management is context-dependent and different from one entity to another. Therefore, a certain measure cannot be uniformly implemented for all regions. This research identified the health status of five watersheds, which are broken down into seventeen sub-watersheds, in Lampung Province, Indonesia. We mainly used the directive that is officially stated by the authority and added indicators that have not been accommodated by the current directive. The mathematical models that resulted in this study can be utilized as a predictive tool for decision-makers to formulate the watershed management planning and required actions for necessary rehabilitation.
This study revealed that 3 sub-watersheds should be rehabilitated to increase their current carrying capacity. The sub-watersheds are Sekampung 1, Sekampung 7, and Semangka 1. This result implies an alarming situation regarding the sustainability of the sub-watersheds in supporting human activities. Meanwhile, the 14 sub-watersheds can be classified as the areas that should be maintained. It does not mean the sub-watersheds can be exploited without a proper management plan. Subsequently, the influential indicators resulted from mathematical modeling can be viewed as essential elements that contribute significantly to watershed health. Besides, it can be an input to set a prioritization strategy.
Furthermore, a watershed can also be seen as an entity requiring comprehensive and integrated planning to ensure sustainable resource utilization. To realize the comprehensive and integrated approach, a watershed is supposed to be considered as an inseparable entity involving various stakeholders and interests that sometimes cross over administrative borders. Therefore, the watershed management cannot be conducted partially for a certain sector or territory and institutional arrangement is highly required.
5. Conclusion
There are some conclusions can be highlighted from this study. First, three out of seventeen assessed sub-watersheds in Lampung Province, Indonesia can be categorized as unhealthy watershed based on the Ministry of Forestry regulation number 60/2014. This regulation suggested that the unhealthy watershed to be revitalized. Second, from the assessment using the US-EPA directive, the watershed health status of each assessed sub-watershed varies in accordance with the indicator. For instance, all sub-watersheds have healthy status from the water quality index indicator, but their biota observation index shows various pollution levels ranging from moderate to high. Third, the mathematical model of the watershed health assessment in this research can be utilized as a predictive tool to indicate the health status of the watersheds in the case study area. To compare with the assessment using the Ministry of Forestry regulation number 60/2014, the suggested equations have significant accuracy.
Conflict of Interest
The authors declare no conflict of interest.
Acknowledgment
We would like to thank to LPDP (BUDI-DN) scholarship, Universitas Indonesia, and Universitas Muhammadiyah Metro.
- C. Asdak, Hidrologi dan Pengelolaan Daerah Aliran Sungai, 5th ed., Gadjah Mada University Press, Yogyakarta, 2010.
- S.R. Ahn, S.J. Kim, “Assessment of watershed health, vulnerability and resilience for determining protection and restoration Priorities,” Environmental Modelling and Software, 122, 103926, 2019, doi:10.1016/j.envsoft.2017.03.014.
- A. Hu, X. Yang, N. Chen, L. Hou, Y. Ma, C.P. Yu, “Response of bacterial communities to environmental changes in a mesoscale subtropical watershed, Southeast China,” Science of the Total Environment, 472, 746–756, 2014, doi:10.1016/j.scitotenv.2013.11.097.
- G.M. Sanchez, A.P. Nejadhashemi, Z. Zhang, S. Marquart-Pyatt, G. Habron, A. Shortridge, “Linking watershed-scale stream health and socioeconomic indicators with spatial clustering and structural equation modeling,” Environmental Modelling and Software, 70, 113–127, 2015, doi:10.1016/j.envsoft.2015.04.012.
- J. Huang, V. Klemas, “Using Remote Sensing of Land Cover Change in Coastal Watersheds to Predict Downstream Water Quality,” Journal of Coastal Research, 28(4), 930–944, 2012, doi:10.2112/JCOASTRES-D-11-00176.1.
- Z. Xing, Y. Wang, Y. Ji, Q. Fu, H. Li, R. Qu, “Health assessment and spatial variability analysis of the Naolihe Basin using a water-based system,” Ecological Indicators, 92(January 2017), 181–188, 2018, doi:10.1016/j.ecolind.2017.08.045.
- www.colorado.gov, Colorado’s Water Plan, 2017.
- M. Bunch, K. Morrison, M. Parkes, H. Venema, “Promoting health and well-being by managing for social-ecological resilience: the potential of integrating ecohealth and water resources management approaches,” Ecology and Society, 16(1), 2011.
- F. Berkes, “Understanding uncertainty and reducing vulnerability: Lessons from resilience thinking,” Natural Hazards, 41(2), 283–295, 2007, doi:10.1007/s11069-006-9036-7.
- F. Berkes, C. Folke, J. Colding, Linking Social and Ecological Systems: Management practices and social mechanisms for building resilience, Cambridge University Press, Cambridge, 2000.
- The Lake Simcoe Region Conservation Authority, State of the Watershed Report: East Holland River Subwatershed, Ontario, 2000.
- Tigum Aganan Watershed Management Board, Canadian Urban Institute, Handbook for Preparing State of Watershed Reports in the Philippines, 2013.
- www.mrcmekong.org, 604CS Tools Community Based Watershed North Tha, 1–7, 2016.
- Australia-China Development Partnership, River health assessment framework, including monitoring, assessment, and application, 2010.
- The U.S. Environmental Protection Agency, Identifying and protecting Healthy Watershed: Concepts, Assessment, and Management Approaches, 2012.
- S.H. Sadeghi, Z. Hazbavi, “Spatiotemporal variation of watershed health propensity through reliability-resilience-vulnerability based drought index (case study: Shazand Watershed in Iran),” Science of the Total Environment, 587–588, 168–176, 2017, doi:10.1016/j.scitotenv.2017.02.098.
- Kemeneterian Kehutanan Republik Indonesia, Peraturan Menteri Kehutanan Republik Indonesia Nomor: P.61/Menhut-II/2014 tentang Monitoring dan Evaluasi Pengelolaan Daerah Aliran Sungai, 2014.
- V.H. Resh, J.D. Unzicker, “Water quality monitoring and aquatic organisms: the importance of species identification,” Journal of the Water Pollution Control Federation, 47(1), 9–19, 1975.
- C.J. Kleynhans, “The development of a fish index to assess the biological integrity of South African rivers,” Water SA, 25(3), 265–278, 1999.
- D. Copetti, K. Finsterle, L. Marziali, F. Stefani, G. Tartari, G. Douglas, K. Reitzel, B.M. Spears, I.J. Winfield, G. Crosa, P. D’Haese, S. Yasseri, M. Lürling, “Eutrophication management in surface waters using lanthanum modified bentonite: A review,” Water Research, 97, 162–174, 2015, doi:10.1016/j.watres.2015.11.056.
- M.R. Herman, A.P. Nejadhashemi, “A review of macroinvertebrate- and fish-based stream health indices,” Ecohydrology and Hydrobiology, 15(2), 53–67, 2015, doi:10.1016/j.ecohyd.2015.04.001.
- S. Li, J. Zhang, E. Guo, F. Zhang, Q. Ma, G. Mu, “Dynamics and ecological risk assessment of chromophoric dissolved organic matter in the Yinma River Watershed: Rivers, reservoirs, and urban waters,” Environmental Research, 158, 245–254, 2017.