Sensitivity Analysis of Data Normalization Techniques in Social Assistance Program Decision Making for Online Learning
Volume 6, Issue 1, Page No 49-56, 2021
Author’s Name: Edy Budimana), Unmul Hairah, Masna Wati, Haviluddin
View Affiliations
Department of Informatics, Universitas Mulawarman, Samarinda, 75119, Indonesia
a)Author to whom correspondence should be addressed. E-mail: edy.budiman@fkti.unmul.ac.id
Adv. Sci. Technol. Eng. Syst. J. 6(1), 49-56 (2021); ![]() DOI: 10.25046/aj060106
DOI: 10.25046/aj060106
Keywords: Sensitivity, Decision-making, Social-assitance

Export Citations
Data sensitivity analysis using normalization techniques in decision making has an impact on preference values and rankings in the case of social assistance programs for student online. The distribution of assistance is disproportionate and not on target to potential recipients. This study aims to analyze data sensitivity from simple data normalization techniques and linear techniques in decision making. In particular, a simple data normalization technique is illustrated using Simple Additive Weighting (SAW), and a linear technique using the VIšekriterijumsko KOmpromisno Rangiranje (VIKOR) method. There are five criteria used, obtained from observation through measurements and a questionnaire from 400 students. The confusion matrix testing method is used to measure the value of data sensitivity, which includes precision, accuracy and error rate. The results of the study obtained data analysis sensitivity for each method shows that the distribution of normalized data in the selection of 10% (40 students) of positive target recipients, the sensitivity of the linear technique (Vikor method) is higher than the simple technique (SAW method). However, for the target of 15% (60 students) the simple method is higher. The results show that each data normalization technique for decision-making analysis has a different sensitivity value in terms of social assistance for target groups, although many studies suggest that certain methods may be better than others.
Received: 17 September 2020, Accepted: 23 December 2020, Published Online: 10 January 2021
1.Introduction
Education World in the midst of a crisis due the Covid-19 pandemic causes UNICEF, WHO and IFRC [1] appeal that when the situation where the virus is spreading rapidly, schools must be closed and the education process must be continued through online learning activities using various media in “Prevention and Control of COVID-19 spreading in schools [1]”. In response to this, the Indonesia Government issued a circular on the implementation of distance learning, through a Circular of the Minister of National Education regarding education policies during the Covid-19 emergency [2].
The closure of 217,270 schools and 4,670 higher education cause students: 25.5 million Primary Schools, 10.12 million junior high schools, 4.78 million senior high schools, 4.9million Vocational high school, 130 thousand children with disabilities schools and 8 million college-undergraduate students in higher education institutions must learn from home (LFH). However, to implement the policy is not as easy as expected. There are many things that make the implementation of online learning not optimal, the lack of facilities and technological literacy [3], the unpreparedness of educators for students [4], and there are several regions, certain areas that do not allow residents to use electricity (IT). In addition, the economic crisis caused by the pandemic has also become an emergency because it is in regard to community welfare issues.
The economic crisis problem has a significant impact on students in fulfilling internet needs for access to online learning, their parents cannot afford it and difficulties in providing more budget to buy internet data. Therefore, several Indonesia region government policies and educational institutions provide free internet data assistance to students to support the continuity of online learning.
The research study is motivated by the subjectivity in decision-making problems in the internet data assistance management to students. The distribution of data assistance is less than optimal and right on target to potential beneficiaries(student).
The normalized data technique according to research it is very important for the method of decision making, because the data must be numerical and comparable to be combined into one score per alternative [5], The research revealed that normalization affects the results of the MADM method [6]. This study examines the popular effects of normalization procedures and shows that the empirical deformation of data caused by the use of normalization can influence the final choice [6], and Normalization Techniques for Analytical hierarchy process case study [7], about A state-of-the-art survey on the influence of normalization techniques in ranking for Improving the materials selection process in engineering design [8] and others. Therefore, it is the author’s interest to apply and select appropriate normalization techniques and targeted handling in the distribution of internet data assistance programs.
In an effort to improve decision data analysis management, we propose a decision-making analysis method by providing a sensitivity study of decision-making methods in determining individual and group alternatives. We offer the SAW and Vikor analytical approach as a linear and simple method in preparing the decision matrix. In particularly. The study purpose was to provide an evaluation of the performance sensitivity of the VIšekriterijumsko KOmpromisno Rangiranje (VIKOR) and Simple Additive Weighting (SAW) methods in group decision making for ranking in internet data assistance programs. This study describes the results of the sensitivity analysis using the confusion matrix measurement approach to the sensitivity, which includes precision, accuracy, and error rate values.
The research contribution as a novelty in implementation and development extends to the use of decision-making analysis techniques and methods that affect preference assessments in handling cases of distribution of social assistance internet data packages for online learning.
2. Materials
2.1. An Overview Internet Data Assistance Program
One of the social assistance programs from the government and various universities and schools in Indonesia in dealing with the economic crisis of the community during the Covid-19 pandemic in the field of education is the distribution of internet data assistance to support students in learning online from home [9]. This program is managed by policymakers or stakeholders in an effort to maintain the continuity of learning activities. The object of a case study at a tertiary institution in East Kalimantan Province, Indonesia, especially for undergraduate students of the Informatics Department. Mulawarman University.
The initial activity was carried out by observation through collecting information about the needs for the amount of internet data usage, and the economic abilities of students. The results of the observations obtained five parameters which are used as criteria in decision making are; Use of Internet Data (C1), Subjects of Learning (C2), Credit Courses (C3), Economic Capability (C4) and Purchasing Power Data (C5). The description of student characteristics is shown in Table 1.
Table 1 presents the characteristics of student beneficiaries who are divided into 3 categories of beneficiaries who have the highest attributes of the benefit criteria or the maximum (C1, C2, C3), and the lowest in the cost or minimum attribute criteria (C4, C5), meaning that the main priority of the potential beneficiaries. the benefits are those with high internet data usage, the number of courses and credits. Whereas for the low category are those (students) who are not targeted for assistance, this category has minimal internet data usage, few courses and credits, and has high economic capacity and data purchasing.
Table 1: Student Characteristics
| Metrics | C1 | C2 | C3 | C4 | C5 |
| Attribute | Max | Max | Max | Min | Min |
| Mean | 749.21 | 7 | 20 | 2,133,113 | 237,000 |
| Median | 732.2 | 7 | 21 | 1,950,000 | 200,000 |
| Mode | 490.6 | 7 | 24 | 2,000,000 | 100,000 |
| Std. Dev. | 146.6 | 1.2 | 3.1 | 649,083.2 | 124,779.5 |
| Min. | 490.56 | 5 | 14 | 1,000,000 | 100,000 |
| Max. | 1,130.17 | 9 | 24 | 4,000,000 | 500,000 |
| N | 400 | 400 | 400 | 400 | 400 |
2.2. Sensitivity Analysis in Decision Making
The sensitivity of data analysis in decision making is influenced by many factors. This study discusses the sensitivity of normalized data analysis. In general, normalization in MCDM is a transformation process to obtain numerical input data and its comparison uses the same scale [7]-[10]. The normalization technique maps attributes (criteria) with different units of measurement to the same scale in the interval: 0-1.
The MADM methods determine how to attribute information is processed to arrive at a choice, reqsuiring comparisons between and between attributes, and involves appropriate explicit exchanges. Each decision matrix (decision table)in MCDM method has four main parts, i.e: (a) alternatives, (b) attributes, (c) weight or relative importance of each attribute, and (d) alternative performance measures with sets by attribute [11].
Several studies on the normalization matrix as in [8] examine the influence of normalization techniques in ranking: Improving the materials selection process in engineering design. Normalisation affects the results of MADM methods in [6] and [12]. Data normalisation techniques in decision making with TOPSIS method [5], Comparative analysis of normalization procedures in TOPSIS method: With an application to Turkish deposit banking market [13] and [14] etc. The linear normalization (LN) data sensitivity analysis we described it using the VIKOR method, and simple normalization (SN) data sensitivity was observed using SAW. The equations for the normalization method are presented in Table 2.
Table 2: The Normalization Equation for SN, LN, and VN
| Attribute | Max | Min | |
| Simple (SN) | (1) | ||
| Linear (LN) | (2) |
3. Experimental Methods
3.1. Research Design
An overview of the research design is presented in Figure 1.
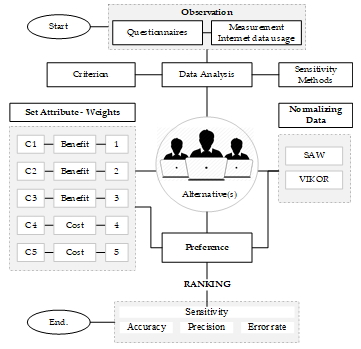 Figure 1: Research Design for Sensitivity Data Analysis Methods
3.2. Observation
Figure 1, the data collection method is through observation activities, namely data measurement to determine the amount of student internet data usage, and questionnaires to obtain information on the number of courses and credits, as well as the economic ability and purchasing power of students. Data collection was carried out at the peak of the Covid-19 pandemic. The results of activity observations form the basis for determining the criteria for mentoring.
The research observation population of 400 students is all students of the Department of Informatics at Mulawarman University who carry out online learning activities and become one of the alternative targets for internet data assistance.
3.3. Criteria Weighting Method
The criteria data for making decision assistance from the results of observation activities obtained five criteria for decision making; Use of Internet Data (C1), Learning Courses (C2), Credit Courses (C3), Economic Capability (C4) and data purchasing power (C5). The weighting method the criteria and attribute set used the Rank Sum weighting technique which refers to the research of Mats Danielson and L. Ekenberg [15] using the equation.
![]() Denote the ranking number i among N items to rank, a larger weight is assigned to lower-ranking numbers [15]. Furthermore, from the calculation of equation (3), the criteria weight values are obtained and include the attributes shown in Table 3.
Denote the ranking number i among N items to rank, a larger weight is assigned to lower-ranking numbers [15]. Furthermore, from the calculation of equation (3), the criteria weight values are obtained and include the attributes shown in Table 3.
The attribute set for the criteria of Use of Internet Data (C1), Subjects of Learning (C2), Credit Courses (C3) are set to benefit attributes (Max) with straight ranks and Economic Capability (C4) and Purchasing Power Data (C5) set Cost attribute (Min).
Table 3: The Criterion Weighting and Attribute
| Criteria | Straight rank (rj) | Sum Rank weight (n – rj + 1) |
Normalized weight | Attri-bute |
| C1 | 1 | 5-1+1= 5 | 0.333 | Max |
| C2 | 2 | 5-2+1= 4 | 0.267 | Max |
| C3 | 3 | 5-3+1= 3 | 0.200 | Max |
| C4 | 4 | 5-4+1= 2 | 0.133 | Min |
| C5 | 5 | 5-5+1=1 | 0.067 | Min |
3.4. Sensitivity Data Analysis Methods
The data analysis method for decision making applies the SAW method for Simple Normalization(SN) and VIKOR for Linear Normalization(LN). An overview of the flow of data analysis can be seen in Figure 2.
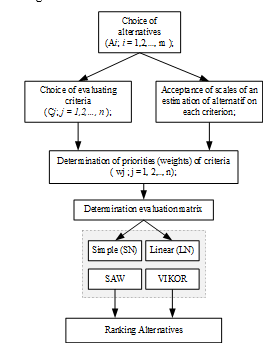 Figure 2: The Data Analysis Flow
The step-by-step sequence of the problem of multi-criteria decision making for data normalization analysis refers to [11], [16] is defined in Figure 2. Simple Normalization (SN) performance description is illustrated using the SAW method referring to [17], [18], the equation:![]() where pi is the performance value or preference value of the alternative to – i; wj denotes the weight of the jth criterion; rij is the normalized rank selected from the ith alternative against the j is criterion to be the equivalent unit.
where pi is the performance value or preference value of the alternative to – i; wj denotes the weight of the jth criterion; rij is the normalized rank selected from the ith alternative against the j is criterion to be the equivalent unit.
Linear Normalization (LN) performance description is illustrated using the VIKOR method referring to [19] the equation:
![]() V is the weight ranging from 0-1 (generally 0.5). The value of v is the weight value of the strategy of the maximum group utility, while the value of 1 – v is the weight of individual regret. The smaller the VIKOR index value (Qi) the better the alternative solution.
V is the weight ranging from 0-1 (generally 0.5). The value of v is the weight value of the strategy of the maximum group utility, while the value of 1 – v is the weight of individual regret. The smaller the VIKOR index value (Qi) the better the alternative solution.
3.5. Confusion Matrix
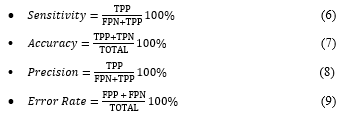
The confusion matrix is used to measure the performance of SN, LN and VN data normalization methods. In this test, the reference results of the 3 methods are compared with actual data, ie. alternative data which is the priority for internet data assistance, in the high category. In measuring the performance of these three methods, there are 4 (four) terms referring to [20] as a representation of the results of the performance process, ie. True Potential Positive Assitance (TPP), True Potential Negative (TPN), False Potential Positive (FPP) and False Potential Negative (FPN) [17]. Measurement values for sensitivity, accuracy, precision and misclassification (error rate) refer to [21], [22] as follows
 4. Results and Discussion
4.1. Data Description Analysis
- Alternative data and criteria
The research data was obtained through observation activities in the form of measuring internet data during online learning (C1) and filling out questionnaire forms (C2, C3, C4, C5), which were obtained from 400 undergraduate students Informatics Dept, as an alternative in decision making or potential beneficiaries. Description of this data is shown in Table 4.
Table 4: description data analysis
| Alts. | C1 | C2 | C3 | C4 | C5 |
| A1 | 926.18 | 9 | 24 | 1,800,000 | 100,000 |
| A2 | 690.96 | 9 | 23 | 1,850,000 | 100,000 |
| A3 | 849.73 | 9 | 19 | 3,850,000 | 300,000 |
| A4 | 1,002.07 | 9 | 23 | 1,350,000 | 100,000 |
| A5 | 1,005.88 | 9 | 24 | 1,450,000 | 100,000 |
| Aâ | ⁞ | ⁞ | ⁞ | ⁞ | ⁞ |
| A399 | 1,002.31 | 9 | 23 | 1,200,000 | 100,000 |
| A400 | 798.77 | 9 | 18 | 3,000,000 | 500,000 |
| Avg. | 749.21 | 7 | 20 | 2,133,113 | 237,000 |
| Min. | 490.560 | 5 | 14 | 1,000,000 | 100,000 |
| Max. | 1,130.17 | 9 | 24 | 4,000,000 | 500,000 |
Data analysis (datasheet) in Table 4, arranged in a decision matrix containing the value of each alternative A1 to A400, the average value for C1 is 749.21 MB, C2 averages 7 courses, for C3 averages 20 SKS for courses, C4 an average of IDR 2,133,113 and C5 an average of IDR 237,000. While the min-max value obtained is 490,560 MB – 1,130,170 MB of internet data usage (C1), 5 – 9 number of courses (C2), 14-24 credits of courses (C3), IDR 1,000,000 – IDR 4,000. 000 economic capacity (C4), and IDR 100,000 – IDR 500,000 for C5.
4.2. Result: Normalization Data Analysis
- Result: Normalization Simple Data (SN)
Normalized data analysis for a simple technique using equation (1) calculating the min and max, the value of each alternative (A1 to A400) is obtained as shown in Table 5.
Table 5: Normalization Data SAW Method
| Alts. | r1ij (C1) | r2ij (C2) | r3ij(C3) | r4ij(C4) | r5ij(C5) |
| A1 | 0.819 | 1.0 | 1.0 | 0.555 | 1.0 |
| A2 | 0.611 | 1.0 | 0.958 | 0.540 | 1.0 |
| A3 | 0.751 | 1.0 | 0.791 | 0.259 | 0.33 |
| A4 | 0.886 | 1.0 | 0.958 | 0.740 | 1.0 |
| A5 | 0.890 | 1.0 | 1.0 | 0.689 | 1.0 |
| Aâ | ⁞ | ⁞ | ⁞ | ⁞ | ⁞ |
| A399 | 0.886 | 1.0 | 0.958 | 0.833 | 1.0 |
| A400 | 0.706 | 1.0 | 0.7 | 0.333 | 0.2 |
| Avg. | 0.663 | 0.830 | 0.842 | 0.509 | 0.578 |
| Min. | 0.434 | 0.556 | 0.583 | 0.250 | 0.200 |
| Max. | 1.000 | 1.000 | 1.000 | 1.000 | 1.000 |
The calculation results (Table 5) of normalized data analysis using simple techniques, which are illustrated using the SAW method, the value of the simple technique is obtained with an average of 0.663 for C1 with a min value of 0.434 and a max value of 1.0. For C2, an average value of 0.830, C3 an average of 0.842 (min 0.583 – max 1.0), C4 an average of 0.509 (min 0.250 – max 1.0) and for C5 an average of 0.578 with a min 0.2 – 1.0.
- Result: Normalization Linear Data (LN)
Normalized data analysis for a linear technique using equation (1) calculating the min and max, the value of each alternative (A1 to A400) is obtained, as shown in Table 6.
Table 6: Normalization Data VIKOR method
| Alts. | r1ij (C1) | r2ij (C2) | r3ij(C3) | r4ij(C4) | r5ij(C5) |
| A1 | 0.681 | 1.000 | 1.000 | 0.733 | 1.000 |
| A2 | 0.313 | 1.000 | 0.900 | 0.717 | 1.000 |
| A3 | 0.562 | 1.000 | 0.500 | 0.050 | 0.500 |
| A4 | 0.800 | 1.000 | 0.900 | 0.883 | 1.000 |
| A5 | 0.806 | 1.000 | 1.000 | 0.850 | 1.000 |
| Aâ | ⁞ | ⁞ | ⁞ | ⁞ | ⁞ |
| A399 | 0.80 | 1.00 | 0.90 | 0.93 | 1.00 |
| A400 | 0.48 | 1.00 | 0.40 | 0.33 | 0.00 |
| Avg. | 0.4044 | 0.6181 | 0.6213 | 0.6223 | 0.6575 |
| Min. | 0.000 | 0.000 | 0.000 | 0.000 | 0.000 |
| Max. | 1.000 | 1.000 | 1.000 | 1.000 | 1.000 |
The calculation results (Table 6) from normalized data analysis using a linear technique illustrated by the VIKOR method obtained a linear technique value with an average of 0.4044 for C1, for C2 an average value 0.6181, C3 was 0.6213, C4 was average. 0.6223 and for C5 the average is 0.6575. While the min and max values for each data criterion are at 0.0 – 1.0. Furthermore, the visualization of the data spread for simple and linear normalized data technique is shown in Figure 3.
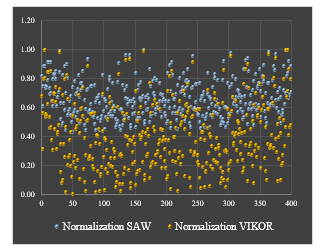 Figure 3: Scatter-chart Data Normalization SAW-VIKOR
Figure 3 presents a simple technique data spread visualization showing the central area of the spread data for C1 range of 0.434 to 1.0. Meanwhile, the linear technique shows a distribution area of 0.0 to 1.0
4.3. Preference and Ranking
- The preference value
The preference value (P) for SAW method according to (3), for VIKOR using (4). The calculation results for each alternative (A) are shown in Table 7.
Table 7: Preference Value SAW and VIKOR
| Alts. | Simple Norm. | Linear Norm. |
| SAW | VIKOR | |
| A1 | 0.880576 | 0.918040 |
| A2 | 0.800864 | 0.827270 |
| A3 | 0.732474 | 0.752377 |
| A4 | 0.919317 | 0.942831 |
| A5 | 0.921962 | 0.953826 |
| A6 | 0.973333 | 1.000000 |
| A7 | 0.789162 | 0.844602 |
| A8 | 0.849240 | 0.885965 |
| A9 | 0.816799 | 0.875406 |
| A10 | 0.874123 | 0.908853 |
| A11 | 0.936147 | 0.964779 |
| A12 | 0.925985 | 0.960283 |
| Aâ | ⁞ | ⁞ |
| A399 | 0.931733 | 0.947088 |
| A400 | 0.710034 | 0.725979 |
Table 7 is the preference value of the simple normalization data (SAW) and linear (VIKOR) calculation of 400 alternatives, which is the final result of the assessment of the criteria and weighting values of students who are prospective recipients of internet data social assistance. Furthermore, the visualization of the spread of preference data from the SAW and VIKOR methods is shown in Figure 4.
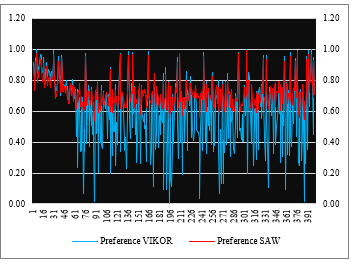 Figure 4: Chart Preference Value SAW and VIKOR Method
Figure 4 shows a graph of the spread data preferences from the SAW method in the area 0.5408 – 0.9921 and the VIKOR method in the 0.0 – 1.0 area.
- Ranking
The calculation results of preferences are then sorted from largest to smallest, where the largest alternative preference value is the best alternative from the data which is the chosen alternative, while the alternative with the lowest preference value is the worst of the alternatives as shown in Table 8.
Table 8: Ranking SAW and VIKOR Method
| SAW Method | VIKOR Method | ||||||
| Rank | Alts. | Rank | Alts. | Rank | Alts. | Rank | Alts. |
| 1st | A304 | 21st | A399 | 1st | A6 | 21st | A389 |
| 2nd | A375 | 22nd | A12 | 2nd | A395 | 22nd | A357 |
| 3rd | A292 | 23rd | A37 | 3rd | A304 | 23rd | A5 |
| 4th | A6 | 24th | A373 | 4th | A391 | 24th | A37 |
| 5th | A209 | 25th | A357 | 5th | A30 | 25th | A396 |
| 6th | A395 | 26th | A396 | 6th | A375 | 26th | A16 |
| 7th | A124 | 27th | A5 | 7th | A136 | 27th | A399 |
| 8th | A142 | 28th | A4 | 8th | A164 | 28th | A205 |
| 9th | A30 | 29th | A205 | 9th | A243 | 29th | A373 |
| 10th | A391 | 30th | A16 | 10th | A365 | 30th | A4 |
| 11th | A136 | 31st | A20 | 11th | A142 | 31st | A1 |
| 12th | A164 | 32nd | A1 | 12th | A292 | 32nd | A20 |
| 13th | A243 | 33rd | A10 | 13th | A75 | 33rd | A29 |
| 14th | A365 | 34th | A13 | 14th | A209 | 34th | A10 |
| 15th | A75 | 35th | A110 | 15th | A124 | 35th | A13 |
| 16th | A327 | 36th | A29 | 16th | A11 | 36th | A110 |
| 17th | A41 | 37th | A8 | 17th | A331 | 37th | A8 |
| 18th | A331 | 38th | A173 | 18th | A41 | 38th | A189 |
| 19th | A11 | 39th | A42 | 19th | A12 | 39th | A9 |
| 20th | A389 | 40th | A189 | 20th | A327 | 40th | A22 |
Table 8, there are 40 alternative ranking preference results from the two methods (SAW and VIKOR). Each method produces a different ranking of values, the SAW method produces an alternative A304 with a preference value of 0.9921 in the first order A375, in the second-order A292, in the third order, and so on. Then, the results of the ranking preference Vikor method obtained the first alternative A6, A395 in the second, A304 third, and so on (see Table 8 and Figure 5).
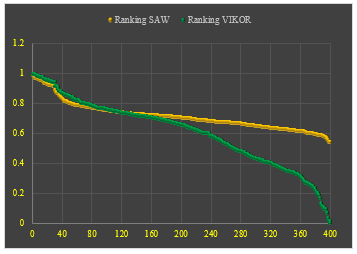 Figure 5: The Ranking of SAW vs VIKOR method
The difference in the value of the two individual ranking decision-making methods is due to differences in the normalization data analysis method, where the SAW method applies the Simple Normalization (SN) method, and the VIKOR method uses the Linear Normalization (LN) even though the weighting of the criteria is equally important and the weight is straight.
4.4. Confusion Matrix: Sensitivity Data Analysis
Sensitivity data analysis uses a confusion matrix to determine the sensitivity, accuracy, precision, and misclassification of ranking values using actual data as an internal validation of the performance of each method. The test scenario is carried out by dividing the percentage of alternative aid targets by the target number of 10%, 15%, 20% and 25% (40 alt; 60 alt; 80 alt; and 100 alt.) potential recipients of social assistance and the sensitivity of decision-making methods regarding the target alternative groups.
Table 9: Actual Data vs SAW and VIKOR Rank Methods
| Actual Data | SAW method | VIKOR method | |||
| Order | Alts. | Ranking | Valid | Ranking | Valid |
| 1st | A124 | A304 | 1 | A6 | 1 |
| 2nd | A209 | A375 | 1 | A395 | 1 |
| 3rd | A292 | A292 | 1 | A304 | 1 |
| 4th | A304 | A6 | 1 | A391 | 1 |
| 5th | A375 | A209 | 1 | A30 | 1 |
| 6th | A6 | A395 | 1 | A375 | 1 |
| 7th | A30 | A124 | 1 | A136 | 1 |
| 8th | A142 | A142 | 1 | A164 | 1 |
| 9th | A395 | A30 | 1 | A243 | 1 |
| 10th | A41 | A391 | 1 | A365 | 1 |
| 11th | A75 | A136 | 1 | A142 | 1 |
| 12th | A136 | A164 | 1 | A292 | 1 |
| 13th | A164 | A243 | 1 | A75 | 1 |
| 14th | A243 | A365 | 1 | A209 | 1 |
| 15th | A389 | A75 | 1 | A124 | 1 |
| 16th | A391 | A327 | 1 | A11 | 1 |
| 17th | A399 | A41 | 1 | A331 | 1 |
| 18th | A11 | A331 | 1 | A41 | 1 |
| 19th | A37 | A11 | 1 | A12 | 1 |
| 20th | A327 | A389 | 1 | A327 | 1 |
| 21st | A365 | A399 | 1 | A389 | 1 |
| 22nd | A373 | A12 | 1 | A357 | 1 |
| 23rd | A4 | A37 | 1 | A5 | 1 |
| 24th | A5 | A373 | 1 | A37 | 1 |
| 25th | A12 | A357 | 1 | A396 | 1 |
| 26th | A16 | A396 | 1 | A16 | 1 |
| 27th | A205 | A5 | 1 | A399 | 1 |
| 28th | A331 | A4 | 1 | A205 | 1 |
| 29th | A357 | A205 | 1 | A373 | 1 |
| 30th | A396 | A16 | 1 | A4 | 1 |
| 31st | A29 | A20 | 1 | A1 | 1 |
| 32nd | A1 | A1 | 1 | A20 | 1 |
| 33rd | A23 | A10 | 1 | A29 | 1 |
| 34th | A8 | A13 | 1 | A10 | 1 |
| 35th | A10 | A110 | 0 | A13 | 1 |
| 36th | A13 | A29 | 1 | A110 | 0 |
| 37th | A19 | A8 | 1 | A8 | 1 |
| 38th | A20 | A173 | 0 | A189 | 0 |
| 39th | A22 | A42 | 0 | A9 | 0 |
| 40th | A28 | A189 | 0 | A22 | 1 |
| Sum | 36 | 37 | |||
Table 9 is an example of testing actual data for 40 alternatives out of a total of 400 alternatives (10%) that were targeted for selecting the SAW and VIKOR methods. The results are compared to then measure the confusion matrix. The comparison results in Table 9 validate the data from the 2 ranking methods against the actual data, then perform performance calculations. Table 9 presents the method of performance results for the 10% target or 40 alternatives.
Table 10: The Confusion Matrix Decision Analysis for SAW Method
| SAW Method | ||||||
| N = 400 | Predicted: NO |
Predicted: YES |
||||
| Actual Data | Actual: NO |
TPN = 320 | FPP = 40 | 360 | ||
| Actual: YES |
FPN = 4 | TPP = 36 | 40 | |||
| 324 | 76 | |||||
From Table 10, the performance value for SAW method:
- Sensitivity using(6): à 36/40 = 0.9 = 90%
- Accuracy using(7): à (320 + 36) / 400 = 0.890 = 89,0%
- Precision using(8): à 36/(36+40) = 0.474 = 47,4%
- Error rate using(9): à (40+4)/400 = 0.110 = 11,0%
From Table 11, the performance value for Vikor method:
- Sensitivity using(6): à 37/40 = 0.925 = 92,5%
- Accuracy using(7): à (320 + 37) / 400 = 0.893 = 89,3%
- Precision using(8): à 37/(37+40) = 0.481 = 48,1%
- Error rate using(9): à (40+3)/400 = 0.108 = 10,8%
Table 11: The Confusion Matrix Decision Analysis for Vikor Method
| SAW Method | ||||||
| N = 400 | Predicted: NO |
Predicted: YES |
||||
| Actual Data | Actual: NO |
TPN = 320 | FPP = 40 | 360 | ||
| Actual: YES |
FPN = 3 | TPP = 37 | 40 | |||
| 323 | 77 | |||||
Table 12: The Summary Scenario Results: Method Performance vs Actual Data
| Metric | SAW Method | VIKOR Method | ||||||
| 10% | 15% | 20% | 25% | 10% | 15% | 20% | 25% | |
| Sensitivity | 90.0 | 80.0 | 80.0 | 75.0 | 92.5 | 76.7 | 80.0 | 79.0 |
| Accuracy | 89.0 | 82.0 | 76.0 | 68.75 | 89.3 | 81.5 | 76.0 | 69.76 |
| Precision | 47.4 | 44.4 | 44.4 | 42.9 | 48.1 | 43.4 | 44.4 | 44.1 |
| Error rate | 11.0 | 18.0 | 24.0 | 31.25 | 10.75 | 18.5 | 24.0 | 30.25 |
The summary of the performance measurement data from the percentage set scenario for the target alternative group is shown in Table 12.
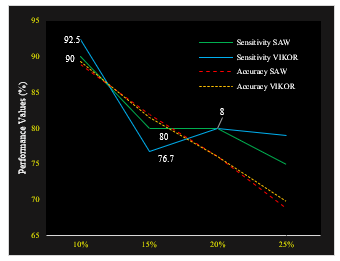 Figure 6: Sensitivity and Accuracy Methods – SAW vs VIKOR
Figure 6 shows a line-chart of the sensitivity and accuracy values of the SAW and VIKOR methods, the sensitivity in determining targets results in different performance values, at the 20% target (40 targets) the Vikor method is 1 alternative higher than SAW, meaning that Vikor’s sensitivity value for target 40 people with a sensitivity of 0.925 or 92.5% while SAW was 90%. However, when the target was increased by 15%, (60 targets) the SAW method was more sensitive than VIKOR, with a ratio of 48:46 or about 80% SAW: 76.7% VIKOR. When the target is increased by 80 people (20%), both methods have the same performance value for each metric (sensitivity, accuracy, precision and error rate), SAW and VIKOR.
Figure 7 shows the error rate value has increased linearly and simultaneously with an average increase of 7 points. and the value of precision is influenced by the sensitivity value decreases. In principle, both the SAW and VIKOR methods are included in the linear analysis model, and this result is influenced by the weighted value setting assigned to the criteria.
![]()
![]()
![]()
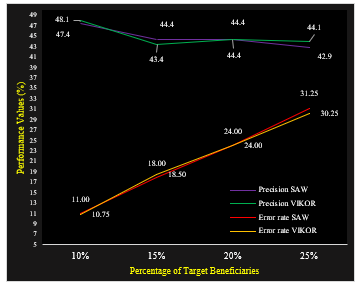 Figure 7: Precision and error rate value method SAW – VIKOR
4.5. Discussion
This work also demands sensitivity in examining the details of the data and must be careful to look at every detail of the values that exist. The two methods used have their own characteristics in terms of sensitivity in the analysis of social assistance program data. From the results of the analysis of the previous method shows fundamental differences, it becomes our important point when carrying out this work, the findings include:
The data normalization analysis process, the results obtained show the distribution of values in the SAW method (see: Figure 3) which explains that the results of data normalization are coherent (dependent) in the value range [0.4 – 1.0], while in the Vikor method, the results of data normalization are independent of the range [0.9–1.0]. This explains that the spread of the results of the integrated SAW analysis normalization shows fierce competition in the selection, and will also have a significant effect on the performance (preference) of the SAW method. The benefit is that it is suitable for use in the case of group selection (10%, 15%, 20%, 25%).
The process of analyzing the performance of the social assistance data sensitivity also shows differences in determining the selection of positive beneficiaries, the VIKOR method has a higher sensitivity value than the SAW method if the alternative target is chosen by 40 students (10%), this can be seen from a higher preference value (see Figure 6). However, under certain conditions or when the target recipient of social assistance is increased (target 15%), the performance gradually decreases, the SAW method is higher.
This is based on the results of observations caused by the distribution of the normalized values of VIKOR data in the distribution range of 0 to 1, and the distribution of data (preference values) of the SAW method is mostly centred in the lowest distribution area of 0.5408 to 0.9921. In other data analysis also obtained the same performance value, namely when the target beneficiary target is increased (20% target), and the addition of the target 25% target (100 alt) shows that the performance of the VIKOR method increases linearly better than the performance of the SAW method. This means that the characteristics of these two methods are different and experience changes in preference values caused by the different value distribution of the two Normalized Data techniques. In addition, the important point of this study is the sensitivity value of normalized data techniques in the decision-making process based on the number of target alternatives for social assistance and the total alternatives.
5. Conclusion
Decision making related to social assistance for community welfare requires good management because a slight change or error in determining the analytical method approach has a significant impact on the results, this is explained from the work carried out showing the sensitivity of simple techniques and linear techniques for normalized data in decision making.
The results of this study are based on the characteristics obtained from the two methods providing conclusions for new research for the author to explore further, namely, there are differences in the final rating (preference) value of the target size, and this occurs because of the influence of the characteristics of the data distribution of each. normalized techniques, for cases with a target <10% Linear techniques illustrated using the VIKOR method have a high degree of accuracy compared to simple techniques illustrated using the SAW method. However, if the target number of social assistance recipients is in the range >10% to 15% (60 alt from 400 alt), then the SAW method has a good performance, and the results of these observations are due to the distribution of data focused on certain areas. (preference value) of simple techniques that affect performance. That is, the use of Linear Normalization data technique is very good for decision making cases with small targets because it produces the right ranking performance compared to simple data normalization techniques.
Conflict of Interest
The authors declare no conflict of interest related to this paper.
Acknowledgment
Research funding comes from the Higher Education Operational Assistance Fund Department of Informatics, Faculty of Engineering, Mulawarman University, Indonesia.
- Unicef, WHO, IFRC, Key Messages and Actions for Prevention and Control in Schools.
- Peraturan Pemerintah Republik Indonesia, Peraturan Pemerintah Nomor 21 Tahun 2020 tentang Pembatasan Sosial Berskala Besar Dalam Rangka Percepatan Penanganan Coronavirus Disease 2019, 2020.
- E. Budiman, M. Wati, Norhidayat, “Mobile Cultural Heritage Apps For The Digital Literacy Of The Dayak Tribe, Borneo, Indonesia,” Conservation Science In Cultural Heritage, 19, 2015–217, 2019, doi:https://doi.org/10.6092/issn.1973-9494/10627.
- E. Budiman, D. Moeis, R. Soekarta, “Broadband quality of service experience measuring mobile networks from consumer perceived,” in 2017 3rd International Conference on Science in Information Technology (ICSITech), IEEE, Bandung: 423–428, 2017, doi:10.1109/ICSITech.2017.8257150.
- N. Vafaei, R.A. Ribeiro, L.M. Camarinha-Matos, Data normalisation techniques in decision making: Case study with TOPSIS method, International Journal of Information and Decision Sciences, 2018, doi:10.1504/IJIDS.2018.090667.
- D.M. Pavlii, “Normalisation affects the results of MADM methods,” Yugoslav Journal of Operations Research, 2001.
- N. Vafaei, R.A. Ribeiro, L.M. Camarinha-Matos, “Normalization techniques for multi-criteria decision making: Analytical hierarchy process case study,” in IFIP Advances in Information and Communication Technology, 2016, doi:10.1007/978-3-319-31165-4_26.
- A. Jahan, K.L. Edwards, A state-of-the-art survey on the influence of normalization techniques in ranking: Improving the materials selection process in engineering design, Materials and Design, 2015, doi:10.1016/j.matdes.2014.09.022.
- E. Budiman, “Mobile Data Usage on Online Learning during COVID-19 Pandemic in Higher Education,” International Journal of Interactive Mobile Technologies (IJIM), 14(19), 2020, doi:10.3991/ijim.v14i19.17499.
- N. Vafaei, R.A. Ribeiro, L.M. Camarinha-Matos, “Importance of Data Normalization in Decision Making: case study with TOPSIS method,” in International Conference of Decision support Systems Technology, An EWG-DSS Conference. Them: Big Data Analytic for Decision Making, 2015.
- I. Mukhametzyanov, D. Pamučar, “A Sensitivity analysis in MCDM problems: A statistical approach,” Decision Making: Applications in Management and Engineering, 2018, doi:10.31181/dmame1802050m.
- E. Budiman, “Decision Optimization: Internet Data Assistance for Students during Learning from Home,” International Journal of Innovative Technology and Exploring Engineering, 9(11), 372–378, 2020, doi:10.35940/ijitee.k7845.0991120.
- A. Çelen, “Comparative analysis of normalization procedures in TOPSIS method: With an application to Turkish deposit banking market,” Informatica (Netherlands), 2014, doi:10.15388/Informatica.2014.10.
- E. Budiman, N. Dengen, Haviluddin, W. Indrawan, “Integrated multi criteria decision making for a destitute problem,” in Proceeding – 2017 3rd International Conference on Science in Information Technology, ICSITech 2017, 342–347, 2017, doi:10.1109/ICSITech.2017.8257136.
- M. Danielson, L. Ekenberg, “Trade-offs for ordinal ranking methods in multi criteria decisions,” in Lecture Notes in Business Information Processing, 2017, doi:10.1007/978-3-319-52624-9_2.
- E. Triantaphyllou, “Multi-criteria Decision Making Methods: A Comparative Study (Applied Optimization),” In Multi-Criteria Decision Making Methods: A Comparative Study, 2000, doi:10.1007/978-1-4757-3157-6.
- Edy Budiman; Armin Lawi; Supriyadi La Wungo, Implementation of SVM Kernels for Identifying Irregularities Usage of Smart Electric Voucher, 2019, doi:https://doi.org/10.1109/ICCED46541.2019.9161077.
- M. Wati, N. Novirasari, E. Budiman, Haeruddin, “Multi-Criteria Decision-Making for Evaluation of Student Academic Performance Based on Objective Weights,” in 2018 Third International Conference on Informatics and Computing (ICIC), IEEE, Palembang: 1–5, 2018, doi:10.1109/IAC.2018.8780421.
- P. Chatterjee, S. Chakraborty, “A comparative analysis of VIKOR method and its variants,” Decision Science Letters, 2016, doi:10.5267/j.dsl.2016.5.004.
- E. Budiman, Haviluddin, N. Dengan, A.H. Kridalaksana, M. Wati, Purnawansyah, Performance of Decision Tree C4.5 Algorithm in Student Academic Evaluation, 2018, doi:10.1007/978-981-10-8276-4_36.
- S. Narkhede, Understanding Confusion Matrix – Towards Data Science, Towards Data Science, 2018.
- N. Dengen, Haviluddin, L. Andriyani, M. Wati, E. Budiman, F. Alameka, “Medicine Stock Forecasting Using Least Square Method,” in Proceedings – 2nd East Indonesia Conference on Computer and Information Technology: Internet of Things for Industry, EIConCIT 2018, 2018, doi:10.1109/EIConCIT.2018.8878563.
Citations by Dimensions
Citations by PlumX
Google Scholar
Scopus
Crossref Citations
- C. Renga Akash, P. K. Vivekanandhan, M. Adam Khan, G. Ebenezer, K. Vinoth, J. Prithivirajan, V. J. Pranesh Kishan, "Assessment of ridge regression-based machine learning model for the prediction of automotive sales based on the customer requirements." Interactions, vol. 245, no. 1, pp. , 2024.
- Anath Rau Krishnan, "Past efforts in determining suitable normalization methods for multi-criteria decision-making: A short survey." Frontiers in Big Data, vol. 5, no. , pp. , 2022.
- Gubtha Mahendra Putra, Edy Budiman, Yonatan Malewa, Dedy Cahyadi, Medi Taruk, Ummul Hairah, "4G LTE Experience: Reference Signal Received Power, Noise Ratio and Quality." In 2021 3rd East Indonesia Conference on Computer and Information Technology (EIConCIT), pp. 139, 2021.
- Nguyen Hong Son, Dang Xuan Thao, Nguyen Van Thien, "Development of alternative data normalization methods for the MCRAT method in multi-criteria decision-making." EUREKA: Physics and Engineering, vol. , no. 1, pp. 132, 2024.
- Nazanin Vafaei, Vasco Delgado-Gomes, Carlos Agostinho, Ricardo Jardim-Goncalves, "Analysis of Data Normalization in Decision Making Process for ICU's Patients During the Pandemic." Procedia Computer Science, vol. 214, no. , pp. 809, 2022.
No. of Downloads Per Month
No. of Downloads Per Country