Synthesis and Characterization of Graphene Oxide Under Different Conditions, and a Preliminary Study on its Efficacy to Adsorb Cu\(^{2+}\)

Adv. Sci. Technol. Eng. Syst. J. 6(1), 10–16 (2021);
 DOI: 10.25046/aj060102
Graphene oxide (GO) was prepared by the modified Hummer’s method, but the mass ratio of graphite to sodium nitrate (NaNO3) was varied from 2:1, 1:1, and 1:2. The primary reason for the variation was to determine the optimum conditions that would afford more oxygen functional groups to improve the material for application in adsorption. The final products, termed GO2:1, GO1:1 and GO1:2, were analyzed by several instrumental techniques. The layered structure of the GO sheet was established by transmission electron microscopy, while powder X-ray diffraction showed that the GO2:1 material was more crystalline than either GO1:1 or GO1:2. Raman spectroscopy revealed the presence of a greater defect density in GO2:1. The presence of oxygen functional groups was verified by Fourier transform infrared spectroscopy, and these were quantified by the Boehm titration method. Overall, GO2:1 had a larger oxygen content than either GO1:1 or GO1:2, and a larger specific surface area. A preliminary study on the adsorption properties of the samples revealed that GO2:1 exhibited the highest percentage removal for Cu2+ in aqueous solution. Thus, the preparation of graphene oxide with a smaller amount of NaNO3 yielded a material with a greater oxygen content, which showed suitable properties for the adsorption of contaminants in wastewaters.
1. Introduction
Graphene is a 2D nanomaterial that consists of sp2 hybridized carbon atoms arranged in a hexagonal pattern [1]. This ultra-thin material is crystalline and has several remarkable properties. It has an outstandingly high surface area (2630 m2 g-1 for a one-atom-thick flat sheet of graphene) [2], electrical and thermal conductivities, electron transport capabilities, and excellent tensile strength. These exceptional features have created considerable research interest and industrial implementation in areas such as supercapacitors [3], hydrogen production [4], sensors [5], adsorption [6], and support fillers [7] for nanocomposites [8].
Graphene oxide (GO) comprises of a single sheet of graphite oxide and is prepared by the action of strong oxidizers on graphite [1, 9, 10]. GO can easily be exfoliated and dispersed in different solvents due to its hydrophilicity [11, 12]. The hydrophilic nature of GO enables it to be evenly distributed on a substrate in the form of thin films, which is important in the production of electronic devices [13]. The presence of oxygenic functional groups, including carbonyl, carboxylic, epoxide and hydroxyl groups, the high surface area and hydrophilicity make GO flakes an excellent prospective sorbent material [14, 15]. These oxygen functional groups can complex with toxic metal cations through sharing of lone pairs of electrons. A large adsorption capacity is exhibited as a consequence of the large surface area of GO [16-18]. The hydrophilicity of oxidized graphite allows water to be absorbed into the layered structure, which further increases the gap between the layers to 1.15 nm [19], which allows for improved metal binding.
Graphene oxide is synthesised by using Hummer’s method in which graphite is oxidized by reacting it with potassium permanganate and sodium nitrate in concentrated sulfuric acid [1]. Numerous reports describe the high adsorption capacity of GO for antibiotics [20, 21], heavy metals [15, 16], and dyes [21, 22]. Graphene oxide has been stated to possess an improved adsorption efficiency than other frequently used sorbent materials as a consequence of the number of O-containing moieties it possesses [14, 16]. Adsorption is the most cost-effective and resourceful procedure for the sequestration of pollutants from contaminated water [22-24]. This water remediation technique has been studied with a wide variety of adsorbent materials, including waste biomass [25], peat moss [26], zeolites [27] and hydrogels [28], to name only a few.
Although many investigations on the preparation of graphene oxide have been published, there are no studies that discuss the preparation of GO that will afford more oxygen functional groups for the elimination of contaminants from wastewater [14, 16, 23]. Hence, the objectives of this work were to synthesize GO via a modified Hummers method; to establish the optimum synthesis conditions that would provide more oxygenic functional groups on GO, and to apply the most functionalised product for the removal of contaminants from wastewater. The products obtained were characterized by several methods which include transmission electron microscopy (TEM), scanning electron microscopy (SEM), powder X-ray diffraction (XRD), thermogravimetric analysis (TGA), Raman spectroscopy, Fourier transform infrared spectroscopy (FTIR), Brunauer-Emmett-Teller (BET) surface area analysis, Boehm titration, and elemental analysis.
2. Experimental
2.1. Materials
Analytical grade chemicals, including graphite powder (<20 µm, synthetic), sodium hydroxide (NaOH), potassium permanganate (KMnO4), 98% sulphuric acid (H2SO4), 30% hydrogen peroxide (H2O2), 32% hydrochloric acid (HCl), copper metal and nitric acid (HNO3), were utilized without further purification. They were obtained from Sigma-Aldrich (Pty) Ltd, South Africa. Milli-Q H2O was from a Millipore Milli-Q Integral water purification system.
2.2. Synthesis of graphene oxide
Different variants of GO were synthesized according to the modified Hummer’s method [1] by varying the mass ratio of graphite to sodium nitrate from 2:1, 1:1 and 1:2 respectively. The products obtained were named GO2:1, GO1:1, and GO1:2 respectively. The preparation method was as previously described [29].
2.3. Characterization
The GO2:1, GO1:1 and GO1:2, materials were analyzed to authenticate the homogeneity and structure of the products prepared. The morphology of the materials was investigated by scanning electron microscopy (SEM) (ZEISS Ultra PLUS) and structural information was obtained from transmission electron microscopy (JEOL, JEM 1010). X-ray diffractograms of the materials were measured with a Bruker Advance D8 spectrometer utilizing Cu Kα radiation at 40 mA and 45 kV. Raman spectra of the materials were recorded with a DeltaNu Advantage 532TM® Raman spectrometer with a Nd:YAG laser source and excitation at a wavelength of 532 nm. The thermal stability of the materials was determined in a nitrogen atmosphere with a PerkinElmer Simultaneous Thermal Analyser STA 6000 instrument. The samples were heated from ambient temperature to 1000 °C at a rate of 10 °C/min with a nitrogen flow rate of 50 mL/min. The textural properties of the samples were determined with a Micromeritics Tristar ASAP 3020 surface area and porosity analyser by using nitrogen gas as the adsorbent. The functional groups present were identified by FTIR with a PerkimElmer Spectrum RX1 spectrophotometer, using a pressed disc of each powder mixed with KBr. Elemental analysis of the materials was performed with a Thermo Scientific CHNS/O LECO CHNS-932 elemental analyser. The Boehm titration method was used for quantifying the surface groups on the carbon materials as follows. The number of acidic functional groups on the surfaces of the GO samples were measured with base solutions of increasing strength known as reaction bases such as NaOH, Na2CO3, and NaHCO3. To determine the acidic sites of the materials, 0.2 g of the samples were weighed separately into 20 mL aliquots of solutions of 0.1 mol dm-3 NaOH, 0.05 mol dm-3 Na2CO3, and 0.1 mol dm-3 NaHCO3 and then agitated in a shaking water bath for 24 h. The solutions were filtered, and 5 mL of the filtrates were back-titrated against a standardized 0.05 mol dm-3 HCl solution. It is suggested that sodium hydroxide (NaOH) neutralizes the lactonic, phenolic and carboxylic groups, while sodium carbonate (Na2CO3) neutralizes the lactonic and carboxylic groups, and sodium bicarbonate (NaHCO3) neutralizes the carboxylic groups. Thus, by difference, the quantity of each type of functional group can be determined.
2.4. Determination of adsorption capacity
A batch adsorption technique, with Cu2+ as the adsorbate, was used to determine the adsorption capacity of the GO materials. For this, a standard Cu2+ stock solution was prepared by dissolving 1.0 g of pure Cu metal into 10 mL of concentrated nitric acid (HNO3). The stock solution was made up to a final volume of 1000 mL with deionized water. This solution was subsequently diluted to prepare working solutions of known concentrations.
A Metrohm 827 pH-meter was used for measuring the pH, and a Mettler AE 200 balance was used for weighing of samples.
The dependence of the adsorption of GO1:1, GO1:2 and GO2:1 was determined by varying the adsorbent dose from 10 to 60 mg in contact with 20 mL of 20 mg dm-3 of Cu2+ solution at a pH of 5. The samples were agitated in a thermostated shaking water bath set at 25 °C for 5 h, and subsequently filtered through Whatman No. 1 filter paper. The filtrates were analysed for their Cu2+ content at a wavelength of 220.353 nm with a PerkinElmer Optima 5300 DV inductively coupled plasma-optical emission spectrometer (ICP-OES).
The adsorption efficiency, qe (in mg g-1), was estimated from (1):
![]() where V is the volume (in dm3) of the adsorbate solution, m is the mass of adsorbent (in mg), and Ci and Ceq are the initial and equilibrium concentration of adsorbate (in mg dm-3) respectively. The percentage sequestration of Cu2+ was derived from (2).
where V is the volume (in dm3) of the adsorbate solution, m is the mass of adsorbent (in mg), and Ci and Ceq are the initial and equilibrium concentration of adsorbate (in mg dm-3) respectively. The percentage sequestration of Cu2+ was derived from (2).
 3. Results and discussion
In this work, different variants of GO (2:1, 1:1, 1:2) were synthesised via a modified Hummer’s method. The GO samples were characterized by several techniques, and then tested for the adsorption capacity of a representative heavy metal cation contaminant, namely Cu2+, in aqueous solution.
3.1. Morphology
The surface morphologies of the different GO samples were measured by SEM techniques. The SEM micrographs of GO2:1, GO1:1 and GO1:2 are shown in Figure 1. In order to acquire these images, the GO samples were coated with a gold film fractured surface under liquid nitrogen. The surface morphology showed how the GO sheets are exfoliated for the different GO materials. The SEM micrographs show that the GO materials have a 2D sheet-like structure with a multiple lamellar layer structure that distinguishes the edges of the individual sheets. The GO sheets were thick, particularly at the edges, and this thickness arises from the O-functional groups introduced.
 Figure 1: SEM images of GO samples: (a) GO2:1, scale bar = 1 μm, (b) GO1:1, scale bar = 1 μm, and (c) GO1:2, scale bar = 1 μm
The TEM micrographs of the GO materials (Figure 2) revealed the anticipated layered structure of GO with a large sheet on top of the grids. The sheet resembles a transparent wrinkled, folded and silk-like veil due to the oxidation of graphite. This characteristic has been reported for the synthesis of GO by the modified Hummer’s method regardless of the ratios of graphite to sodium nitrate [30]. The exfoliation of the graphite layer and introduction of defects on the GO layer is due to the introduction of oxygenic functional groups. From the TEM images, the level of transparency in the variants of GO might be as a result of the different ratios of graphite to sodium nitrate resulting in the intercalation of GO intermediates.
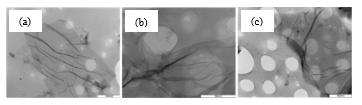 Figure 2: TEM images of GO samples: (a) GO2:1, scale bar = 1000 nm (b) GO1:1, scale bar = 1000 nm, and (c) GO1:2, scale bar = 1000 nm
3.2. Crystallinity
The structural properties of the GO materials were examined by means of powder XRD. The diffractograms for GO1:1, GO1:2 and GO2:1 are shown in Figure 3. There is a sharp diffraction peak for graphite at 2θ = 26.5° corresponding to a d-spacing of 0.34 nm of the graphite layers [31]. The characteristics of graphite at 42° disappeared after the oxidation process and a notable strong peak, for GO2:1 at 2θ = 10.49°, GO1:1 at 2θ = 10.47°, and GO1:2 at 2θ = 10.48°, emerged. The increase in the interlayer spacing of GO to that of graphite arises from the introduction of O-containing functional groups, such as epoxide, hydroxyl, carboxylic and carbonyl groups, during the oxidative treatment [32]. The van der Waals interactions operative between the graphene sheets are weakened by the O-functional groups of GO and this increases the distance between the sheets [33-35]. In the diffractogram for GO2:1 a strong peak at 2θ = 43° is seen after oxidation indicating a random packing of the sheets [36]. The XRD results confirmed that the oxygenic functional groups were intercalated into the graphite interlayers.
 Figure 3: Powder X-ray diffractograms for GO samples
Selected area electron diffraction (SAED) allows for a diffraction pattern to be obtained with a transmission electron microscope [37]. It can be used to find the d-spacing of the crystal planes and also to obtain information about the crystallinity of the samples. The brighter the spots, the more crystalline is the sample. The reciprocal of the radius of the SAED ring is the d-spacing of that ring, and the d-spacings for GO1:1, GO1:2 and GO2:1 were determined as 0.2046, 0.1997 and 0.2131 nm respectively (Figure 4). From the SAED images, GO2:1 was found to be the most crystalline of the three samples.
 Figure 4: SAED patterns for (a) GO1:1, (b) GO1:2 and (c) GO2:1
3.3. Graphitic and defective nature
Raman spectroscopy is an essential method for determining the defects, thermal conductivity, and strain in graphene and related materials [38]. The main aspects of the Raman spectra of graphitic C-based materials include the D and G bands, and their overtones. In the Raman spectra (Figure 5), the D bands of GO1:1, GO1:2 and GO2:1 have very strong peaks at 1353, 1350 and 1347 cm-1 respectively. The D-peaks are associated with the vibration of sp3 carbon atoms of defects that are randomly arranged on the GO sheets. The D-peak intensity together with a large peak width indicates significant structural disorder in the GO samples. The wavenumbers at 1595, 1593 and 1596 cm-1, respectively, represent the G bands, which are related to the vibration of sp2 C-atoms in the graphitic 2D hexagonal lattice. This gives rise to in-plane optical vibrations that relate to the E2g phonons from the bond stretching of the sp2 carbon atoms in a graphitic 2D hexagonal lattice. The ratio of the areas under the D- and G-bands (ID/IG) is used to measure the graphitic nature of the sample. For these samples, the order of the ID/IG ratio is GO2:1 (1.02) ˃ GO1:2 (0.97) ˃ GO1:1 (0.93). This result shows that GO2:1 shows a greater defective density.
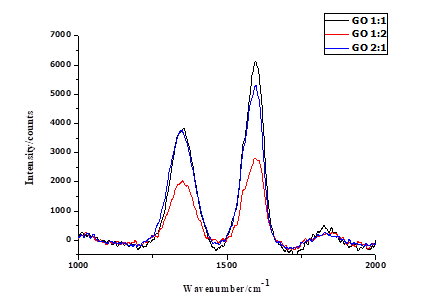 Figure 5: Raman spectra for GO samples
 Figure 6: Thermograms of graphene oxide samples recorded in a N2 atmosphere
3.4. Thermal stability
Thermal analysis was performed to assess the thermal stability of the GO1:1, GO1:2, and GO2:1 sheets, since oxygen functional groups present in GO decompose on heating. Figures 6 and 7 depict the thermograms and derivative thermograms of the GO samples respectively. The first mass loss, that takes place at a temperature of 100 °C, is primarily due to the evaporation of adsorbed water that has interacted with the O-containing functional groups on GO [39, 40]. According to Dreyer et al. [41], the interaction of water with GO is by hydrogen bonding. The second mass loss arises from the pyrolysis of unstable O-containing functional groups such as carboxylic, hydroxyl and carbonyl groups to give CO2, CO and H2O [42, 43]. In GO1:1, GO1:2 and GO2:1 this loss occurred at a temperature of 202, 212 and 216 °C respectively. The final mass loss at 614, 617 and 587 °C for GO1:1, GO1:2 and GO2:1 respectively, shows that there is a reduction in the thermal stability of graphene oxide relative to graphite [44]. The derivative thermograms for the GO samples shown in Figure 7, revealed a small exothermic peak at 614, 617, and 587 °C. At 202, 212, and 216 °C, a larger exothermic peak is seen, and this is due to the loss of CO2 and CO from the GO samples as a result of the decomposition of O-containing functional groups.
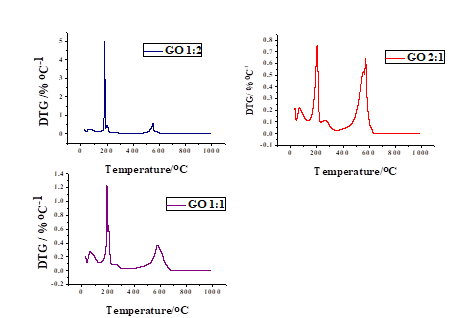 Figure 7: Derivative thermograms of graphene oxide samples
3.5. Textural properties
The BET method was used to determine the specific surface areas of the GO materials with N2 as the adsorbed gas. In the first step, the materials were degassed at 120 K for 24 h. The results are shown in Table 1. The pores can be grouped into micro-, meso- or macro-pores, based on diameter. The results obtained for GO2:1 (3.841 nm), GO1:1 (7.350 nm) and GO1:2 (19.861 nm) correspond to mesopores. The largest BET surface area was displayed by GO2:1 (179.25 m2 g-1), followed by GO1:1 (82.68 m2 g-1) and, lastly, by GO1:2 (58.35 m2 g-1).
Table 1: Physical properties of the GO2:1, GO1:1 and GO1:2 materials
| Sample | Surface area/m2 g-1 | Pore volume/cm3 g-1 | Pore diameter/nm |
| GO2:1 | 179.25 | 0.051 | 3.841 |
| GO1:1 | 82.68 | 0.054 | 7.350 |
| GO1:2 | 58.35 | 0.122 | 19.861 |
 Figure 8: BET nitrogen adsorption-desorption isotherms
The N2 adsorption-desorption isotherms for the GO samples are depicted in Figure 8. GO1:1 and GO1:2 exhibited type IV isotherms and type H3 hysteresis loops, signifying that the nanomaterials are mesoporous, as determined from the pore diameters. GO2:1 also exhibited a type IV isotherm but has a H4 type of hysteresis loop. The type IV isotherm represents an adsorption isotherm with hysteresis related with capillary condensation in mesopores [45, 46]. The Barrett-Joyner-Halenda (BHJ) pore volumes of the samples are GO1:1 (0.054 cm3 g-1), GO1:2 (0.122 cm3 g-1) and GO2:1 (0.051 cm3 g-1) (Figure 9).
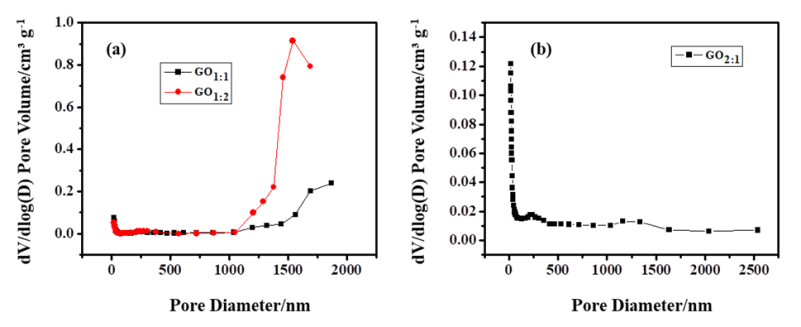 Figure 9: The BHJ pore volumes of (a) GO1:1, GO1:2 and (b) GO2:1
3.6. Nature of oxygen functional groups
FTIR spectrophotometric characterisation was conducted to explore the nature of the functional groups on the GO products and to confirm the formation of GO by chemical treatment of graphite (Figure 10). From the spectra of the GO samples, it is clear that large amounts of O-containing functional groups are present on the surfaces of the samples. The broad peak at 3430 cm-1 can be attributed to the free and associated O-H stretch arising from the presence of adsorbed water molecules and structural hydroxyl groups (–COH and –COOH) of GO [47]. The peak at 1728 cm-1 is assigned to the C=O groups. The peaks at 1626 cm-1 can be assigned to C=C groups that are due to the structure of the graphitic layer retained previously and after the oxidation process [48]. The peaks at 1220 and 1092 cm-1 are related to the C-O groups. From the results obtained, it is apparent that GO2:1 shows the strongest and sharpest peaks in the C-O region, but these peaks are absent in the spectrum of GO1:1 at 1220 cm-1. The presence of C-O and C=O groups after the oxidation process confirms the successful functionalization of the samples, and the conversion of graphite into GO. This is in agreement with previous reports [49, 50]. Additionally, peaks at 1728 cm-1 due to the C=O stretch (COOH of carboxyl or carbonyl groups), at 1626 cm-1 due to the C=C stretch, and at 1092 cm-1 due to the C-O groups, appear in all the GO samples. Hence, there is evidence that GO was successfully synthesized, and the functional groups present on the surfaces of the GO sheets can furnish abundant adsorption sites, to increase the adsorption capacity for both organic and inorganic pollutants.
3.7. Elemental analysis
Elemental analysis was undertaken to ascertain the C, H and O elemental composition of the samples. From the results, it is apparent that GO2:1 has the largest oxygen content of the three products (see Table 2). The oxygen content of GO2:1 was 40.01%. Also, the C/O ratio for GO2:1 is the smallest, also indicating the greater oxygen content. The H present in the GO products mainly arises from the presence of O-containing functional groups. The S is a residual impurity from H2SO4 used in the synthesis of the GO samples.
 Figure 10: FTIR spectra of GO samples
Table 2: Elemental composition of GO samples
| Material | C/% | H/% | S/% | O/% |
| GO1:1 | 40.83 | 2.46 | 1.89 | 31.71 |
| GO1:2 | 42.35 | 2.59 | 1.97 | 32.02 |
| GO2:1 | 45.86 | 2.04 | 0.94 | 40.01 |
Table 3: Concentrations of acidic functional groups on the surfaces of GO1:1, GO1:2 and GO2:1 as determined by the Boehm titration method
| Sample | Base solution | Concentration neutralized/
mmol g-1 |
Functional group | Concentration/mmol g-1 |
| GO1:1 | NaOH | 2.42 | Phenolic | 0.43 |
| Na2CO3 | 1.99 | Lactonic | 0.40 | |
| NaHCO3 | 1.59 | Carboxylic | 1.59 | |
| GO1:2 | NaOH | 3.15 | Phenolic | 1.26 |
| Na2CO3 | 1.89 | Lactonic | 0.40 | |
| NaHCO3 | 1.49 | Carboxylic | 1.49 | |
| GO2:1 | NaOH | 2.42 | Phenolic | 0.43 |
| Na2CO3 | 1.99 | Lactonic | 0.40 | |
| NaHCO3 | 1.59 | Carboxylic | 1.59 |
3.8. Quantity of acidic oxygen functional groups
The surface properties of the different GO materials were examined by using the Boehm titration method. The acidic properties of the GO variants are determined by the carboxylic, lactonic and phenolic functional groups (Table 3). These functional groups vary in their acidities and can be differentiated by neutralization with different basic solutions, namely, NaHCO3, Na2CO3 and NaOH. The concentration of strong acid groups on GO1:1, GO1:2 and GO2:1 was determined from the titre values of NaHCO3, and that of strong and weak acidic functional groups was from that of Na2CO3 which gave 1.99, 1.89 and 1.99 mmol g-1 respectively. The concentration of weak acids was determined by the difference in the two titration values. The concentrations of the carboxylic acid groups were found to be 1.59, 1.49 and 1.59 mmol g-1 respectively. The overall concentration of the phenolic, and the strong and weak acidic functional groups was found from the amount of NaOH neutralized. The total sum of the acidic functional groups on the GO1:1, GO1:2 and GO2:1 surface was found to be 2.42, 3.15 and 2.42 mmol g-1 respectively. The phenolic functional group concentrations were determined from the difference in the three titration methods. From the results obtained, GO1:1 and GO2:1 are similar, whereas GO1:2 contains significantly more phenolic groups than the other two samples. Therefore, the acidic surface functional groups of the samples are suitable for the uptake of cationic pollutants from aqueous solution. For each sample, the order of the number of acidic groups is carboxylic > phenolic ˃ lactonic.
3.9. Adsorption properties
The effect of the adsorbent dose on the adsorption of Cu2+ from aqueous solution was determined by varying the mass of the GO samples from 10 to 60 mg at a constant temperature of 25 °C for 5 h. The results, shown in Figure 11, indicate that as the sorbent dose increases, the percentage of Cu2+ ions adsorbed onto the GO samples increases. An increase in the adsorbent dose with a higher percentage of adsorption arises from the increase in surface area and the availability of more binding sites for adsorption. The sorption of Cu2+ onto GO1:1 was initially low compared with the other materials; this is possibly due to its surface area and the availability of active sites on the adsorbent surface. The other two adsorbents showed similar behaviour. Overall, the removal efficiency of the three adsorbents was high, but GO2:1 showed the highest adsorption with a percentage removal of 59.7%.
 Figure 11: Effect of adsorbent dose on the adsorption of Cu2+ onto GO1:1, GO1:2 and GO2:1 [conditions: 20 mL of 20 mg dm-3 Cu2+, pH 5.0, agitation speed of 150 rpm, equilibration time 5 h, temperature 25 °C]
4. Conclusion
In this paper, GO was effectively prepared by making use of a modified Hummer’s method. In the synthesis, mass ratios of 1:1, 1:2 and 2:1 of graphite powder and NaNO3 were used. This was done in order to determine if it would alter the number of oxygenic functional groups on GO. The elemental composition of the GO2:1 material, synthesized with a 2:1 mass ratio of graphite powder to NaNO3, showed the greatest oxygen content. As indicated by SAED analysis, the GO2:1 sample was also more crystalline than the other two products. It also exhibited the largest surface area. However, the Boehm titration showed that of the three samples, GO2:1 did not contain the greatest number of acidic O-containing functional groups. Oxygen-containing moieties improve the hydrophilicity of GO so that it can form stable suspensions in aqueous media. The adsorption study revealed that the uptake of Cu2+ by GO2:1 was greater than for the other two GO samples. Thus, the synthesis of graphene oxide with a smaller quantity of NaNO3 offered a material with improved crystallinity, a larger surface area and a greater oxygen content, that showed enhanced adsorption properties. Therefore, this material was chosen for further use in the study of the uptake of both metal ions and dyes in aqueous solution.
Conflict of Interest
The authors declare no conflict of interest.
Acknowledgments
This research was financially supported by the National Research Foundation of South Africa (NRF) and the University of KwaZulu-Natal Nanotechnology Platform. O.O.O. is grateful for the award of a bursary by NRF-TWAS.
- W.S Hummers Jr, R.E Offeman, Preparation of graphitic oxide, J. Am. Chem. Soc., 80, 1339-1339, 1958. https//:doi.org/10.1021/ja01539a017
- K. Novoselov, A.K. Geim, S. Morozov, D. Jiang, M. Katsnelson, I. Grigorieva, S. Dubonos, A. Firsov, Two-dimensional gas of massless Dirac fermions in graphene, Nat., 438, 197-200, 2005. https//:doi.org/10.1038/nature04233
- V. Strauss, K. Marsh, M. Kowal, M. El-Kady, R. Kaner, A simple route to porous graphene from carbon nanodots for supercapacitor applications, Adv. Mater., 30, 1-10, 2018. https:doi.org/ 10.1002/adma.201704449
- P. Cheng, Z. Yang, H. Wang, W. Cheng, M. Chen, W. Shangguan, G. Ding, TiO2–graphene nanocomposites for photocatalytic hydrogen production from splitting water, Int. J. of Hydrogen Energy, 37, 2224-2230, 2012. https//:doi.org/10.1111/j.1750-3841.2012.02868.x
- A. Nag, A. Mitra, S. Mukhopadhyay, Graphene and its sensor-based applications: A review, Sens. and Actuators A: Physical, 270, 177-194, 2018. https//:doi.org/10.1016/j.sna.2017.12.028
- Z. Li, F. Chen, L. Yuan, Y. Liu, Y. Zhao, Z. Chai, W. Shi, Uranium(VI) adsorption on graphene oxide nanosheets from aqueous solutions, Chem. Eng. J., 210, 539-546, 2012. https//:doi.org/10.1016/j.cej.2012.09.030
- P. Bhawal, S. Ganguly, T. Chaki, N. Das, Synthesis and characterization of graphene oxide filled ethylene methyl acrylate hybrid nanocomposites, RSC Adv., 6, 781-790, 2016. https//:doi.org/10.1039/C5RA24914G
- C. Soldano, A. Mahmood, E. Dujardin, Production, properties and potential of graphene, Carbon, 48, 2127-2150, 2010. https//:doi.org/10.1016/j.carbon.2010.01.058
- V. Chandra, J. Park, Y. Chun, J.W. Lee, I.-C. Hwang, K.S. Kim, Water-dispersible magnetite-reduced graphene oxide composites for arsenic removal, ACS Nano, 4, 3979-3986, 2010. https://doi.org/10.1021/nn1008897
- G. Shao, Y. Lu, F. Wu, C. Yang, F. Zheng, Q. Wu, Graphene oxide: the mechanisms of oxidation and exfoliation, J. of Mater. Sci., 47, 4400-4409, 2012. https://10.1007/s10853-012-6294-5
- R. Ruoff, Graphene: Calling all chemists, Nat. Nanotechnol., 3, 10-11, 2008. https//:doi.org/10.1038/nnano.2007.432
- H. Jiang, Chemical preparation of graphene-based nanomaterials and their applications in chemical and biological sensors, Small, 7, 2413-2427, 2011. https://doi.org/10.1002/smll.201002352
- T.N. Ly, S. Park, Highly sensitive gas sensor using hierarchically self-assembled thin films of graphene oxide and gold nanoparticles, J. of Ind. Eng. Chem., 67, 417-428, 2018. https//:doi.org/10.1016/jiec.2018.07.016
- E.T. Mombeshora, P.G. Ndungu, V.O. Nyamori, Effect of graphite/sodium nitrate ratio and reaction time on the physicochemical properties of graphene oxide, New Carbon Mater., 32, 174-187, 2017. https://doi.org/10.1016/S1872-5805(17)60114-8
- M. Ahmed, A. Giwa, S. Hasan, Challenges and opportunities of graphene-based materials in current desalination and water purification technologies, Nanoscale Materials in Water Purification 735-758, 2019. https//:doi.org/10.1016/B978-0-12-813926-4.00033-1
- R. Sitko, E. Turek, B. Zawisza, E. Malicka, E. Talik, J. Heimann, A. Gagor, B. Feist, R. Wrzalik, Adsorption of divalent metal ions from aqueous solutions using graphene oxide, Dalton Trans., 42, 5682-5689, 2013. https//:doi.org/10.1039/c3dt33097d
- M.A. Atieh, O.Y. Bakather, B.S. Tawabini, A.A. Bukhari, M. Khaled, M. Alharthi, M. Fettouhi, F.A. Abuilaiwi, Removal of chromium(III) from water by using modified and nonmodified carbon nanotubes, J. Nanomater., 2010, 232378, 2010. https://doi.org/10.1155/2010/232378
- M. Machida, T. Mochimaru, H. Tatsumoto, Lead(II) adsorption onto the graphene layer of carbonaceous materials in aqueous solution, Carbon, 44, 2681-2688, 2006. https://doi.org/10.1016/j.carbon.2006.04.003
- A. Lerf, A. Buchsteiner, J. Pieper, S. Schöttl, I. Dekany, T. Szabo, H. Boehm, Hydration behavior and dynamics of water molecules in graphite oxide, J. Phys Chem. Solids, 67, 1106-1110, 2006. https://doi.org/10.1016/j.jpcs.2006.01.031
- Y. Gao, Y. Li, L. Zhang, H. Huang, J. Hu, S.M. Shah, X. Su, Adsorption and removal of tetracycline antibiotics from aqueous solution by graphene oxide, J. of Colloid Interface Sci., 368, 540-546, 2012. https://doi.org/10.1016/j.jcis.2011.11.015
- A.C. Sophia, E.C. Lima, N. Allaudeen, S. Rajan, Application of graphene-based materials for adsorption of pharmaceutical traces from water and wastewater- a review, Desalin. Water Treat., 57, 27573-27586, 2016. https://doi.org/10.1080/19443994.2016.1172989
- H. Yan, X. Tao, Z. Yang, K. Li, H. Yang, A. Li, R. Cheng, Effects of the oxidation degree of graphene oxide on the adsorption of methylene blue, J. Hazard. Mater., 268, 191-198, 2014. https://doi.org/10.1016/j.jhazmat.2014.01.015
- B. Kakavandi, R.R. Kalantary, M. Farzadkia, A.H. Mahvi, A. Esrafili, A. Azari, A.R. Yari, A.B. Javid, Enhanced chromium(VI) removal using activated carbon modified by zero valent iron and silver bimetallic nanoparticles, J. Enviro. Health Sci. and Eng., 12, 1-15, 2014. https://doi.org/10.1186/s40201-014-0115-5
- P. Sharma, N. Hussain, D.J. Borah, M.R. Das, Kinetics and adsorption behavior of the methyl blue at the graphene oxide/reduced graphene oxide nanosheet–water interface: a comparative study, J. Chem. Eng. Data, 58, 3477-3488, 2013. https://doi.org/10.1021/je400743r
- A.D. Schiller, A.C. Goncalves, A.D. Braccini, D. Schwantes, M.A. Campagnolo, E. Conradi, J. Zimmermann, Potential of agricultural and agroindustrial wastes as adsorbent materials of toxic heavy metals: a review, Desalination Water Treat., 187, 203-218, 2020. https//:doi.org/10.5004/dwt.2020.25094
- T. Gosset, J.-L. Trancart, D.R. Thévenot, Batch metal removal by peat. Kinetics and thermodynamics, Water Res., 20, 21-26, 1986. https://doi.org/10.1016/0043-1354(86)90209-5
- M.V. Mier, R.L. Callejas, R. Gehr, B.E.J. Cisneros, P.J. Alvarez, Heavy metal removal with Mexican clinoptilolite: multi-component ionic exchange, Water Res., 35, 373-378, 2001. https://doi.org/10.1016/S0043-1354(00)00270-0
- C.B. Godiya, S.M. Sayed, Y. Xiao, X. Lu, Highly porous egg white/polyethyleneimine hydrogel for rapid removal of heavy metal ions and catalysis in wastewater, React. Funct. Polym., 149, 104509, 2020, https://doi.org/10.1016/j.reactfunctpolym.2020.104509
- O.O. Ojo, S. B. Jonnalagadda and B. S. Martincigh, Synthesis of graphene oxide under differing conditions and its characterization, 2018 IEEE 8th International Conference on Nanomaterials: Application and Properties (NAP-2018), Zatoka, Ukraine, pp. 15-18
- S. Wang, P.J. Chia, L.L. Chua, L.H. Zhao, R.Q. Png, S. Sivaramakrishnan, M. Zhou, R.G.S. Goh, R.H. Friend, A.T.S. Wee, Band-like transport in surface-functionalized highly solution-processable graphene nanosheets, Adv. Mater., 20, 3440-3446, 2008. https://doi.org/10.1002/adma.200800279
- G. Titelman, V. Gelman, S. Bron, R. Khalfin, Y. Cohen, H. Bianco-Peled, Characteristics and microstructure of aqueous colloidal dispersions of graphite oxide, Carbon, 43, 641-649, 2005. https//:doi.org10.1016/j.carbon.2004.10.035
- M. Wojtoniszak, X. Chen, R.J. Kalenczuk, A. Wajda, J. Łapczuk, M. Kurzewski, M. Drozdzik, P.K. Chu, E. Borowiak-Palen, Synthesis, dispersion, and cytocompatibility of graphene oxide and reduced graphene oxide, Colloids and Surf., B: Biointerfaces, 89, 79-85, 2012. https://doi.org/10.1016/j.colsurfb.2011.08.026
- J. Chen, Y. Li, L. Huang, C. Li, G. Shi, High-yield preparation of graphene oxide from small graphite flakes via an improved Hummers method with a simple purification process, Carbon, 81, 826-834, 2015. https//:doi.org/10.1016/j.carbon.2014.10.033
- C. Wang, Z. Liu, S. Wang, Y. Zhang, Preparation and properties of octadecylamine modified graphene oxide/styrene-butadiene rubber composites through an improved melt compounding method, J. Appl. Polym. Sci., 133, 1-9, 2016. https://doi.org/10.1002/app.42907
- W. Gao, Graphene oxide: reduction recipes, spectroscopy, and applications, Springer, 2015. https://doi.org/10.1007/978-3-319-15500-5
- Z. Li, W. Zhang, Y. Luo, J. Yang, J.G. Hou, How graphene is cut upon oxidation?, J. Am. Chem. Soc., 131, 6320-6321, 2009. https://doi.org/10.1021/ja8094729
- J.-M. Zuo, M. Gao, J. Tao, B.Q. Li, R. Twesten, I. Petrov, Coherent nano-area electron diffraction, Microsc. Res. Tech., 64, 347-355, 2004. https//:doi.org/10.1002/jemt.20096
- L. Malard, M. Pimenta, G. Dresselhaus, M. Dresselhaus, Raman spectroscopy in graphene, Phys. Rep., 473, 51-87, 2009. doi.org/10.1016/j.physrep.2009.02.003
- X. Du, P. Guo, H. Song, X. Chen, Graphene nanosheets as electrode material for electric double-layer capacitors, Electrochim. Acta, 55, 4812-4819, 2010. https://doi.org/10.1016/j.electacta.2010.03.047
- S.A. El-Khodary, G.M. El-Enany, M. El-Okr, M. Ibrahim, Preparation and characterization of microwave reduced graphite oxide for high-performance supercapacitors, Electrochim. Acta, 150, 269-278, 2014. https://doi.org/10.1016/j.electacta.2014.10.134
- D.R. Dreyer, S. Park, C.W. Bielawski, R.S. Ruoff, The chemistry of graphene oxide, Chem. Soc. Rev., 39, 228-240, 2010. https//:doi.org/ 10.1002/ange.201002160
- V.B. Mohan, R. Brown, K. Jayaraman, D. Bhattacharyya, Characterisation of reduced graphene oxide: Effects of reduction variables on electrical conductivity, Mater. Sci. Eng. B, 193, 49-60, 2015. https://doi.org/10.1016/j.mseb.2014.11.002
- H.A. Becerril, J. Mao, Z. Liu, R.M. Stoltenberg, Z. Bao, Y. Chen, Evaluation of solution-processed reduced graphene oxide films as transparent conductors, ACS Nano, 2, 463-470, 2008. https://doi.org/10.1021/nn700375n
- C. Zhu, S. Guo, Y. Fang, S. Dong, Reducing sugar: new functional molecules for the green synthesis of graphene nanosheets, ACS Nano, 4, 2429-2437, 2010. https//:doi.org/10.1002/adma.201001068
- P. Ball, R. Evans, Temperature dependence of gas adsorption on a mesoporous solid: capillary criticality and hysteresis, Langmuir, 5, 714-723, 1989. https//:doi.org/10.1021/jp111263p
- K. A. Cychosz, M. Thommes, Progress in the physisorption characterization of nanoporous gas storage materials, Eng., 4, 559–566, 2018. https://doi.org/10.1016/j.eng.2018.06.001
- H.K. Koolivand, A. Sharif, M.R. Kashani, M. Karimi, M.K. Salooki, M.A. Semsarzadeh, Functionalized graphene oxide/polyimide nanocomposites as highly CO2-selective membranes, J. of Polym. Res., 21, 599, 2014. https://doi.org/ 10.1007/s10965-014-0599-9
- Z. Pei, L. Li, L. Sun, S. Zhang, X. Shan, S. Yang, B. Wen, Adsorption characteristics of 1,2,4-trichlorobenzene, 2,4,6-trichlorophenol, 2-naphthol and naphthalene on grapheme and graphene oxide, Carbon, 51, 156 –163, 2013. https://doi.org/10.1016/j.carbon.2012.08.024
- J. Shen, M. Shi, B. Yan, H. Ma, N. Li, M. Ye, Ionic liquid-assisted one-step hydrothermal synthesis of TiO2-reduced graphene oxide composites, Nano Res., 4, 795-800, 2011. doi: 10.1007/s12274-011-0136-7
- K. Zhou, Y. Zhu, X. Yang, X. Jiang, C. Li, Preparation of graphene–TiO2 composites with enhanced photocatalytic activity, New J. Chem., 35, 353-359, 2011. https//:doi.org/10.1039/CONj00623H