Minimizing Collisions of Self-Driving Cars by a Control System Using Predetermined Two-Dimensional Grid Localization

Adv. Sci. Technol. Eng. Syst. J. 5(6), 731–737 (2020);
 DOI: 10.25046/aj050688
Most crossroads use a traffic light to communicate between human-driven vehicles by conveying to the drivers when to stop and when to proceed in an organized fashion. However, the stop and wait nature of traffic lights cause slower mobility, leading to congestion. This paper presents a localization scheme based on two-dimensional (2D) flat geometry adaptation of collision avoidance of autonomous vehicles simultaneously crossing an intersection. Using a first-come-first-served policy with tile retrieval process, the collision reduction performance was evaluated through a unit test. Four self-driving prototype cars were made with the desired functionality of controlling the speed and maneuver. Through the predetermined 2D grid locales, simulations indicate the system that can control the self-driving cars through a crossroad with zero or minimal collisions using key measures such as time duration in the intersection, average speeds of the cars, and collision count.
1. Introduction
An increase in the number of cars, roads, and crossroads over the years brought problems related to traffic flow. Numerous accidents and traffic delays occur in various locations, and one of the most concerning of these is crossroads. Smith [1] claimed that almost 40 percent of all crashes in the United States involve crossroads, and about 165,000 accidents occur annually in crossroads caused by red-light runners. Though crossroads are designed to lessen accidents and traffic congestion, these become sources of problems. Some of the reasons for these are confusing navigation signs, erring drivers, and blind curves. Though the installation of stoplights and various signs at crossroads are perceived as solutions to these problems, these devices have not been effective. These devices are not so suitable for traffic calming, which may make vehicles’ flow better but not necessarily safer for drivers [2]. Accidents increased when traffic signals were introduced, and these devices are not the solutions to less dangerous roads [3]. Proposals to solve these problems include introducing autonomous vehicles (AVs) and intelligent intersection management, but there have been very few implementations in actual situations. The authors plan to address the problems of accidents and traffic congestion at crossroads using prototype vehicles whose speeds and turns will be controlled by a centralized control communications system. In this paper, prototype vehicles are referred to as autonomous, that is, self-driving cars. Ho, et al. [4] studied AVs with added high technology features like efficient 3D road map data exchange in real-time for navigation and localization. The study [5] worked on an efficient information dissemination system of 3D point cloud road map data (3DMADS) for intelligent vehicles and roadside infrastructure integrated into a vehicular fog computing architecture, which was validated with empirical mobility traces, 3D Light Detection and Ranging (LIDAR) data, and an experimental multi-robotic testbed. Moreover, communication between AVs and road infrastructure is vital to ensure road safety. A study [5] proposed the Road Map Data Encoding and Dissemination System (REDS), which considers roadside vehicle information through index coding of point cloud-based road map data. REDS was evaluated in a four-way junction scenario and was shown to improve overall data efficiency.
In an ideal situation, an autonomous vehicle’s path from its position to its destination would be straightforward, with no interruptions or obstacles. However, current roadways require paths to intersect with other roads, and therefore, vehicles coming from different parts of the crossroad must coordinate their movements to pass through without collisions. In an ideal situation, vehicles would only have to adjust their speed and direction enough to create sufficient duration for the crossing vehicles to weave through without stopping. The vehicles should be able to process and execute these maneuvers with high precision and minimal delay to avoid collisions. Unfortunately, the present system in place in crossroads is traffic light-based, where vehicles have to stop and wait for crossing vehicles to pass. Vehicles are needed to stay idle when their road is asked to stop, interrupting their journey. Currently, almost all vehicles are operated by humans, but AVs’ proliferation can be seen in the future, and this is the context of this paper. One primary objective of this work is to design and implement computer control to avoid a collision in crossroads without traffic lights.
The assumptions in implementing this paper are as follows: the connection quality between the vehicles and the central computer is ideal, and the crossroad is initially free of obstacles such as foreign objects and road hazards. The scope includes an implementation covering a four-way two-lane crossroad, scaled-down controllable vehicles, utilization of a clover-shaped track, at least four cars running simultaneously, and a control system that monitors the velocity of the vehicles, and performance measures of the system through its vehicle throughput. The delimitations are: the paper does not factor in human-driven vehicles, the vehicles do not abide by the SAE Level 5 definition of driving automation [6], and the cars cannot recognize foreign obstacles, which are any object that is either not an element of the track or another object not running as part of the system.
The collision control is primarily based on a control system comprised of the crossroad algorithm and the communications interface. The algorithm is responsible for taking in the vehicles’ telemetry data and deciding the correct course of actions in terms of steering and speed control. The paper adopted a first-come-first-served (FCFS) policy with an added tile retrieval process to the system. The communication interface handles the sending and receiving of data and commands between the vehicles. On top of the algorithm and the communications modules, the authors developed a data recovery tool that can be used to calculate useful statistics such as delay, number of cars per second, the car’s real-time velocity during testing, and the like. This tool is used to monitor the car and check how the algorithm adjusts its speed. The data gathering tools contribute to measuring the system’s performance and were interfaced with the communications module.
This paper is organized then as follows. Section 2 specifies the system and its simulation. Section 3 gives an analysis of the results. Finally, Section 4 concludes the paper.
2. System Design and Simulation
2.1. FCFS
The control system monitors the intersection and the vehicles crossing it. Vehicles communicate with the control system to obtain a reservation and cross the intersection without colliding with other vehicles. It is implemented using a tile-based approach and the FCFS policy. The control system applies the FCFS for vehicles’ reservations, meaning that vehicles that requested a reservation will be entertained first. When another vehicle requests a reservation, it will be checked first from vehicles that had made successful reservations earlier. FCFS determines if vehicles will be reserved or not.
Conversely, FCFS results in determining which vehicles will cross the intersection first. Vehicles are entertained based on the order of requests sent; that is, the first vehicle that sends a request is served first, regardless of speed. The tile-based FCFS, developed by Dresner and Stone [7], is the basic reservation system. The significance of adopting the FCFS is its versatility because it can be extended to many different purposes in autonomous intersection management (AIM). The intersection model used is an n-by-n grid of tiles. Thus, the approach being “tile-based.” In this model, n is called the granularity of the policy or the intersection’s resolution. In implementing FCFS, the tile retrieval process is added. Using data structures and modular arithmetic, the tiles are retrieved starting from the vehicle’s bounds, then to the inside.
2.2. Reservations
When the vehicle sends a request for a reservation, the control system receives the request and simulates the vehicle’s path when it crosses the intersection. As the vehicle crosses the intersection in the control system, it occupies a set of tiles, which are then checked against tiles that had been reserved by other vehicles. If no more than two vehicles occupy the same tile, no collision will occur, and hence, the control system issues the reservation, and the vehicle, accepting parameters from the control system such as speed and acceleration, may now cross the intersection. Otherwise, the request of the vehicle is rejected. Reservations are managed by a map where the reserved path through the intersection corresponds with the ID of the reserved vehicle.
2.3. Car Simulation
The car runs on a program independent of the control system. For reservations to commence, the car and the control system must exchange information. The control system follows the principle of AIM [8]. The simulation of the cars would maintain minimal communication complexity. After the reservation, it is the car’s responsibility to meet the reservation at the correct time and place.
2.4. Predetermined 2D Grid
A localization scheme, which the authors refer to as a predetermined 2D grid, is an alternative solution for determining the cars’ location. The cars’ path is determined by their states, such as their current steering and throttle power. In other words, the locations are preprogrammed into the vehicles instead of fetching locations in real-time. The car commands that correspond to an appropriate maneuver are defined by specific coordinates in the track and the car’s motion state. Each car is given an initial state consisting of x and y coordinates, speed, orientation, and route direction (left turn, right turn, or straight). With each pair of x and y coordinates, there is a corresponding car command. In this way, accurate navigation results for cars crossing the intersection. These car objects are then passed through the system that simulates the cars for a given time. The results are a predetermined set of coordinates and a set of car commands over time.
2.5. Track Generation
The physical track (Sec. 2.9) on which the cars would be navigating was recreated in the simulation with the same dimensions and geometry. The crucial role of the simulated track is to provide cars with a driving line. To make the simulation versatile enough to accommodate multiple shapes and sizes of the track needed for testing, the track is subdivided into multiple track segment classes. The Track Segment class is the basic building block when constructing a full track for the simulation. Given the x and y locations, the track segment can return the distance to the nearest point of the driving line and the direction at that point. Each segment shape has a different method for calculating the distance from the driving line and direction.
2.6. Steering Adjustments
For steering, the car is concerned with its lateral distance from the driving line and its current orientation with respect to the driving line. Using these two data points, the car can either steer right, left, or straight. The goal for the car is to be centered on the driving line as much as possible. If the car deviates from the center in a specific direction, it is programmed to correct itself by steering in the opposite direction. It accomplishes this by simply checking if its distance from the centerline is higher than an absolute threshold value at which it will then start to steer in the direction towards the center of the lane.
2.7. Throttle Adjustments
Throttle adjustments are based on what is in front and behind that car, as well as the reservations. When a car is approaching a crossroad, it cannot merely adjust its speed based on the cars in front of it. The other cars inside or approaching the intersection must be taken into consideration. With that said, the car would leave the decision to maintain or decrease its speed to the reservation given by the control system. The control system evaluates two conditions that determine the throttle adjustment. If there is already an existing reservation, it should maintain its current speed since its present course is already approved. On the other hand, a rejection of a reservation request would indicate that there would be a collision if the car were to maintain its speed, and thus, would decrement its speed and send another request to the control system.
2.8. Communications Protocol
Between the computer program and the connected controllers that handle localization and car communication, the format of their messages are as follows: preamble, length, message type, and data. The preamble is a predetermined set of bytes used to indicate to the receiver that a message is incoming. The length is a single byte used to indicate the length of the entire message. This message can vary depending on the number of bytes used for sending data if applicable.
2.9. Road Track Design
The track design is based on a two-lane four-way crossroad that accommodates at least four cars. As shown in Figure 1, the important parameters are road shape, lines, and dimensions in the track design. The size of the track, the distance of the lane, and the intersection dimension are limited to the turning radius of the self-driving car.

Figure 1: Test Track Map. The scaling was based on the turning radius of the car wheels.
2.10. Scaling Method
The scaling method followed the turning radius of the self-driving car instead of its dimensions. This scaling was done because the simulated car’s steering angle was much larger than that of life-sized cars, resulting in the self-driving car taking wider turns than expected based on its dimensions. The dimensions of the test track, the self-driving cars’ resulting dimensions, and their speeds in the simulation would be proportional to the ratio between its turning radius and the average turning radius of most common midsized passenger cars of 17 feet or 5.18 meters [9]. A scale factor of 15.94 was obtained from (1). Figure 2 shows the scaling process.
![]()
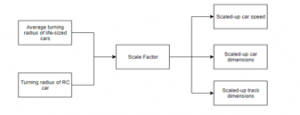
Figure 2: Scaling Process Block Diagram
2.11. System Program Flowchart
The system program flowchart is presented in Figure 3.
2.12. Evaluation
The intersection contains four entry lanes. It has no start and endpoints, and thus, it makes sense to treat the intersection as cyclic when it comes to determining the test cases. Four cars are to be arranged at the entry lanes of the intersection. The variables that determine the number of test cases are numerous, and some have infinite possibilities, such as speed, acceleration, arrival time to the intersection, and many more. Other variables are countable, such as the headings of the entry (north, south, east, west) and actions of maneuver (straight, left turn, and right turn), and these were the characteristics used.

Figure 3: System Program Flowchart
3. Results and Discussions
3.1. Crossroad Reservation Queueing
When the car sent its request for a reservation, the control system either gave an acceptance or denial. Depending on the result, the car either maintained its speed or reduced it. Each time the reservation method is called, the control system saved an entry of the reservation details and results. The most notable data in the reservation logs are the arrival time, where the Car reaches the crossroad and the car’s current throttle. An example of a summary of the test cases’ logs can be found in Table 1.
| Table 1: Crossroad Reservation Logs
|
3.2. Car Paths
After giving an initial state for each car, the system generates a predetermined 2D grid that contains all the cars’ coordinates throughout the simulation. A path of each car can then be drawn from the set of coordinates to visualize the cars’ movements.
The markers along the line represent a unique entry of coordinates from the predetermined 2D grid. In every iteration of the simulation, the car’s location and other attributes are incremented by the amount of time elapsed between iteration. Following the trend of these markers shows the path and, most importantly, the cars’ action. Analyzing the path of Cars 1 and 2 in Figure 4 shows left turn maneuvers and cars 3 and 4 showing the right turns. It can be concluded that the predetermined car paths match up with the desired test case.
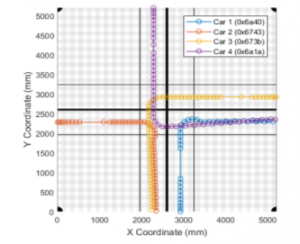
Figure 4: Car Paths for Test Case 4
3.3. Comparison of 2D Grid Simulation Results with Actual Results
The locations of the Predetermined 2D grid must be compared to the physical motions of the cars to see if they can follow the simulated paths. The range of variation in the speeds affected the time in crossroad for the physical cars. Since the simulated cars could achieve speeds far greater than the physical cars, they had several instances of spending less time in the crossroad. More often than not, the physical cars would spend more than one second in the crossroad while most predetermined cars have sub-one-second times. The predetermined and physical average speeds before and after the crossroads are presented in Table 2 and Table 3. The accuracy of the car’s movements depends on their locations predicted by the predetermined 2D grid coinciding with the actual locations on the track.
Table 2: Predetermined Average Speeds Before and After the Crossroad

Table 3: Average Physical Speeds Before and After the Crossroad
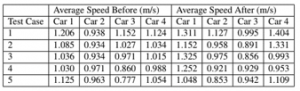
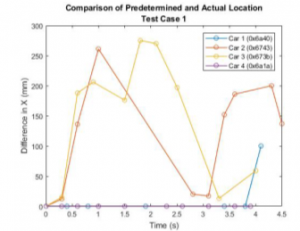
Figure 5: Comparison of Predetermined and Actual Locations Test Case 1a
Comparisons of their positions in the predetermined 2D grid and actual results were visualized in graphs in all test cases. The actual results are based on positions of remote-controlled cars acting as self-driving cars on the actual scaled-down track (Figure 1). The graphs show how much the actual locations differ from the predetermined locations of the cars. The difference between the predetermined and actual x and y coordinates in one test case is shown in Figures 5 and 6. The difference in x and y coordinates between the predetermined 2D grid location and the actual location is mostly negligible during each test’s initial seconds. As the two cars accelerate, the actual cars’ location falls slightly behind the predetermined location. However, the actual cars can also catch up back to the predetermined location, but with slight differences.
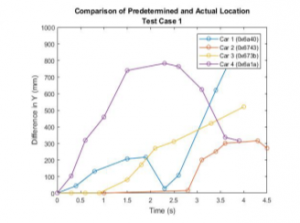
Figure 6: Comparison of Predetermined and Actual Locations Test Case 1b
One cause behind this type of deviation between the predetermined and actual results is due to the car’s nature to not go directly straight despite not being issued any commands to turn, leading to it travel a greater distance than it would have otherwise traveled, creating sizeable deviations between its actual and simulated coordinates. It was also observed during testing that as the cars were used, the power banks’ voltage level naturally also decreased, thereby making the cars’ actual speeds more inconsistent compared to their simulated speeds, thus contributing further to the variation between the simulated and actual results.
3.4. Additional Cars
The hardware adaptation is limited to only four cars, but the simulation was designed to accept more than that. To add a new car to the program, select “Add New Car” in the authors’ graphical user interface. The new car is then initialized based on the four cars’ average characteristics since the new car does not have a hardware prototype. The system was able to simulate more cars than the physical hardware of four prototype cars, and the speeds of the cars were being adjusted like the procedure in the simulation of the prototype cars. Not only the predetermined 2D grid paths of the additional cars are generated, but the car commands are also sent using their Car IDs. Figure 7 shows one of these simulations of 8 cars in a zoomed crossroad.
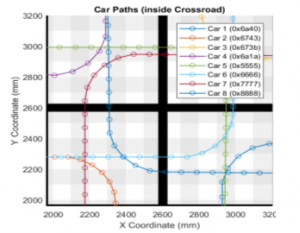
Figure 7: Eight Car Path Simulation – Zoomed in Crossroad
Reservations have an impact on the speed of the car. The eight-car scenarios resulted in more requests sent to the control system. Consequently, the increased number of cars caused the control system to issue more denials of reservations until the cars adjusted their speed accordingly. Figure 8 plots the reservation request results alongside the car’s speed through the simulation’s duration, while Figure 9 shows a car possessing an approved reservation alongside its speed versus time. When the car’s request was approved, its speed is maintained until the car exits the crossroad.
The collections of reservation requests and status of the eight cars for all test cases were established. Here, the differences between each car’s movement due to which gets approval first become apparent. Those cars that were given immediate approval, such as those who requested first, did not have to decrease their speeds. On the other hand, cars with several denials decremented several times before approval. Figure 10 shows the positive pulse of the reservation request that denotes approval lines up with its respective car beginning to maintain its speed. Likewise, the negative pulses that denote denial lines up with the car, decreasing their speeds. The approved reservation status alongside speed shows the window that the car must maintain its speed for the reservation duration. In Figure 11, the positive edge of the reservation marks the point where the speed is maintained. The negative edge marks the point where each car’s reservation is released; hence, the cars accelerate back. Between these two marks are the approved movements of the cars by the control system to avoid collisions.
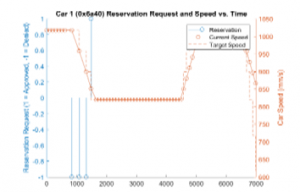
Figure 8: Reservation Requests Affecting Car’s Speed
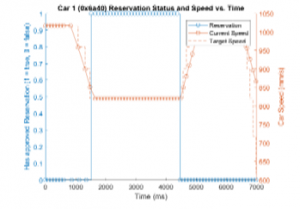
Figure 9: Reservation Status Alongside Car’s Speed. The speed unit was based on the simulations.
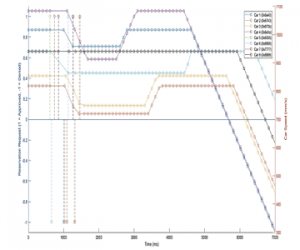
Figure 10: Effect of Reservation Requests on Car Speed. The speed unit was based on the simulations.

Figure 11: Having Approved Reservation and Car Speed. The speed unit was based on the simulations.
4. Conclusions and Recommendations
This work on a simulation design of collision avoidance of autonomous vehicles simultaneously crossing an intersection indicate that using the predetermined 2D grid can be an alternative localization scheme. Four prototype cars were modified with the specified modules and achieved the desired functionality of remotely controlling the control system’s speed and steering. The control system was able to fulfill its function of controlling all the cars and negotiating the movement inside the crossroad per test case. The predetermined 2D grid was used as an alternative solution for determining the cars’ locations increasing the accuracy of data and transmission. The result is a system that can control self-driving cars through a crossroad with minimal collisions. Furthermore, the control system using the predetermined 2D grid can perform simulation of more than four cars. Upon running the various test cases to verify the system with different car placements and maneuvers, it is concluded that the work was able to provide a fast method for vehicles to enter and exit a crossroad while avoiding slowdowns.
Recommendations include incorporating machine learning and cloud technology [5] in AVs and AIM, implementing simulation in different programming platforms, extending hardware implementation on large-scale vehicles, or 3D road maps [4]. It is also suggested to use uninterrupted, fast, and accessible communication technologies. Moreover, a useful feature would be more sensors that can keep track of attributes not necessarily related to motion. If a project were to implement a system like the predetermined 2D grid, it is recommended that the simulated cars’ characteristics to be like the physical cars that it would eventually control. Expanding the model of the car’s movement from linear acceleration to a more dynamic model would significantly improve the accuracy of the resultant predetermined coordinates, and consequently, more appropriate car commands. In addition, intelligent highway queue selectors [10] can be explored for controlling data dissemination, which might result in coordinated traffic flow at crossroads.
Conflict of Interest
The authors declare no conflict of interest.
Acknowledgment
De La Salle University is acknowledged for supporting this work.
- E. A. Smith, “Statistics on Intersection Accidents,” 2018. https://www.autoaccident.com/statistics-on-intersection-accidents.html
- R. Ewing, Traffic Calming State of the Practice. 1999. https://nacto.org/wp-content/uploads/2012/06/Ewing-Reid-1999.pdf
- N. Kazis, To Get Safer Streets, Traffic Lights and Stop Signs Aren’t the Answer. 2011. https://nyc.streetsblog.org/2011/04/26/to-get-safer-streets-traffic-lights-and-stop-signs-arent-the-answer
- I. W.-H. Ho, S. C.-K. Chau, E. R. Magsino, and K. Jia, “Efficient 3D Road Map Data Exchange for Intelligent Vehicles in Vehicular Fog Networks,” IEEE Transactions on Vehicular Technology, 69(3), 3151–3165, 2020. doi: 10.1109/TVT.2019.2963346.
- K. F. Chu, E. R. Magsino, I. W.-H. Ho, and C.-K. Chau, “Index Coding of Point Cloud-Based Road Map Data for Autonomous Driving,” in 2017 IEEE 85th Vehicular Technology Conference (VTC Spring), 1–7, 2017. doi: 10.1109/VTCSpring.2017.8108280.
- SAE International and S. O.-R. A. V. S. COMMITTEE, “Surface Vehicle Information Report: Taxonomy and Definitions for Terms Related to On-Road Motor Vehicle Automated Driving Systems,” Jan. 2014.
- K. Dresner and P. Stone, “A Multiagent Approach to Autonomous Intersection Management,” Journal of Artificial Intelligence Research, vol. 31, pp. 591–656, 2008.
- T.-C. Au, S. Zhang, and P. Stone, “Autonomous Intersection Management for Semi-Autonomous Vehicles,” Handbook of Transportation, pp. 88–104, 2015.
- Vehicle Turning Paths Dimensions and Drawings. Dimensions.Guide [Online]. Available: https://www.dimensions.guide/collection/vehicle-turning-paths-radius
- E. R. Magsino and I. W. H. Ho, “An intelligent highway tollgate queue selector for improving server utilization and vehicle waiting time,” in 2016 IEEE Region 10 Symposium (TENSYMP), 2016, pp. 271–276, doi: 10.1109/TENCONSpring.2016.7519417.