
Social Influence Factor of e-Tourism Application Case Study University Student
Volume 5, Issue 6, Page No 684-688, 2020
Author’s Name: Kristianus Oktriono1, Surjandy Surjandy2,a), Meyliana Meyliana2, Michele Carolina2, Stephanie Stephanie2
View Affiliations
1Language Center, Tourism Destination, Faculty of Humanities, Bina Nusantara University, Jakarta, 11480, Indonesia
2Information Systems Department, School of Information Systems, Bina Nusantara University, Jakarta,11480, Indonesia
a)Author to whom correspondence should be addressed. E-mail: surjandy@binus.ac.id
Adv. Sci. Technol. Eng. Syst. J. 5(6), 684-688 (2020); ![]() DOI: 10.25046/aj050682
DOI: 10.25046/aj050682
Keywords: e-Tourism, e-Tourism apps, social influence, Causal Research, Explanatory Research

Export Citations
The income generated from the tourism sector exhibits the main driving force for national revenues in Indonesian. Based on data from the Ministry of Tourism in Indonesia, it turns out that the potential tourist category originated from the cluster of college students or school-aged cohort. In this line, social media signifies a similar age of internet user based on the Indonesian Internet Service Provider Association (IISPA). In this sense, previous research underlined that all students are active users of the smartphone. Therefore, this study aims to explore how smartphones influence the student’s daily utilization in supporting applications of e-Tourism based in Indonesia. The study was conducted using descriptive analysis, causal or explanatory research and SPSS as a tool of data analysis. Operationally, the Bivariate technique serves as the means to answer research questions. As a result, this study revealed 18 relationships that affect students in utilizing smartphones for e-Tourism activities in Indonesia. This research contributes dominantly for the industry in determining the use of a tourism-based application eventually.
Received: 06 September 2020, Accepted: 18 October 2020, Published Online: 24 November 2020
1. Introduction
Tourism is one of the mainstay economic sectors of the Indonesian government [1]. Based on the results of research conducted by the Central Bureau of Statistics Indonesia, it was found that most users in tourism are clustered from aged 15-25 years. The respondents can be categorized as a college-aged cohort. Another thing related to tourism is the number of applications available to support tourism activities such as to purchase airline tickets, hotels, and trains such as Traveloka, PegiPegi, and Tiket.com. In this part, e-tourism applications seize advantages and increase engagement of the user, provider, and the system. Reflecting this condition, IISPA or AJPII also published previous research reports stating that students are active internet users in Indonesia [2]-[4]. However, the scarcity of the research is found regarding the student role in tourist [3]. In this part, these phenomena attract researchers to delve in the influence of friends (close-person), family-as undertaken in previous studies [5], and advertisements for the use of applications that support tourism activities [6]. The hypotheses in this research are formulated as follows:
- The influence for students in using smartphones for e-Tourism application
H0: No relationship was found
H1: Relationship found
- There is a social influence for students in the use of smartphones on e-Tourism applications
H0: No relationship was found
H1: Relationship found
Figure 1 exhibits the research design that includes three major elements, i.e. the students, social influence, and e-tourism applications. The students consist of university students. In this context, the aspects of social influence factor will be analyzed based on e-tourism application. The growth of technology and its advancement in tourism will influence the stakeholders in many ways. In this frame, the activity related to technology application is categorized to describe the merits and challenges towards the engagement of the users. The study highlights the significance of advertising to bolster travelling, the experience of tourist, both individual and family that becomes a determining factor in the use of applications eventually.
2. Literature Review
In this section, the authors explain the relevant and prominent literature, such as understanding of e-Tourism, causal research/explanatory research, e-tourism apps, and respondent data in this study.
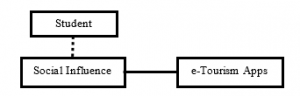
Figure 1: e-Tourism Research Design
2.1. E-Tourism
Technology contributes significantly to human existence in terms of efficiency enhancement, improving service and customers’ experience in travelling. In this line, technology has revolutionized tourism in a paradigm shift. Technically, e-tourism represents the use of electronic media or internet-based applications to bolster the tourism process such as ticket reservations, hotel reservations, and so that customers can experience comfortable. [7].
2.2. Casual Research/Explanatory Research
Causal research or explanatory research is research that is generally implemented by marketing or sales to examine the relationship and the level of influence between two factors [7]. This research perused at several prominent factors such as student background (gender, age, screen width) and the influence of peers, family, and advertisements on the use of e-Tourism support applications.
2.3. E-Tourism Application
The e-Tourism application is an application engaged to assist tourists in carrying out tourism activities such as purchasing airline tickets, train tickets, hotel reservations, booking vehicle rentals, and other related amenities.
Table 1: Data of Respondent
| No. | Description | N | % |
| 1 |
Gender (A1) Female Male |
107 213 |
33.4 66.6 |
| 2 |
Age (A2) 1. <15 Years Old (YO) 2. 16 – 20 YO 3. 21 – 25 YO >26 |
0 300 15 5 |
0 93.8 4.7 1.6 |
| 3 |
Screen Size of Smartphone (A3) 1. <4” 2. 4”-5.” 3. 5”-6.” >6” |
27 99 151 43 |
8.4 30.9 47.2 13.4 |
2.4. Respondent
This research uses a technique commonly used that is snowball sampling by utilizing services from Google based on Google Form. The questionnaire is disseminated through the internet and social media. In terms of population, this study involves the number of 320 respondents with backgrounds, as presented in table 1. The respondents can be categorized as a college-aged cohort.
3. Methodology
This descriptive study uses the SPSS application as a tool in analyzing data, and the Bivariate Technique is used to answer research questions. There are several steps needed in this research before analyzing the data, such as validation of the questions made. A test of the data reliability and after all, this is fulfilled, the analysis can be done.
3.1. Validation of Questions
In this part, researchers validate the questions using SPSS tools. The way to validate is to calculate the Corrected item-total Correlation (CI-TC) score. If the value of the CI-TC is higher than the Pearson r Table, the questions made are declared valid. In other words, in best practice, if the CI-TC value> 0.5, we ensure that the question is valid. For more details, table 2 described the questions validation.
Table 2: Questions Validation
| No. | Description | CI-TC | Status |
| 1 | People influence my behaviour to use the travelling app (SI1) | 0.673 | Valid |
| 2 | People who are important to me think that I should use the travelling app (SI2) | 0.732 | Valid |
| 3 | I do travel through the app because many people do so (SI3) | 0.665 | Valid |
| 4 | My friends are supportive of the use of travelling mobile app (SI4) | 0.628 | Valid |
|
5
|
My Family are supporting the use of travelling mobile app (SI5) | 0.585 | Valid |
| 6 | Advertisement strengthens me in using a travelling mobile app (SI6) | 0.630 | Valid |
3.2. Data Reliability
In this section, researchers conducted a test of the reliability of the data obtained, namely by looking at the scores from Cronbach’s Alpha [8]. The guidelines underscore that if the Cronbach’s alpha value is greater than 0.6, the data is reliable[8]. Table 3 explains this information in detail.
3.3. Bivariate Test Result
This section presents the results of calculations based on the bivariate method to check the relationship between 2 factors [5]. Table 4 exhibits the relationship for more details. In this stage, the hypothetical results proposed that:
H0 is rejected; it signifies the relationship between factors or H1 is accepted
H1 rejected; It indicates that there is no relationship between factors.
The p-value is examined to find out whether there is a relationship [9]. In this frame, a relationship is obtained if the p-value <0.05. Doubtless, table 4 demonstrates the relationship between factors. Related to these factors, the value ‘*’ denotes alpha 5% or 95% confidence level and for ‘**’ refers to alpha 1% or 99% confidence level. The term of NC illustrated that there is no relationship (no correlation).
Table 3: Reliability of Questions
| No. | Description | Cronbach’s Alpha | Status |
| 1 | People influence my behaviour to use a travelling app (SI1) | 0.831 | Reliable |
| 2 | People who are important to me think that I should use a travelling app (SI2) | 0.820 | Reliable |
| 3 | I do travel through the app because many people do so (SI3) | 0.833 | Reliable |
| 4 | My friends are supportive of the use of travelling mobile app (SI4) | 0.840 | Reliable |
| 5 | My Family are supporting the use of travelling mobile app (SI5) | 0.847 | Reliable |
| 6 | Advertisement strengthens me in using a travelling mobile app (SI6) | 0.840 | Reliable |
Table 4: Correlation Factors
| No. | Correlation Factors | Pearson Corr. & p-value | H0 | H1 |
| 1 | A1 & SI1 |
-0.118* 0.035 |
Reject | Accept |
| 2 | A1 & SI2 | NC | Accept | Reject |
| 3 | A1 & SI3 | NC | Accept | Reject |
| 4 | A1 & SI4 | NC | Accept | Reject |
| 5 | A1 & SI5 | NC | Accept | Reject |
| 6 | A1 & SI6 | NC | Accept | Reject |
| 7 | A2 & SI1 | NC | Accept | Reject |
| 8 | A2 & SI2 | NC | Accept | Reject |
| 9 | A2 & SI3 | NC | Accept | Reject |
| 10 | A2 & SI4 |
0.134* 0.017 |
Reject | Accept |
| 11 | A2 & SI5 | NC | Accept | Reject |
| 12 | A2 & SI6 | NC | Accept | Reject |
| 13 | A3 & SI1 | NC | Accept | Reject |
| 14 | A3 & SI2 |
-0.123* 0.027 |
Reject | Accept |
| 15 | A3 & SI3 | NC | Accept | Reject |
| 16 | A3 & SI4 | NC | Accept | Reject |
| 17 | A3 & SI5 | NC | Accept | Reject |
| 18 | A3 & SI6 | NC | Accept | Reject |
| 19 | SI1 & SI2 |
0.673** 0.000 |
Reject | Accept |
| 20 | SI1 & SI3 |
0.621** 0.000 |
Reject | Accept |
| 21 | SI1 & SI4 |
0.400** 0.000 |
Reject | Accept |
| 22 | SI1 & SI5 | 0.379** | Reject | Accept |
| 23 | SI1 & SI6 |
0.500** 0.000 |
Reject | Accept |
| 24 | SI2 & SI3 |
0.626** 0.000 |
Reject | Accept |
| 25 | SI2 & SI4 |
0.515** 0.000 |
Reject | Accept |
| 26 | SI2 & SI5 |
0.453** 0.000 |
Reject | Accept |
| 27 | SI2 & SI6 |
0.516** 0.000 |
Reject | Accept |
| 28 | SI3 & SI4 |
0.430** 0.000 |
Reject | Accept |
| 29 | SI3 & SI5 |
0.401** 0.000 |
Reject | Accept |
| 30 | SI3 & SI6 |
0.486** 0.000 |
Reject | Accept |
| 31 | SI4 & SI5 |
0.640** 0.000 |
Reject | Accept |
| 32 | SI4 & SI6 | 0.497** | Reject | Accept |
| 33 | SI5 & SI6 |
0.470** 0.000 |
Reject | Accept |
3.4. Relationship Strength
This section explains how strong the influence of the relationship between the two factors that occur, to examine how much influence (relation) exists [9] and it is represented from the magnitude of the absolute value of the Pearson correlation. The information of the values between 0.1 to 0.3 indicates the level of strength of the relationship is small, while the value of 0.3 to 0.5 is categorized as medium. The values above 0.5 states a strong relationship. To check the degree to which strength, the researchers square the Pearson correlation value and multiply it by 100 to obtain the percentage of the relationship strength as exhibited in Table 5.
Table 5: The Relationship Strength
| No. | Factor | |r| | Tension | |r|2 | % |
| 1 | A1 & SI1 | 0.118 | Low | 0.014 | 14% |
| 2 | A2 & SI4 | 0.134 | Low | 0.018 | 18% |
| 3 | A3 & SI2 | 0.123 | Low | 0.015 | 15% |
| 4 | SI1 & SI2 | 0.673 | High | 0.453 | 45.3 |
| 5 | SI1 & SI3 | 0.621 | High | 0.386 | 38.6 |
| 6 | SI1 & SI4 | 0.400 | Medium | 0.16 | 16% |
| 7 | SI1 & SI5 | 0.379 | Medium | 0.144 | 14.4% |
| 8 | SI1 & SI6 | 0.500 | High | 0.25 | 25% |
| 9 | SI2 & SI3 | 0.626 | High | 0.392 | 39.2% |
| 10 | SI2 & SI4 | 0.515 | High | 0.265 | 26.5% |
| 11 | SI2 & SI5 | 0.453 | Medium | 0.205 | 20.5% |
| 12 | SI2 & SI6 | 0.516 | High | 0.266 | 26.6% |
| 13 | SI3 & SI4 | 0.430 | Medium | 0.185 | 18.5% |
| 14 | SI3 & SI5 | 0.401 | Medium | 0.161 | 16.1% |
| 15 | SI3 & SI6 | 0.486 | Medium | 0.236 | 23.6% |
| 16 | SI4 & SI5 | 0.640 | High | 0.409 | 40.9% |
| 17 | SI4 & SI6 | 0.497 | Medium | 0.247 | 24.7% |
| 18 | SI5 & SI6 | 0.470 | Medium | 0.206 | 20.6% |
4. Result and Discussion
In this section, researchers explain the findings of the study. The calculation result values of this study are presented in Tables 4 and Table 5. This study highlights 18 relationships between factors and the magnitude of influence are as follows:
- A1 (Gender) & SI1 (People influence my behaviour to use a travelling app). It obtained the opposite relationship (minus). In this case, this study says that men (A1) tend not to be affected by the behaviour of others in using applications for travelling app.
The magnitude of the strength of influence expressed the position of 14% or low influence. The study found a similar result with the previous research [3]
- A2 (Age) & SI4 (My friends are supportive of the use of travelling mobile app). It attained that a direct or positive relationship which states that the higher the age (old), the greater the influence of friends to use the travelling app. The magnitude of the influence strength between factors is 18% or low influence.
- A3 (Screen Size) & SI2 (People who are important to me think that I should use a travelling app). It confirmed the relationship is not direct (negative) which means that the greater the width of the smartphone layer that is used the smaller or fewer people feel it is important for me always to use the travelling apps. The magnitude of the strength of influence between factors of 15% or low influence.
- SI1 (People influence my behaviour to use the travelling app) & SI2 (People who are important to me think that I should use a travelling app). It revealed a direct relationship which means the more people influence me to use the travelling app, the greater the important person also states that I have to use the travelling app. The magnitude of influence strength between factors is 45.8% or strong influence.
- SI1 (People influence my behaviour to use a travelling app) & SI3 (I do travel through the app because many people do so). It underscored a direct relationship, which means that more people influence one to use the travelling app, the more often I travel using the application — the magnitude of the strength of influence between factors of 38.6% or strong influence.
- SI1 (People influence my behaviour to use a travelling app) & SI4 (My friends are supportive of the use of travelling mobile app). It detected a direct relationship, which means that more people influenced me to use the travelling app, so more friends gave support to use the travelling app. The magnitude of the influence strength between factors is 16% or medium influence.
- SI1 (People influence my behaviour to use a travelling app) & SI5 (My Family are supporting the use of travelling mobile app). It highlights directional relationships where the higher the influence of other people influencing me to use the travelling app, the higher the support from family in using the travelling mobile app. The amount of influence strength is 14.4% or medium influence.
- SI1 (People influence my behaviour to use a travelling app) & SI6 (Advertisement strengthens me in using the travelling mobile app). It emphasized a directional or positive relationship that states that the stronger the influence of people on my behaviour using travelling apps, the more advertisements affect me to use travelling mobile apps. The magnitude of the influence strength of 25% or a strong influence.
- SI2 (People who are important to me think that I should use a travelling app) & SI3 (I do travel through the app because many people do so). This highlights a direct or positive relationship which means that the more people who have an essential relationship with me think I should use the travelling application, the higher I use the travelling application to travel. The magnitude of the effect strength is 39.2% or strong influence.
- SI2 (People who are important to me think that I should use a travelling app) & SI4 (My friends are supportive of the use of travelling mobile app). It exhibits a direct or positive relationship which means that the greater the people who have significant relationships, the higher the friends provide support to use travelling apps. The amount of influence strength is 26.5% or strong influence.
- SI2 (People who are important to me think that I should use a travelling app) & SI5 (My Family are supporting the use of travelling mobile app). It accentuates a direct or positive relationship which means that the higher the person who has an essential relationship with me states I have to use the application, the higher the support from family to use the travelling mobile app. The amount of influence strength is 20.5% or medium influence.
- SI2 (People who are important to me think that I should use a travelling app) & SI6 (Advertisement strengthens me in using the travelling mobile app). It explained a direct or positive relationship which means that the higher the person who has an essential relationship with me states that I must use the application, the higher the influence of advertising to use the travelling app. The magnitude of influence strength is 26.6% or strong influence.
- SI3 (I do travel through the app because many people do so) & SI4 (My friends are supportive of the use of travelling mobile app). It stated a direct relationship or positive which means that the higher the person who has an essential relationship with me stated that I have to use the application, the higher the influence of friends who support the use of travelling applications. The magnitude of the effect strength is 18.5% or medium influence.
- SI3 (I do travel through the app because many people do so) & SI5 (My Family are supporting the use of travelling mobile app). It described a direct or positive relationship which means the higher I use the application because many people do the same thing, the higher the family also provides support. The magnitude of the effect strength is 16.1% or medium influence.
- SI3 (I do travel through the app because many people do so) & SI6 (Advertisement strengthens me in using the travelling mobile app). It signifies a direct or positive relationship which means the higher the use of the application because other people also use the higher the effect of advertising. The amount of influence is 23.6% or medium influence.
- SI4 (My friends are supportive of the use of travelling mobile app) & SI5 (My Family are supporting the use of travelling mobile app). It explained a direct or positive relationship which means the higher the influence of friends supporting using the application, the higher the family support for using the application. The magnitude of the effect is 40.9% or strong influence.
- SI4 (My friends are supportive of the use of travelling mobile app) & SI6 (Advertisement strengthens me in using the travelling mobile app). It affirms a direct or positive relationship which means that the stronger the influence of friends to support using the travel application, the higher the effect of advertising to use the travelling app. The amount of influence is 24.7% or medium influence.
- SI5 (My Family are supporting the use of travelling mobile app) & SI6 (Advertisement strengthens me in using the travelling mobile app). It asserts a direct or positive relationship, which means that the higher the influence of the family in supporting using a travel application, the higher the effect of advertising to use the travelling app. The amount of influence is 20.6% or the medium of influence.
5. Research Limitation and Implication
This study provides an overview of implications regarding the influence of friends or colleagues, family, advertisements in utilizing e-tourism applications to support travel activities. In this part, the need to increase of adopting the website in the tourism industry serves as the means to develop the industry performance at the same time [10]. It contributes to stakeholders in developing attractive e-tourism. It adds more value to users and developers in increasing application engagement. Koo et al. stated that travellers gathered the most popular information from different available social media through the internet [11]. In this line, the marketing aspect requires strategies to promote the tourism destination and it recommends the e-tourism platform [12].
The limitations of this study are related to have not implemented the full model such as TAM or UTAUT to review the comprehensive picture. The populations are originated from domestic tourists in Indonesia.
6. Conclusion and Future Research
The conclusion of this study emphasizes the importance of advertising to support travelling, the experience of users both individuals and from families becomes a determining factor in the use of applications eventually. In this case, youth tourism plays important role in the contribution to the tourism industry because of its positive social and economic impacts [13]. The multifaceted influence of tourism increases the promotion and efficiency of the tourism product [14]. The research dominantly indicated that the more people (university student) influence someone to use the travelling app, the greater the important person also states that someone must use the travelling app. Furthermore, it underscored that more people influence one to use the travelling app, the more often one travels using the application. The strength relationship appears in SI1 & SI6, SI2 & SI3, SI2 & SI4, SI2 & SI6, SI4 & SI5. The future research will investigate the other factors that influence and prioritize the user in using the e-tourism application.
Conflict of Interest
The authors declare no conflict of interest.
Acknowledgment
Thank you for Bina Nusantara University for the support.
- Asosiasi Penyelenggara Jasa Internet Indonesia, Potret Zaman Now, Pengguna & Perilaku Internet Indonesia, Apjii, 1–7, 2018.
- B. Dictionary, What is causal research? Definition and meaning, 2019.
- I. Bizirgianni, P. Dionysopoulou, “The Influence of Tourist Trends of Youth Tourism through Social Media (SM) & Information and Communication Technologies (ICTs),” Procedia – Social and Behavioral Sciences, 73(February 2013), 652–660, 2013, doi:10.1016/j.sbspro.2013.02.102.
- S. Herayanti, P.A. Wikanatha Sagita, N.P. Eka Mahadewi, “Faktor-Faktor Yang Mempengaruhi Keputusan Wisatawan Menggunakan Situs Tripadvisor Di Kawasan Pariwisata Kuta Selatan-Bali,” Jurnal IPTA, 6(2), 149, 2018, doi:10.24843/ipta.2018.v06.i02.p09.
- IBM, Bivariate Correlations, 2019.
- P. Irfan, A. Apriani, “Analisa Strategi Pengembangan E-Tourism Sebagai Promosi Pariwisata Di Pulau Lombok,” ILKOM Jurnal Ilmiah, 9(3), 325–330, 2017, doi:10.33096/ilkom.v9i3.164.325-330.
- H. Oppewal, “Causal Research,” Wiley International Encyclopedia of Marketing, 2010, doi:10.1002/9781444316568.wiem02001.
- UCLA, What does Cronbach’s alpha mean?, 2019.
- Kristin Yeager, LibGuides: SPSS Tutorials: Pearson Correlation, 2019.
- V. Pujani, Meuthia, A.V. Iboo, “Adopsi E- tourism pada Industri Perhotelan di Kota Padang: Identifikasi Klaster Berdasarkan Karakteristik Fitur Website,” TEKNOSI, 02(03), 47–56, 2016.
- K. Chulmo, J. Youhee, H. Heejeong, C. Namho, “A structural model for destination travel intention as a media exposure: belief-desire- intention model perspective,” International Journal of Contemporary Hospitality Management, 28(7), 2016.
- A. Murtadho, M. Rifki Shihab, “ANALISIS SITUS E-TOURISM INDONESIA: STUDI TERHADAP PERSEBARAN GEOGRAFIS, PENGKLASIFIKASIAN SITUS SERTA PEMANFAATAN FUNGSI DAN FITUR,” Journal of Information Systems, 7(1), 13–25, 2011.
- World Tourism Organization, “Global Report on The Power of Youth Travel,” Affiliate Members Global Report, 13, 60, 2016.
- E. Stiakakis, M. Vlachopoulou, “The impact of social media on travelers 2.0,” Tourismos, 12(3), 48–74, 2017.