
Network Modeling with ANP to Determine the Appropriate Area for the Development of Dry Port in Thailand
Volume 5, Issue 6, Page No 676-683, 2020
Author’s Name: Jenjira Sukmaneea), Ramil Kesvarakul, Nattawut Janthong
View Affiliations
Department of Production Engineering, King Mongkut’s University of Technology North Bangkok, Bangkok, 10800, Thailand
a)Author to whom correspondence should be addressed. E-mail: Jenjira.s@eat.kmutnb.ac.th
Adv. Sci. Technol. Eng. Syst. J. 5(6), 676-683 (2020); ![]() DOI: 10.25046/aj050681
DOI: 10.25046/aj050681
Keywords: The Office of Transport and Traffic Policy and Planning (OTP), Multiple Criteria Decisions Making (MCDM), Analytic Network process (ANP) , Design Structure Matrix (DSM)

Export Citations
One drawback of the Multiple Criteria Decision Making (MCDM) problem with the Analytic Network Process (ANP) is that the origin of the network cannot be clearly defined. In addition, it is not possible to specify internal relationship between criteria and sub-criteria. The application of Design Structure Matrix (DSM) with the Partitioning Reachability Matrix method resulted in a clear understanding of the network’s origin and was able to identify the relationship of all criteria in the system. Then, the data were analyzed by the ANP process using Super Decision Program. This will result in more reliable outcomes for selecting the best alternative with higher accuracy. This case study determined the suitable area for dry port development in 5 provinces in Thailand. Based on the analysis process mentioned above, Nakhon Ratchasima is the most suitable area to build a dry port of Thailand.
Received: 31 August 2020, Accepted: 30 October 2020, Published Online: 24 November 2020
1. Introduction
Laem Chabang Port is one of the main deep-sea port for sea transportation between Thailand and other countries under the association of the Port Authority of Thailand which is located in the Laem Chabang Municipality, Si Racha and Bang Lamung, Chonburi. Presently, there are a lot of in and out containers in Laem Chabang Port. This directly affects the amount of traffic on the roads around Laem Chabang Port and the side roads over there. Therefore, it is necessary to develop a logistic transportation between Laem Chabang Port and the point of origin-endways in the country. In addition, the country’s policy focuses on the development of the country’s logistics as a mechanism to support the development of the country to be a center of trade, service and investment in the region. The development of rail transportation as well as various facilities and a logistics service center in the strategic path can be linked to industrial production bases and agricultural bases to Laem Chabang Port, which is the main trading gateway and important trade checkpoint of the country.
The Office of Transport and Traffic Policy and Planning (OTP) has recognized the importance of the problem mentioned above and agreed to study the dry port development master plan in accordance with the Cabinet’s resolution on 4 December 2017, which has determined the levels of plans of various government agencies. In order to become the regional logistics center which is one of the important mechanisms to promote the adjustment of the mode of transportation through rail transportation. OTP can save costs and reduce traffic congestion around the Laem Chabang Port in order to become the regional logistics center in the future.
From the research data to determine the suitable area for the development of a dry port, there are 5 provinces suitable for the setting. Criteria are made up of several and inter-influence decisions for determining a site, including the interconnection of transport with rail and other transport systems, urban planning and development, and environmental suitability in terms of land and land size.
The decision to select one province as an appropriate area for the development of that port is based on many of the above criteria which is a very complicated process. It is a complex process with many criteria for decision making.
In solving multiple criteria decisions making (MCDM), the Analytic Hierarchy Process (AHP) is a technique used in human decision making which has been very popular and widely accepted at the international level. This theory was developed by Thomas L. Saaty in the 1970s [1], based on the knowledge of mathematics and psychology for helping make decisions by finding the most suitable answer and helping decision makers understand their own problems better. [2] The principle divides the problem structure into layers. The first step is to set the goal and then, criteria, sub-criteria, and alternatives respectively. Then, the analysis will be conducted for the best choice by making comparisons. Pairwise selection criteria makes it easier to decide which criteria is more important by rating according to importance or preference after giving the score prioritize the criteria. Then the analysis step to consider the alternatives one by one according to the specified criteria is conducted until all criteria are met. If the consistency rating is reasonable, the sequences can be chosen to find the best alternative. However, the AHP theory can only make decisions that are not complicated. [3] Saaty invented the Analytic Network Process theory (ANP) by making further improvements from AHP so that decisions can be made to solve complex problems. The feature of complex problems is that various decisions must come from many decisions [4-5] which have influence on each other. The system has a feedback process, time delay and Non-Linearity by ANP theory with the steps as follows.
- Determine the structure of the problem or create a network
- Match the comparison of vector priority matrix
- Calculate the priority of the Super matrix model and
- Choose the best option.
From the process above, it can be seen that creating a network is the first step and it is the most important component in solving the problem. [6-8]. ANP also has disadvantages in terms of network construction which is not clear because when starting an incorrect network, it will affect the decision in choosing the best alternative.
2. Methodology
The construction of this research is to create a model for solving complex multi criteria decision process by applying the relationship of group theory by using the Design Structure Matrix (DSM) matrix together with the Analytic Network Process (ANP) to select the best alternative. It can be divided into 2 main parts.
2.1. Creating a network
Networking from the determination of the relationship of information in the matrix format with DSM [9]. From Figure 1, the Relation Analysis by Matrix Representation is the result of creating a network by Partitioning Reachability Matrix.
It is a square matrix representing a total system correlation analysis with arrowhead directions to recheck the weight matrix of each criterion to be completely correct. If the arrow shows one incorrect correlation, it immediately affects the ranking of alternatives. The Partitioning Reachability Matrix is divided into three steps with the following details.
- Information used in research studies which is obtained from data collection from actual operations or interviewing experts in each field of research with the information to be researched which should have enough amount covering the content that needs to be analyzed. If there is a lot of information and diverse [10]. The researcher should group similar data to be in the same group to reduce the amount of information and to be more convenient for analysis.
- Co-relation is a method for analyzing the relationships of data with the Design Structure Matrix (DSM) theory which can be divided into steps as follows [11-13]
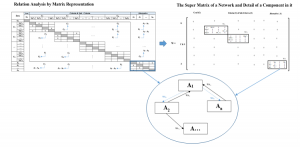
Figure 1: Key elements of the research
- Collect data from actual operations or interviewing an expert to gather information for using in defining relationships in the relationship matrix.
- Create a square matrix that is the same size as the data group to be analyzed (n x n). For example, there are 6 data items, so the generated matrix will be equal to 6 x 6
- Set the list of data to be analyzed in each row and the columns of the complete generated matrix.
- Define relationships between individual data. If there is a relationship, enter x, there is no relationship and leave it blank. However, the definition of the relationship can be divided into 2 parts which are
- Diagonal relations mean that the data that is arranged in a row must consider vertical data such as data D and AB and C.
- The part of the relationship, is the diagonal means that the data, is ordered in a column (Column) is a conditional condition for the data that is ordered in a horizontal row (Row), for example, the H data is the conditional data F, as shown in Table 1.
Table 1: Examples of relationship determination
| A | B | C | D | E | F | G | H | ||
| 1 | 2 | 3 | 4 | 5 | 6 | 7 | 8 | ||
| A | 1 | 1 | |||||||
| B | 2 | x | 2 | ||||||
| C | 3 | x | 3 | ||||||
| D | 4 | x | x | x | 4 | ||||
| E | 5 | x | x | x | 5 | ||||
| F | 6 | x | x | x | 6 | x | |||
| G | 7 | x | x | 7 | |||||
| H | 8 | x | 8 |
Networking
This step is the implementation of the correlation matrix of all data to find the right working sequences using Design Matrix (DSM) Theory by Reachability Matrix Partitioning which has the following steps [14].
- Create a set of data in column j that determines the conditions for data in row i of each data by specifying that the set is equal to Set R (s) (Reachability set).
- Create a set of data in row i that needs to consider the data in column j by specifying that the set is equal to Set A (s) (Antecedent set).
- Determine the data that Set R (s) is a subset of Set A (s) and delete such items from Set R (s) and Set A (s) of all data items. Then, the said data group list was used to create the partition matrix by ordering the groups of data created in the partition matrix, the list of qualified data groups, and precedence. Set R (s) is a subset of Set A (s) which can be shown in Figure 2 and 3.

Figure 2: An example of data group based on the criteria “Set R (s) ∩ Set A (s)”
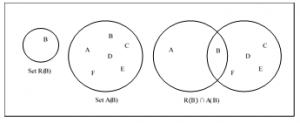
Figure 3: An example of the consideration of group B that does not qualify for “Set R (s) ∩ Set A (s)”
- Record data items one by one in the partition matrix. Adding data and relationship to the partition matrix of each item can be done by firstly, adding A to the partition matrix. Since the list contains Set R (A) as a subset of Set A (A), all Set A data can be deleted from Set R (s) and Set A (s). As a consequence, after deleting A data, Set R(s) becomes a sub-set of Set A (B). Subsequently, B data will be added into partition matrix and they will be deleted from Set R (s) and Set A (s).
- Convert Partition Matrix to Network. Taking the arranged partition data in the form of network that is ready to use in accordance with the standard of ANP.
2.2. Analysis for choosing the best Alternative
The final step is that the network that has already arranged in partition will be processed in Analytic Network Process (ANP). [15]. The researcher used Super Decision 3.2.0 to analyze data for selecting the best alternative.
3. Case Study
The case study of the Office of Transport and Traffic Policy and Planning (OTP), Ministry of Transport, Thailand shows that there is a need for developing “the dry port development plan for becoming the regional logistics center” in accordance with the cabinet resolution. Therefore, the researcher must study and review the relevant information about the dry port, [16, 17] which covers all levels including logistic behavior and the increasing quantity of products in the future. This will be used as supplementary information for setting strategic positioning and dry port development goal to support the demand and the development of the industrial products of the country in order to meet the economic development policy, trade and transportation in the country, and within the sub-region. This can increase the competitiveness of the country. In addition, the port also helps stimulate the transportation between transportation branches. In this study, data collection and review consist of 5 parts which are:
- Study and review of the policies of the international agreement and related laws.
- Review of operating results infrastructure development project, transportation, and logistics related to dry port.
- The study of data collection, concepts, experience, development, methods of model development design and management standard for dry port area.
- Study of logistic behavior and quantity of goods moving between the point of origin / destination of transportation and the main trading gates of the country.
- Summary of directions, policies, plans, and case studies from abroad for the purpose of determining the area suitable for the development of a dry port with the criteria for consideration and selection of areas that are suitable for the development of a dry port as follows: 1. System connection transporting with the rail system and other transportation systems, 2. urban planning and area development, 3. environmental suitability, 4. size and shape of the plot of land, and 5. cost of land procurement and development. The results of the consideration and selection of an area is suitable for the development of the dry port which is used to prioritize and analyze the feasibility of the 5 appropriate areas of the dry port as follows: 1. Khao Thong, Phayuha Khiri, Nakhon Sawan, 2. Muang Wan, Nam Phong, Khon Kaen, 3. Kut Chik, Sung Noen, Nakhon Ratchasima, 4. Don Sai and Nong Tee, Ban Pho, Chachoengsao, and 5. Wiang, Chiang Khong, Chiang Rai.
From the above information, the researcher grouped the data and analyzed to determine the suitable area for the development of the dry port of the Office of Transport and Traffic Policy and Planning (OTP) by applying the theory of grouping relations using Design Structure Matrix (DSM) matrix with the Analytic Network Process (ANP). The analysis was conducted by specifying the correlations of each criteria in the matrix and prioritized to create a network for further analysis with the theory of ANP to get accurate results in choosing the best option by starting with the steps according to the mentioned methodology.
- Collecting data from actual operations and interviewing experts from dry ports, which can be summarized into various groups as follows in Table 2.
- Co-relation is a method for analyzing data relationships by creating a square matrix which is the same size as the data group to be analyzed in this research, which are 11 data. Therefore, the created matrix is equal to 11 x 11 as shown in Table 3.
- Networking: This step is to use the data relationship matrix analyzed to find the proper working sequences using Design Matrix (DSM) Theory by Reachability Matrix Partitioning Method which has the following steps.
Table 2: Grouping and details
| Scenario | S1 | Determine the area suitable for land port development |
| Criteria | C1 | System connection transporting with the rail system and other transportation systems |
| C2 | Urban planning and area development | |
| C3 | Environmental suitability | |
| C4 | Size and shape of the plot of land | |
| C5 | Cost of land procurement and development | |
| Alternative | A1 | Nakhon Ratchasima |
| A2 | Nakhon Sawan | |
| A3 | Chachoengsao | |
| A4 | Chiang Rai | |
| A5 | Khon Kaen |
- Define Set R (s) (Reachability set) and collect Set R (s) members of each data item as shown in Table 4.
- Define Set A (s) (Antecedent set) and collect Set A (s) members of each data item as shown in Table 5.
- Determine the data that Set R (s) is a subset of Set A (s) and delete those items from Set R (s) and Set A (s). At the same time, the said data group list is used to create the partition matrix by ordering the groups of data created in the partition matrix, the list of qualified data groups, and precedence. Considering that Set R (s) is a subset of Set A (s) can be shown in Table
Table 3: The analyzed relationship matrix
| Group | Scenario | Criteria | Alternative | ||||||||||
| No. | 1 | 2 | 3 | 4 | 5 | 6 | 7 | 8 | 9 | 10 | 11 | ||
| Group | No. | Data | S1 | C1 | C2 | C3 | C4 | C5 | A1 | A2 | A3 | A4 | A5 |
| Scenario | 1 | S1 | 1 | x | x | x | x | x | x | x | x | x | x |
| Criteria | 2 | C1 | x | 2 | x | x | |||||||
| 3 | C2 | x | x | 3 | x | x | x | ||||||
| 4 | C3 | x | x | x | 4 | x | |||||||
| 5 | C4 | x | x | 5 | x | ||||||||
| 6 | C5 | x | x | x | 6 | ||||||||
| Alternative | 7 | A1 | x | 7 | x | ||||||||
| 8 | A2 | x | 8 | ||||||||||
| 9 | A3 | x | 9 | ||||||||||
| 10 | A4 | x | 10 | ||||||||||
| 11 | A5 | x | x | 11 | |||||||||
Table 4: Total relationship of Set R(s) members
| Group | Data | No. | Set name | Reachability Set |
| Set R(s) | ||||
| Scenario | S1 | 1 | set R(1) | {1,2,3,4,5,6,7,8,9,10,11} |
| Criteria | C1 | 2 | set R(2) | {1,2,3,6} |
| C2 | 3 | set R(3) | {1,2,3,4,5,6} | |
| C3 | 4 | set R(4) | {1,2,3,4,5} | |
| C4 | 5 | set R(5) | {1,4,5,6} | |
| C5 | 6 | set R(6) | {1,3,5,6} | |
| Alternative | A1 | 7 | set R(7) | {1,7,11} |
| A2 | 8 | set R(8) | {1,8} | |
| A3 | 9 | set R(9) | {1,9} | |
| A4 | 10 | set R(10) | {1,10} | |
| A5 | 11 | set R(11) | {1,11} |
Table 5: Set A(s) members
| Group | Data | No. | Set name |
Antecedent Set Set A(s) |
| Scenario | S1 | 1 | set A(1) | {1,2,3,4,5,6,7,8,9,10,11} |
| Criteria | C1 | 2 | set A(2) | {1,2,3,4} |
| C2 | 3 | set A(3) | {1,2,3,4,6} | |
| C3 | 4 | set A(4) | {1,3,4,5} | |
| C4 | 5 | set A(5) | {1,3,4,5,6} | |
| C5 | 6 | set A(6) | {1,2,3,5,6} | |
| Alternative | A1 | 7 | set A(7) | {1,7,11} |
| A2 | 8 | set A(8) | {1,8} | |
| A3 | 9 | set A(9) | {1,9} | |
| A4 | 10 | set A(10) | {1,10} | |
| A5 | 11 | set A(11) | {1,7,11} |
Table 6: Set R(s) is a subset of Set A(s)
| Group | Data | No. |
Reachability Set R(s) |
Antecedent Set A(s) |
Product Set R(s) ∩ Set A(s) |
| Scenario | S1 | 1 | {1,2,3,4,5,6,7,8,9,10,11} | {1,2,3,4,5,6,7,8,9,10,11} | {1,2,3,4,5,6,7,8,9,10,11} |
| Criteria | C1 | 2 | {1,2,3,6} | {1,2,3,4} | {1,2,3} |
| C2 | 3 | {1,2,3,4,5,6} | {1,2,3,4,6} | {1,2,3,4,6} | |
| C3 | 4 | {1,2,3,4,5} | {1,3,4,5} | {1,3,4,5} | |
| C4 | 5 | {1,4,5,6} | {1,3,4,5,6} | {1,4,5,6} | |
| C5 | 6 | {1,3,5,6} | {1,2,3,5,6} | {1,3,5,6} | |
| Alternative | A1 | 7 | {1,7,11} | {1,7,11} | {1,7,11} |
| A2 | 8 | {1,8} | {1,8} | {1,8} | |
| A3 | 9 | {1,9} | {1,9} | {1,9} | |
| A4 | 10 | {1,10} | {1,10} | {1,10} | |
| A5 | 11 | {1,11} | {1,7,11} | {1,7,11} |
3.1. Recording data items in the partition matrix
Delete the items of Set R(s) and Set A(s) and store them in partition matrix until finished. Then, put the data in partition matrix orderly as shown in Table 7 to Table 11.
Table 7: Partition arrangement No. 1 after deleting number 1
| Group | Data | No. |
Reachability Set R(s) |
Antecedent Set A(s) |
Product Set R(s) ∩ Set A(s) |
| Criteria | C1 | 2 | {2,3,6} | {2,3,4} | {2,3} |
| C2 | 3 | {2,3,4,5,6} | {2,3,4,6} | {2,3,4,6} | |
| C3 | 4 | {2,3,4,5} | {3,4,} | {3,4,5} | |
| C4 | 5 | {4,5,6} | {3,4,5,6} | {4,5,6} | |
| C5 | 6 | {3,5,6} | {2,3,5,6} | {3,5,6} | |
| Alternative | A1 | 7 | {7,11} | {7,11} | {7,11} |
| A2 | 8 | {8} | {8} | {8} | |
| A3 | 9 | {9} | {9} | {9} | |
| A4 | 10 | {10} | {10} | {10} | |
| A5 | 11 | {11} | {7,11} | {7,11} |
Table 8: Partition Arrangement No. 2 after deleting numbers 8, 9, 10 and 11
| Group | Data | No. |
Reachability Set R(s) |
Antecedent Set A(s) |
Product Set R(s) ∩ Set A(s) |
| Criteria | C1 | 2 | {2,3,6} | {2,3,4} | {2,3} |
| C2 | 3 | {2,3,4,5,6} | {2,3,4,6} | {2,3,4,6} | |
| C3 | 4 | {2,3,4,5} | {3,4,} | {3,4,5} | |
| C4 | 5 | {4,5,6} | {3,4,5,6} | {4,5,6} | |
| C5 | 6 | {3,5,6} | {2,3,5,6} | {3,5,6} | |
| Alternative | A1 | 7 | {7,11} | {7,11} | {7,11} |
Table 9: Partition arrangement No. 3 after deleting number 7
| Group | Data | No. |
Reachability Set R(s) |
Antecedent Set A(s) |
Product Set R(s) ∩ Set A(s) |
| Criteria | C1 | 2 | {2,3,6} | {2,3,4} | {2,3} |
| C2 | 3 | {2,3,4,5,6} | {2,3,4,6} | {2,3,4,6} | |
| C3 | 4 | {2,3,4,5} | {3,4,} | {3,4,5} | |
| C4 | 5 | {4,5,6} | {3,4,5,6} | {4,5,6} | |
| C5 | 6 | {3,5,6} | {2,3,5,6} | {3,5,6} |
Table 10: Partition arrangement No. 4 after deleting numbers 2 and 3
| Group | Data | No. |
Reachability Set R(s) |
Antecedent Set A(s) |
Product Set R(s) ∩ Set A(s) |
| Criteria | C3 | 4 | {4,5} | {4} | {4} |
| C4 | 5 | {4,5,6} | {4,5,6} | {4,5,6} | |
| C5 | 6 | {5,6} | {5,6} | {5,6} |
Table 11: Partition Arrangement no. 5 after deleting numbers 4 and 5
| Group | Data | No. |
Reachability Set R(s) |
Antecedent Set A(s) |
Product Set R(s) ∩ Set A(s) |
| Criteria | C5 | 6 | {6} | {6} | {6} |
3.2. Convert partition matrix into network
Convert the data after partition arrangement into the form of network that is ready to use in accordance with the standards of ANP.
Table 12: The matrix with new relationship order arrangement
| No. | 1 | 8 | 9 | 10 | 11 | 7 | 2 | 3 | 4 | 5 | 6 | |
| No. | Data | S1 | A2 | A3 | A4 | A5 | A1 | C1 | C2 | C3 | C4 | C5 |
| 1 | S1 | x | x | x | x | x | x | x | x | x | x | |
| 8 | A2 | x | ||||||||||
| 9 | A3 | x | ||||||||||
| 10 | A4 | x | ||||||||||
| 11 | A5 | x | ||||||||||
| 7 | A1 | x | ||||||||||
| 2 | C1 | x | x | x | ||||||||
| 3 | C2 | x | x | x | x | |||||||
| 4 | C3 | x | x | x | ||||||||
| 5 | C4 | x | x | x | x | |||||||
| 6 | C5 | x | x | x | x |
4. Result
Table 12 shows the matrix after converting into a network by analyzing the relationship of the criteria. The value x in the table shows the relationship with each other. All collected relationships are shown in Figure 4 and 5 for further use in the ANP.

Figure 4: The hierarchical structure of ANP feedback system

Figure 5: Internal relations of alternative
From the created network above, the researcher continued to analyze with ANP theory by using Super Decision version 3.2.0 as a tool to assist in the analysis to find the best option in determining the suitable area for the development of dry ports, i.e. C1. the connection of the transportation system with the rail system and other transportation systems, C2. the city planning and area development, C3. the suitability of the environment, C4. the size and the shape of land plots, and C5. the costs of land and development. There are 5 options to consider, which are A1. Nakhon Ratchasima, A2. Nakhon Sawan, A3. Chachoengsao, A4. Chiang Rai, and A5. Khon Kaen. Through the analyzing, the results can tell which province is the most appropriate area for dry port development.
From the Figure 6, it can be seen that the network consists of 5 criteria which are C1. the connection of the transportation system with the rail system and other transportation systems, C2. the city planning and area development, C3. the suitability of the environment, C4. the size and the shape of land plots, and C5. the costs of land and development.
A score is computed by multiplying the weight with the level of criteria relationship and the alternative intensity as shown in Table 13. The alternative rankings are shown in Table 14.

Figure 6: Network model from the ANP Super Decision Software
From the results of the analysis, it can be concluded that the most suitable area for dry port development is A1 Nakhon Ratchasima, followed by A5 Khon Kaen, A4 Chiang Rai, A3 Chachoengsao and A2 Nakhon Sawan respectively.
Table 13: Ranking of areas under each particular criterion
| Alternative | Criteria | Scenario | |||||||||
| A1 | A2 | A3 | A4 | A5 | C1 | C2 | C3 | C4 | C5 | S1 | |
| A1 | 0.00000 | 0.00000 | 0.00000 | 0.00000 | 1.00000 | 0.56524 | 0.32050 | 0.40007 | 0.28124 | 0.27972 | 0.49977 |
| A2 | 0.00000 | 0.00000 | 0.00000 | 0.00000 | 0.00000 | 0.07340 | 0.08180 | 0.05420 | 0.56250 | 0.05578 | 0.06564 |
| A3 | 0.00000 | 1.00000 | 0.00000 | 0.00000 | 0.00000 | 0.16736 | 0.23141 | 0.32736 | 0.38827 | 0.44020 | 0.24350 |
| A4 | 0.00000 | 0.00000 | 1.00000 | 0.00000 | 0.00000 | 0.02854 | 0.04579 | 0.04822 | 0.05407 | 0.05418 | 0.03586 |
| A5 | 0.00000 | 0.00000 | 0.00000 | 1.00000 | 0.00000 | 0.16546 | 0.32050 | 0.17014 | 0.22018 | 0.17012 | 0.15523 |
| C1 | 0.00000 | 0.00000 | 0.00000 | 0.00000 | 0.00000 | 0.00000 | 0.00000 | 0.00000 | 0.00000 | 0.00000 | 0.11920 |
| C2 | 0.00000 | 0.00000 | 0.00000 | 0.00000 | 0.00000 | 1.00000 | 0.00000 | 0.00000 | 0.00000 | 0.00000 | 0.27706 |
| C3 | 0.00000 | 0.00000 | 0.00000 | 0.00000 | 0.00000 | 0.00000 | 1.00000 | 0.00000 | 0.00000 | 0.00000 | 0.40040 |
| C4 | 0.00000 | 0.00000 | 0.00000 | 0.00000 | 0.00000 | 0.00000 | 0.00000 | 0.00000 | 0.00000 | 0.00000 | 0.06849 |
| C5 | 0.00000 | 0.00000 | 0.00000 | 0.00000 | 0.00000 | 0.00000 | 0.00000 | 0.00000 | 0.00000 | 0.00000 | 0.13484 |
| S1 | 0.00000 | 0.00000 | 0.00000 | 0.00000 | 0.00000 | 0.00000 | 0.00000 | 0.00000 | 0.00000 | 0.00000 | 0.00000 |
Table 14: Ranking of alternatives
| Alternatives | Total | Normal | Ideal | Ranking |
| A1 Nakhonratchasrima Province | 0.3308 | 0.4229 | 1.0000 | 1 |
| A2 Nakhonsawan Province | 0.0205 | 0.0263 | 0.0621 | 5 |
| A3 Chachoengsao Province | 0.1152 | 0.1473 | 0.3484 | 4 |
| A4 Chiangrai Province | 0.1292 | 0.1651 | 0.3905 | 3 |
| A5 Khonkaen Province | 0.1865 | 0.2384 | 0.5637 | 2 |
5. Conclusion
This case study to find the most suitable area for dry port development in Thailand employed the simulation of Analytic Network Process (ANP) together with Design Structure Matrix (DSM) of Reachability Matrix using Partition Matrix. It can be concluded that the most appropriate area for the development of dry port in Thailand is Nakhon Ratchasima Province. The network model has been established from rearranging the relationship and considering the relationship related to the network and then used to create a hierarchical network. The applying of Design Structure Matrix with Analytic Network Process results in clearer network sources which shows interaction relationship of the whole system. The result is very effective in finding the best alternative better than using only the Analytic Network Process. However, if there are more criteria used for decision-making, we can use a clustering method for networking with DSM apart from the Partitioning Reachability method, which can be a further study. It is hoped that the applied method above will be useful for those interested in studying the source of the network before analyzing with ANP. For those who are interested in analyzing the correlation of individual criteria in the system will find it useful to increase the efficiency of ANP analysis as well.
- T. L. Saaty, Theory and Applications of the Analytic Network Process: Decision Making with Benefits, Opportunities, Costs, and Risks, 3rd RWS Publications, 2005.
- H. Qudrat-Ullah, J.M. Spector, P.I. Davidson, Complex Decision Making Theory and Practice, Springer New England Complex Systems Institute Book Series, 2008.
- K. Z. Edmundas, et al., “Hybrid multiple criteria decision-making methods: a review of applications for sustainability issues” Economic Research-Ekonomska Istraživanja.; 29(1), 857-887, 2016.
- T. L. Saaty, “Decision making with the analytic hierarchy process” Int. J. Services Sciences,; 1(1), 83-98, 2008.
- S. Apiradee, “Multi-criteria decision making: Comparison between SAW, AHP and TOPSIS concept and methods” Princess of Naradhiwas University Journal.; 8(2), 180-192, 2016.
- K. Kaku, T. Honma. & M. Fukuda., “An Application of AHP/ANP to A Wildfire Management Project to Help Mitigate Global Warming” in 2009 Proceeding of the International Symposium on the Analytic Hierarchy Process, 2009.
- G. Kou, D. Ergu, Y. Peng, Y. Shi, Data Processing for the AHP/ANP, Springer-Verlag Berlin Heidelberg, 2013.
- B. D. Rouyendegh, G. F. Canb, “Selection of working area for industrial engineering students” in 2012 Procedia – Social and Behavioral Sciences 31, 15 – 19, 2012.
- T. R. Browning, “Use of Dependency Structure Matrices for Product Development Cycle Time Reduction” in 1998 Proceedings of the Fifth ISPE International Conference on Concurrent Engineering:Research and Applications, Tokyo, Japan, July 15-17, 1998.
- T. R. Browning, “Applying the design structure matrix to system decomposition and integration problems: a review and new directions” IEEE Transactions on Engineering Management, 48(3), 292 – 306, 2001. https://doi.org/10.1109/17.946528
- J. Nattawut, “The Development of Matrix based Scheduling for Customized Product Development Project” Princess of Naradhiwas University Journal.; 5(3), 47-65, 2013.
- J. Nattawut, “A Methodology to Reducing Process Complexity Using Integration Definition for Function Modeling and Dependency Structure Matrix” Princess of Naradhiwas University Journal.; 7(2), 48 – 61, 2015.
- D. V. Steward, “The design structure system: A method for Managing the design of complex systems” IEEE Transactions on Engineering Management, 28(3), 71 – 74, 1981. https://doi.org/10.1109/TEM.1981.6448589
- A. A. Yassine, “An Introduction to Modelling and Analyzing Complex Product Development Processes the Design Structure Matrix (DSM) Method” Quad. di Manag. (Italian Manag. Rev.) 9, 1 – 17, 2004.
- C. Thanaphon, I. Mongkon, “Selection of airport logistics park location in Thailand” Kasem Bundit Engineering Journal 9(3), 45-60, 2019.
- F. Saruchera, “Determinants of effective high-risk cargo logistics at sea ports: A case study” in Open Access Journal of Transport and Supply Chain Management, 1-13, 2020. https://doi.org/10.4102/jtscm.v14i0.488
- S. Jenjira, K.Ramil, J. Nattawut, “A Methodology of Network Modeling of Risk Prioritization in Hazardous Product Transportation” IEEE International Conference on Industrial Engineering and Engineering Management, art. no. 8978702, 955-959, 2019. https://doi.org/10.1109/IEEM44572.2019.8978702