Ontology-based Data Management Tool for Studying Radon Concentration

Adv. Sci. Technol. Eng. Syst. J. 5(6), 577–583 (2020);
 DOI: 10.25046/aj050670
Interpreting data for solving information needs demands an understanding of the semantics of row data. In this paper, an ontology-driven management of data of the presence of radon gas in soil is presented. The main contribution of this research relies on the formal definition of the semantic of the presence of radon in the dimensions of space and time. As a result, a dynamic data view generator for the observation of radon measurements was deployed without actual software programming but with the proper adjustment and instantiation of the ontology ViewOnto, a web ontology which was created for the formal description of data views. An experimental assessment of the proposal was carried out with data obtained from stone aggregate mines and civil constructions in Tungurahua. The usability of the resulting data management system was successfully validated with the criteria of experts on usability and researchers with experience in radon measurement.
1. Introduction
According to United States Environment Protection Agency estimates, radon is the number one cause of lung cancer among nonsmokers and the second one overall [1]. Recent studies in the detection of radon have been focused on the definition of alternative methods for detecting radon presence in soil and air [2, 3], making the radon detection cheaper and accessible.
The study of collected radon data is important not only for warning about the humans’ health risks because of its inhalation [4, 5] but for the prediction of earthquakes [6] and spontaneous combustion scenarios in coal mines [7]. In these quite different scenarios, time and space are recognised as fundamental dimensions of collected data in order to depict an actual throbbing picture of the presence and potential impact of radon [4]–[8].
Meanwhile, other variables like meteorological parameters and soil characteristics are intrinsically related because of their influence in radon concentration [3, 5, 7, 9]. This kind of studies is characterised by a challenging task: to derive meaningful insights from collected data [6, 7].
In the literature review that was carried out, it was not possible to find a common data model for characterising the presence of radon. On the contrary, depending on the research, different variables and even different measure units characterise each research. This lack of data normalization makes harder to work with retrieved data from the field. Requiring such a flexibility level on data management tools, it is important to note that developing adaptive collective structures of knowledge by ontology-based techniques has been successfully applied to different research areas [10]–[12].
This paper presents an ontology-based dynamic tool for the observation of radon measurements. The decision for an ontologybased solution is twofold. Firstly, a flexible solution is designed, adaptable to different objectives of research and changing mechanisms of measurement as the research goes on. Secondly, the tool does not need changes on code in order to adapt to changes on data to collect and data views required by researchers for analysing data in the space and time dimensions. Other important issues as user authentication and data access protection are out of the scope.
The proposed solution is based on ViewOnto, a web ontology which was defined for the formal description of the semantics of data views in different scenarios [10, 11]. Many domain ontologies have been created until now [11, 14, 17] but ViewOnto is the only one with this purpose of those available in the consulted literature. In this work, this ontology is taken into the dimensions of space and time. Its usability was validated by a usability test of the data views generated on the use case of the study of the presence of radon in mines and civil constructions in Ecuadorian highlands.
This paper is structured as follows. Section 2 depicts related works. ViewOnto is described in section 3 and the general architecture of the ontology-based data management tool for studying radon concentration is presented. Section 4 presents the results of the experimental evaluation of the tool in the scenario of the measurement of radon diffusion rate of building materials in stone aggregate mines and civil constructions in Tungurahua, in the Ecuadorian highlands. Finally, in section 5 conclusions and future work are discussed.
2. Related works
Tareen et al. proposed a method for predicting earthquakes based on the automatic detection of anomalous behaviour in radon time series data [6]. As result of their research, anomalous behaviour seen in radon time series data has been determined as an indicator of seismic activity [6].
Meanwhile, surface-based radon detection is a technique used for spontaneous combustion prediction in coal mines by studying the radon migration mechanism of overlying strata [7]. These studies show the importance of tools for supporting the understanding of data series of radon measures.
Other studies determine the acceptance of the influence of meteorological variables in radon concentrations [3, 7]. This actually leads to the estimation of soil radon gas with meteorological parameters, determining the necessity of taking into account meteorological parameters when making an analysis of radon influence on human life.
The results of the research of Verdonck et al. show that ontologydriven conceptual modeling has advantages for achieving higher quality models when compared to traditional conceptual modeling. Likewise, they concluded that it is advantageous to apply an ontology-driven concept modeling technique when having to model the more challenging and advanced facets of a certain domain or scenario [14].
Formalising the semantic of data is fundamental for its automatic processing [15]. Semantic aspects of data determines logic rules of knowledge base systems [12, 13, 15] whilst web ontologies are accepted as formal mechanisms for structuring data conceptualizations [13].
In another study, Verdonck et al. have studied the pragmatic quality of ontology-driven models and they have concluded that the notion of time is easier to comprehend in ontology-driven models where an individual endures through time and is regarded totally present at any moment in its lifetime. The same was confirmed when analysing how easy to understand was the formation of semantic relationships [13]. Meanwhile, Baumgartner et al. highlighted that making timely identification, resolution, and prevention of critical situations is fundamental for having a semantically richer knowledge model [15].
Wagih et al. focused on defining the semantic aspects of user’s mobility for location recommendation systems by defining Ridology, an ontology model for exploring human behaviour trajectories in ridesharing applications [12]. Meanwhile, Sorokine et al. proposed the use of ontologies in the generation of scenarios for the purpose of testing the algorithms used to detect nuclear materials [16].
Another study proposing an ontology-driven representation of knowledge is the research carried out by Mantovani et al. for managing geological maps [17]. In their approach, a domain ontology in the context of geological knowledge named OntoGeonous was used in order to constrain the behaviour of a dynamic data entry tool to refer to the terminology conveyed by the taxonomic-axiomatic nature of the ontology [17]. None of related work analyzed during this research take into account the semantics of data in the space and time dimensions. Nevertheless, all these research results support the idea of choosing an ontology-driven concept model technique for carrying out the analysis of the impact of radon in human life both, on the space and time dimensions.
3. Description of the ontology-based data management tool
The software architecture of this solution is structured in three layers. Fig. 1 illustrates a general view of the interaction among layers of the proposed solution and with the user. The data entry and data views generators automatically generate a user interface by using the semantics of the instance of the ViewOnto ontology for radon observation.
Changes in the instance of the ontology automatically generate changes in the user interface. The user interacts with the data entry interface for inserting, updating and deleting data stored in the the structured database whilst he interacts with the data views generator for interpreting and learning from annotated data.
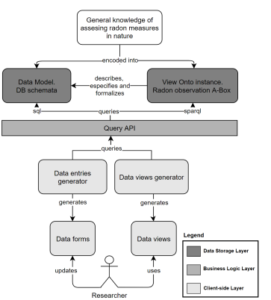
Figure 1: General view of the proposed solution.
The most important outcome with this implementation is that there is no need of updating the encoding of the application for changing the behaviour of the application. Those changes are automatically generated in user interfaces by changing the instance of ViewOnto that describes the semantics of data stored in the relational database. Below, the three layers of the architecture are described.
3.1. Semantics of the measurement of the presence of radon
The semantics of the database design in relational database models define the ultimate restrictions of datatype for each data item, unique index restrictions and the kind of relationships existing among data entities. Fig. 2 shows the relationships among the main data entities defined in the use case of this research for measuring radon’s presence in the highlands of Ecuador. Other entities, like the User entity for specifying which users that have access to these data, were ignored in the diagram for improved clarity of the concept.
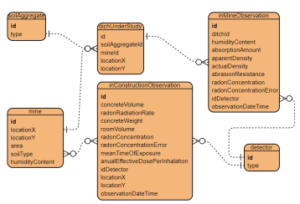
Figure 2: Main entities in use case’s database design.
For this use case, in-mine and in-constructions observations were recorded. Different detector mechanisms were used and different soil aggregates were analysed. Both, time and space dimensions of data are fundamental for the study since it is required to be able to analyze the evolution of radon presence on observations. In this scenario, the semantic restrictions of the designed database were not enough but considered as a baseline guarantee for the integrity of managed data. Defining further semantic restrictions was necessary for building a data entry and report generator tool which adapts to changes in the semantics of data. Otherwise, the automatic generation of proper interfaces for end-users would be intractable.
For this purpose, modeling the semantics of data within a custom instantiation of the ontology ViewOnto was considered. Figure 3 shows the conceptual model of ViewOnto for formalising a database schemata.
Next, the main semantic definitions reused and extended from [10] in the instantiation are formally encoded using the description logic of the OWL language. For deeper insights about ViewOnto, the extended definition of the T-Box of ViewOnto and the specific ABox of ViewOnto for radon observation are available int the online repository that accompanies this paper at Open Science Framework[1].
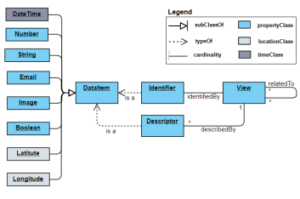
Figure 3: Conceptual model of ViewOnto.
![]()
View V, Descriptor D, Identifier I, DataItem S, Relationship R and Filter F are the basic classes in the terminology of ViewOnto. Those classes are disjoint sets and this terminology corresponds to the original definition of ViewOnto by Fernandez et al. [10].´
![]()
Semantic datatypes are represented by the classes DateTime
S dt, Number S n, String S s, Email S e, Image S i, Boolean S b, Latitude S la and Longitude S lo. All these data items are subclasses of DataItem S. Those data items in bold were added to the original definition of ViewOnto in order to take into account the space and time dimensions of data. The appropriate DataItem is decidable by the corresponding datatype for each data item in the database.
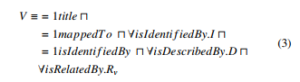
A View V is defined as the class with one, and only one, title, mappedTo and isIdentifiedBy properties. The property title is used for generating labels and menu options in the automatically generated data entry forms and report views. Meanwhile, the property mappedTo is used to link the View with the corresponding dataset in the database. V is identified by an Identifier I. Further, V may be related (or not) with one or more Descriptors D and Relationships between Views Rv by instantiating the isDescribedBy and isRelatedBy properties, respectively.
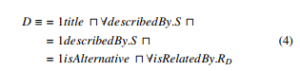
A Descriptor is defined as the concept D, which instantiates once, and only once, the roles title, describedBy and isAlternative. The properties describedBy and isRelatedBy only take value in the range of S and RD instances, respectively. These restrictions are mandatory for a Descriptor. Figure 4 shows the connections among DataItems and Descriptors in the spatial dimension of the use case. This diagram was generated with the OntoGraf plugin for Proteg´ e´ using the instance of ViewOnto that was built for studying radon concentration.
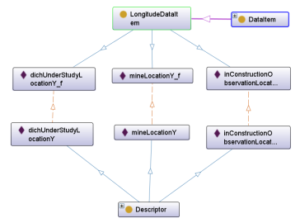
Figure 4: Graphical representation of Descriptors and Dataitems in the space dimension of the use case.
3.2. Implementation of the business logic layer
The business logic layer is exposed as a REST-API. A json encoder/decoder was integrated for making possible the communication with the client-side layer of the data management tool. Inside, the design of the business logic layer was threefold. One component was built for querying and updating the database whilst another component allowed to query the ViewOnto A-Box of the use case. Finally, an inference component that uses the Jena inference engine was implemented. This component inferences semantic rules based on the OWL encoding of ViewOnto. As Jena is an inference engine implemented in Java, all features of the business logic were exposed as web services in a TomCat Server. Figure 5 shows the structure of the proposed business logic layer.
Four main API-REST methods were proposed that conform to the management of the data of a data view. With different parameters, these methods allow to retrieve and to trigger CRUD actions over the data of a data view. Other eight API-REST methods allow to retrieve the list of available data views and data of inter-related data views, their descriptors and identifiers. Table 1 shows the structure of possible requests to the API-REST.
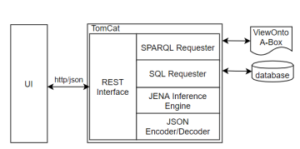
Figure 5: Graphical representation of the business logic layer.
Table 1: Examples of requests to the API-REST
| Method | Path | Action |
| POST | /api/view
/inMineObservation |
records an observation. |
| POST | /api/view
/inMineObservation/1 |
updates an observation. |
| GET | /api/view
/inMineObservation |
retrieves data of observations. |
| DELETE | /api/view
/inMineObservation/1 |
deletes record 1 from observations. |
With this implementation of the business logic layer, it is possible to have more than one client-side layer implementation. Without changes in the code, just by changing the specification of the ViewOnto A-Box, the behaviour of the business logic may adapt to changing scenarios. Data retrieved by the business logic flow to the client-side layer in an efficient way.
3.3. Implementation of the client-side layer
The implementation of the client-side layer is twofold. A generator of data entry interfaces and a report generator were implemented. An automatically generated interface for data entry allows the user to register annotations of radon measurements. Meanwhile, the report generator allows the user to navigate through data views for analysing collected data. All these interfaces are generated on request, based on the information stored in the instance of ViewOnto.
Figure 6 shows a data entry interface generated from the semantics stored in the ViewOnto A-Box that was defined for supporting the study of radon concentration. The definition of descriptors of longitude and latitude (mineLocationX and mineLocationY, as appear in figure 4), determines the rendering of a map component for choosing a location. The implementation of this map component allows to mark a point, a set of points, and a path. These functionalities are activated or not, taking into account the information that the user will enter in the data entry form. How to store data in the database is specify in the mappedTo data property of ViewOnto.
Meanwhile, other data entry controls (text fields and a combobox) are rendered for entering corresponding values. The rules for validating the values entered in each of these controls come from the instance of ViewOnto. The kind of control to render is chosen taking into account the DataItem that matches to each Identifier and Descriptor in the instance of ViewOnto. Other restrictions are defined in the instance of ViewOnto using specific data properties. This is the case of mandatory fields in the data form, minimum and maximum values of each numeric field and the set of valid values (if this is the case).
The instance of ViewOnto includes rules for validation and error messages, just in case the rules are violated. The contribution with this work is that the semantic definition of form fields, and how to deal with them, is not mixed up with HTML and JavaScript. Instead, they are defined using the declarative syntax of OWL as they are stored in a web ontology.
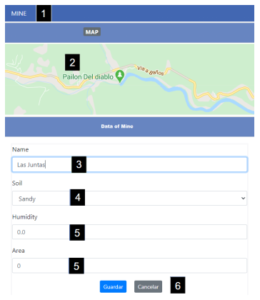
Figure 6: Sample of the prototype of data entry interface. (1) Title of the data view as defined in the instance of ViewOnto. (2) Interactive map component for the input of the location of new mine record. (3) Text fields for the input of the name of the mine. (4) Combobox field for the input of the type of soil of the mine. Valid values are specified in the instance of ViewOnto. (5) Text field for the input of humidity and area of the mine. Automatic validation of these fields restrict user input to numbers.
(6) Buttons for saving and cancelling user data entry.
On the other hand, figure 7 shows the interface of the prototype when rendering information about observed mines. Location of the mines are rendered over a map canvas and the descriptors of the data view are shown in a tabular view. Each data view does not match necessarily with a table in the database. The amount of data views depends on the interests of the user. A list of related views is shown in the upper right corner of the interface when the options button is tap. The user may filter data per descriptor and he can show/hide descriptors, as well. Navigating to most related data views is possible by tapping buttons on the left side of each data row. In this case, it would be navigating to the ditches under study on a specific mine.
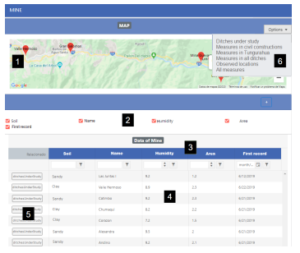
Figure 7: Sample of the prototype of report generator interface. (1) Interactive map component. (2) List of visible/hidden properties of the active data view. (3) Ordering criteria and filters applicable to each property. (4) Tabular data component. (5) Navigation access into related data views. (6) Links to other data views described in the instance of ViewOnto.
4. Analysis of Results
The experimental evaluation of the results show that it was possible to build a generator of data management tools. Whenever changes in the user interfaces would be needed, the code of the generator would not change. Only the instance of ViewOnto would be rewritten and, if necessary, the structure of the database would be modified. This way, the role of the programmer was changed. Instead of prescriptive programming, descriptive programming for coding the instance of the ontology and abilities on SPARQL and SQL are now on required for the maintenance of a generated data management tool.
This software was used for the deployment of a system for studying radon concentration. The user interfaces are automatically generated each time that the user requires to interact with the system. From the data model of figure 2, three data entities were managed in the space dimension, and two other data entities were managed in the time dimension. The navigation among data views was automatically generated taking into account the semantics of the relationships among data views.
The results were also assessed on an usability evaluation of the data management tool. Nielsen and Budiu suggest to have from 5 to 11 participants in a usability study [18]. Two experts in usability and three experts in the study of radon concentration participated in the assessment. All of the participants in this study have more that 15 years in the industry and 8 years of academic experience. In a first phase, the participants in the study were called for a virtual presentation on how to use the software. Then, all of the experts quantified the level of usability of the interfaces that the software would be able to generate. Their evaluation was made using Nielsen principles of usability [18].
Each expert determined if each usability principle was accomplished, not accomplished or not relevant. Their answers were anonymously collected. Then, feedback of the answers was given to the experts and a new qualitative analysis was carried out. A consensus on usability principles that were not relevant was found. A total of seven usability principles were considered as relevant for an ontology-based data management tool. Results were debated in a final public session of work and experts were asked to give a weight to each relevant usability principle. A Likert scale of 1-5 was used.
As a result of the study, it was found that experts agree that the interfaces generated with the software comply with high standards of usability. Table 2 shows a resume of relevant usability principles and the mean of the weight that experts gave to each of them.
Table 2: Results of the validating survey
| Criteria | Mean
value |
| I would use this tool | 5.0 |
| This tool seems easy to use | 4.6 |
| Using this tool, the understanding of data in the real world gets easier | 4.8 |
| This tool facilitates the control of the user over the data management process | 5.0 |
| This tool facilitates the user to freely manage data upon his needs | 4.6 |
| The options of this tool are clearly understandable | 4.8 |
| This tool is flexible and efficient for data management | 4.8 |
5. Conclusions
This paper presented the implementation of an ontology-based data management tool. The semantic restrictions of the designed database were not enough but considered as a baseline guarantee for the integrity of managed data. Defining further semantic restrictions was necessary for building a data entry and report generator tool which adapts to changes in the semantics of data.
This data management tool 1) adapts to changes in the understanding of data, 2) dynamically integrates data in different measure units and 3) interprets the semantics of data for deciding its appearance in the user interface.
The space dimension of data views is expressed by its location on a map. On the other hand, the time dimension of data views is expressed by describing its nature -beginning, enduring and lasting of events-.
Both querying languages, SQL and SPARQL were necessary for communicating with the database and the ontology, respectively. Mapping the semantics with actual data in the data storage was possible by using the mappedTo property of the ViewOnto ontology.
Results were experimentally validated in the management of radon observations in the Ecuadorian highlands and experts expressed their acceptance of the usability of the tool. Using this generator in other scenarios is theoretically possible but, as future work, further research is needed in order to assess the capabilities of ViewOnto for expressing the semantics of managed data in other scenarios.
Acknowledgment
This research was funded by the Research Project #PFICM019 ”Arquitectura de Servicios Web Semanticos´ para la Integracion de Fuentes de Datos Estructuradas de Proyectos´ Urban´ısticos” of Universidad Tecnica de Ambato.´
- US Environmental Protection Agency: Health Risk of Radon (2020), https://www.epa.gov/radon/health-risk-radon.
- S. Elisio, L. Peralva, “Development of a low-cost monitor for radon detection in air” Nucl. Instrum. Meth. A, 969, 164033, 2020. https://doi.org/10.1016/j.nima.2020.164033
- S. Li, H. Liu, G. Yang, S. Liu, R. Liu, Ch. Lv, “Detection of radon with biosen- sors based on the lead(II)-induced conformational change of aptamer HTG and malachite green fluorescence probe” J. Environ. Radioactiv., 195, 60-66, 2018. https://doi.org/10.1016/j.jenvrad.2018.09.021
- V. Jobba´gy, H. Stroh, G. Marissens, M. Hult, “Comprehensive study on the technical aspects of sampling, transporting and mea- suring radon-in-water” J. Environ. Radioactiv., 197, 30-38, 2019. https://doi.org/10.1016/j.jenvrad.2018.11.012
- P. S. Miklyaev, T. B. Petrova, A. M. Marennyy, D. V Shchitov, P. A. Sidyakin, M. A. Murzabekov, M. N. Lopatin, “High seasonal variations of the radon exhalation from soil surface in the fault zones (Baikal and North Caucasus regions)” J. Environ. Radioactiv., 219, 106271, 2020. https://doi.org/10.1016/j.jenvrad.2020.106271
- A. Tareen, K. Asim, K. Kearfott, M. Rafique, M. Nadeem, T. Iqbal, S. Rahman, “Automated anomalous behaviour detection in soil radon gas prior to earth- quakes using computational intelligence techniques” J. Environ. Radioactiv., 203, 48-54, 2019. https://doi.org/10.1016/j.jenvrad.2019.03.003
- B. Zhou, J. Wu, J. Wang, Y. Wu, “Surface-based radon detection to identify spontaneous combustion areas in small abandoned coal mine gobs: Case study of a small coal mine in China” Process Saf. Environ., 119, 223-232, 2018. https://doi.org/10.1016/j.psep.2018.08.011
- D. Huxtable, D. Read, G. Shaw, “Measuring radon-222 in soil gas with high spatial and temporal resolution” J. Environ. Radioactiv., 167, 36-42, 2017. https://doi.org/10.1016/j.jenvrad.2016.11.003
- H. Phong Thu, N. Van Thang, L. Cong Hao, “The effects of some soil character- istics on radon emanation and diffusion” J. Environ. Radioactiv., 216, 106189, 2020. https://doi.org/10.1016/j.jenvrad.2020.106189
- F. Ferna´ndez-Pen˜a, P. Urrutia-Urrutia, R. Can˜ete, R. Acosta-Sa´nchez, C. Yan˜ez- Ma´rquez, J. Nummenmaa, “A conceptual data model for the automatic gener- ation of data views” Applied Mathematics and Information Sciences, 10(4), 1331-1342, 2015. https://doi.org/10.18576/amis/100412
- A. Maigua-Quinteros, W. Perez-Nata, F. Fernandez-Pena, P. Urrutia- Urrutia, “Fostering Exploration of Georeferenced Data Semantics for Supporting E-government Initiatives” in 5th International Con- ference on eDemocracy and eGovernment, Ambato Ecuador, 2018. https://doi.org/10.1109/ICEDEG.2018.8372363
- H.M. Wagih, H.M.O. Mokhtar, “Ridology: An Ontology Model for Exploring Human Behavior Trajectories in Ridesharing Applications” Studies in Systems, Decision and Control, 295, 553-567, 2021. https://doi.org/10.1007/978-3-030- 47411-9 30
- M. Verdonck, F. Gailly, S. de Cesare, “Comprehending 3D and 4D ontology- driven conceptual models: An empirical study” Studies in Systems, Information Systems, 93, 101568, 2020. https://doi.org/10.1016/j.is.2020.101568
- M. Verdonck, F. Gailly, R. Pergl, G. Guizzardi, B. Martins, O. Pastor, “Comparing traditional conceptual modeling with ontology-driven concep- tual modeling: An empirical study” Information Systems, 81, 92-103, 2019. https://doi.org/10.1016/j.is.2018.11.009
- N. Baumgartner, W. Gottesheim, S. Mitsch, W. Retschitzegger, W. Schwinger, “BeAware!—Situation awareness, the ontology-driven way” Data Knowl. Eng., 69(11), 1181-1193, 2010. https://doi.org/10.1016/j.datak.2010.07.008
- A. Sorokine, B. G. Schlicher, R. C. Ward, M. C. Wright, K. L. Kruse, B. Bhaduri, A. Slepoy, “An interactive ontology-driven information system for simulating background radiation and generating scenarios for testing special nuclear materials detection algorithms” Eng. Appl. Artif. Intel., 43, 157-165, 2015. https://doi.org/10.1016/j.engappai.2015.04.010
- A. Mantovani, F. Piana, V. Lombardo, “Ontology-driven representation of knowledge for geological maps” Comput Geosci., 139, 104446, 2020. https://doi.org/10.1016/j.cageo.2020.104446
- J. Nielsen, R. Budiu, Mobile Usability, New Riders Press, 2012.