Experimental Study on Mechanical Behavior of Polypropylene-based Blends with Talc Fillers

Adv. Sci. Technol. Eng. Syst. J. 5(6), 571–576 (2020);
 DOI: 10.25046/aj050669
In this report, polymeric composites made from Polypropylene (PP) and talc powder were studied. The talc powder with different portions of 10%, 20%, 30% by weight was used to create samples. The samples were examined by the tensile test and the flexural test according to ASTM D638 and ASTM D790. The surface morphology of the samples were investigated by scanning electron microscope (SEM). Increased the talc powder portion led to a decrease in the tensile strength and flexural strength. Among the added talc powder samples, the 10% talc powder sample presented the highest mechanical tensile strength of 25.91 MPa and flexural strength of 47.99 MPa, while the 30% talc powder sample shown the lowest mechanical tensile strength and flexural strength. The results of SEM analysis indicated the existence of talc plates and porosity between talc plates and PP substrate compared to the neat PP sample. The surface morphology of the samples was observed by SEM, showing higher porosity in samples with increasing filler content. Moreover, increasing the talc powder portion resulted in a higher chance of brittle fracture. The research indicated and explained the effect of talc power on the characteristic of PP.
1. Introduction
Neat Polypropylene (PP) plastic resins are preferred for plastic products requiring a high cost of the material bill. Therefore, with conventional products, manufacturers can use recycled PP to reduce costs and reduce environmental pollution [1-3]. Normally, the products made from recycled PP consist of neat PP, recycled PP, and filler. Fillers help reduce costs as well as improve the functionality of the product [4-6]. They are usually insoluble minerals, adding them will increase the volume of polymers. They can be broadly classified as reinforcing or non-reinforcing fillers. Among them, CaCO3 is a popular choice for filler roles [7-9]. CaCO3 fillers have been used in the form of fine particles with a size of less than 10 µm. CaCO3 content can be added from a few percent to up to 30 percent by weight ratio. Adding CaCO3 could greatly improve the thermal and mechanical properties of polymer materials [10-12].
For example, adding 20% CaCO3 will improve thermal stability by about 27.5oC and in case of 30%, the tensile modules will increase by 97% when compared to pure PP [13]. Similarly, with 5, 10 and 20% CaCO3 by weight, the results of the study have shown an increase in the elastic modulus, yield to break, and elastic stress. It has also been confirmed that viscosity during flow increases with fortifier addition and reaches the highest value with 15% talc [14]. The effect of kaolin on the mechanical properties of PP/Polyethylene through mixing kaolin fillers with the content of 1, 3, 5, 10, 14% by weight ratio is also considered [15]. The results showed that the tensile strength increased simultaneously with the increase of the filler concentration from 2 MPa of non-padded PP/Polyethylene and up to 9 MPa with the appearance of 14% kaolin. Increase the concentration of kaolin from 0 to 14% helps increase from 40 HD (Shore D Hardness) to 70HD.
Talc is also commonly added to increase hardness and improve the properties of polymers [16-18]. Therefore, more than 200 thousand tons of talc powder is mixed with PP annually. Talc has many effects of increasing hardness, durability, thermal resistance, and anti-damage of ultraviolet rays, good scratch resistance [19-21]. Talc is widely used in plastic products for machine parts such as cars and motorcycles, as well as household plastic products such as nylon bags and plastic pots. The current trend in the automotive industry is to produce thin, light, and precisely sized parts, which requires higher rheological resins that talc fillers can meet. China is the key world talc and steatite producing country with an output of about 2.2 million tonnes (2016), which accounts for 30% of total global output.
Several authors showed that adding talc could rise the mechanical properties of pure PP [22-25]. For instance, Urmila el al. pointed out that adding 10, 20, 30, 40, and 50% weight ratio results in the improvement of mechanical properties such as tensile strength from 23,49 MPa with primary PP up to 26,65 MPa [22]. Silva reported that adding talc with the ratio of 5, 10, 15, and 20% of the weight ratio leads to an increase in the tensile strength, from 28 ± 5MPa of pure PP up to 130 ± 4 MPa [14]. Mechanical properties of materials such as Charpy impact resistance and tensile strength can also be improved. Pan et. al indicated that tensile strength reaches its maximum value at 33.9 MPa in the presence of a 10% talc compared to 30.8 MPa of pure PP [23]. Moreover, the flexural strength also increased from 22,86 MPa to pure PP up to 32,98 MPa with 50% talc [22]. Too much talc powder is not good for the properties of the polymer. The tensile strength of the composite has 25% Talc is 24 MPa and 30% Talc is 22.5 MPa [24]. Composite PP with Talc shows an increase in elastic modulus when the amount of talc powder is up to 20% compared to pure PP from 85,72 MPa up to 150,0 MPa and decreases at higher concentrations [25].
The hardness of the mixture depends on the particle size and has been observed through microscopic images and the results of the Izod impact test give the result. With the larger particle size, the hardness decreases, and vice versa. For the impact toughness, with the particle size of 30 µm, the impact toughness is 6.5 (ft-lb/in) and with the particle size of 10 µm, the impact toughness is 12 (ft-lb/in) [26]. The hardness of the mixture increases with increasing Talc concentration [24]. Moreover, the impact toughness can also be improved by adding a suitable amount of talc. The impact toughness increased from 2 (KJ/m2) of primary PP increased to 4 (KJ/m2) with the appearance of 10% Talc, and then decreased to 3.5 (KJ/m2) [23].
When comparing directly the two most common fillers in PP, CaCO3, and Talc, there are still some mechanical weaknesses when adding CaCO3 (tensile strength, flexural strength, elastic modulus, stress to break, and elastic stress), while talc is somewhat more dominant. The aims of this study is investigating the effect of talc composition on the tensile strength, flexural strength and microstructure of PP polymer.
2. Materials and methods
2.1. Materials and samples preparation
PP (Moplen HP500N type) was supplied by Lyondell Basell Industries (Saudi Arabia). Talc (TMD type) particle size was from 28 to 44 µm, whiteness ranged from 88-95%, chemical composition comprises Fe2O3 2-3%, MgO 25-27%, CaO < 0.6%, SiO2 52-54%.
Table 1: Compositions of the samples (%wt.)
| Materials | Compositions of the samples (%wt.) | |||
| S1 | S2 | S3 | S4 | |
| PP | 100 | 90 | 80 | 70 |
| Talc | 0 | 10 | 20 | 30 |
Table 1 presents the compositions of the samples S1-S4. The samples making process uses computer systems mixing and extrusion Polylab research OS – Haake (Germany), which has the basic parameters of the system such as mixing chamber contained 120 cm3, and extrusion equipment L/D = 25, D = 16 mm. Single screw extrusion equipment connected to blown film system (blown film) and sheet extrusion system (0.2 to 1.2 mm x 100mm). Mixed samples were melt-blended during the period from 6-7 minutes with the temperature of the extruder zone temperature was 180°C. After extruding, the resulting pellets were dried at 80°C for 4h and then molded using injection molding machine into plates. The mold-temperature profiles were set at 180oC. The molding process was carried out in 5 minutes and then cooled for 20 minutes. Figure 1 presents the size of plate samples after molding, it is 145 x 145 mm in length and 2 mm in thickness.
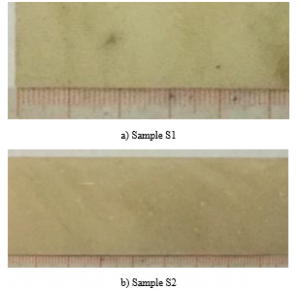

Figure 1: Material sheet for making samples: (a) Sample S1, (b) Sample S2, (c) Sample S3, and (d) Sample S4
2.2. Methods for mechanical properties and surface morphology analysis of samples
The tensile property was defined by method ASTM D638-02 experiments with the conditions required, as shown in Figure 2. Testing samples must be cleaned of oil, grease, and other impurities, then put into the environmental conditions of 23 ± 2°C direct heat, humidity 50 ± 5%, for 40 hours prior to the test. The experiments were conducted by Universal testing machine Shimadzu Autograph AG-X Plus 20kN (Japan). Some basic specifications are described as following: load capacity (maximum) 100 kN, traction speed 0.0005 to 1000 mm/min ± 0.1%, tensile capacity (maximum) 600 mm. This paper using speed was 55mm/min

Figure 2: Specimen for tensile test
Flexural properties were defined by method ASTM D790 experiments. Samples are the composite material beams of rectangular cross-section placed 3-point bending under load. The sample size was shown in Figure 3. The experiments were conducted by Universal testing machine Shimadzu Autograph AG-X Plus 20kN.
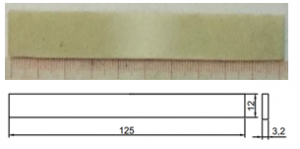
Figure 3: Sample for flexural test
The fracture surface of each specimen in the bending strength test was observed by scanning electron microscope HITACHI S -high resolution – 4800 (SEM), with acceleration 5.0 kV. The surface of the samples used for SEM all was platinum-sputtered with a conductive layer before observation.
3. Results and discussions
3.1. Tensile strength
The number of replicates is mostly four. Despite there is some differences between replicates, they varied only a few percent. Figure 4 shows the stress-strain curves of S1-S4 samples. Figure 5 shows the average values of the tensile strength of these samples. The tensile strength values are 30.73 MPa, 25.91 MPa, 23.68 MPa, and 23.29 MPa corresponding to S1, S2, S3, and S4 samples, respectively. In general, increase the talc content leads to decrease in tensile strength, a similar result of Zihlif report [24].
Table 2 presents the elongations of S1, S2, S3 and S4 samples. The average elongation values are 6.09%, 3.45%, 1.89%, and 2.99% corresponding to S1, S2, S3, and S4 samples, respectively. Increase the talc content mostly decrease the elongation value of the samples.
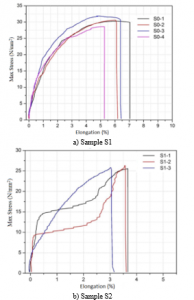
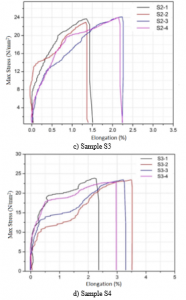
Figure 4: Stress-strain behavior of tensile strength: (a) Sample S1, (b) Sample S1, (c) Sample S3, and (d) Sample S4
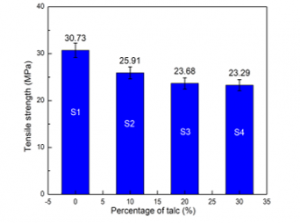
Figure 5: Tensile strength comparison of samples
Table 2: Elongations of the samples
| Samples | S1 | S2 | S3 | S4 |
| Elongation (%) | 6.09 | 3.45 | 1.83 | 2.99 |
This result may be due to the function of talc. When mixing talc into the PP, the aggregation of talc affects the crystallization process whereby talc acting as a nucleating agent uniformly distributed in the matrix resin PP and filling the matrix. However, an uneven talc particle size and the excessive incorporation of this filler may lead to filler agglomeration in the polymer matrix leading to the formation of micro-filter due to the difficulties in achieving a homogeneous dispersion of fillers. This phenomenon leading to weakening the interfacial bonding with the PP matrix, and creating some voids and defected structure of the composites, therefore, causing a reduction in tensile strength.
3.2. Flexural strength
Figure 6 illustrates the stress-strain curves of the flexural test of S1-S4 samples. Figure 7 shows the average values of the flexural strength of these samples. The flexural strength values are 49.31 MPa, 47.99 MPa, 46.06 MPa, and 47.62 MPa corresponding to S1, S2, S3, and S4 samples, respectively. In general, increase the talc content leads to decrease the flexural strength, a similar result of Zihlif report [24].
Table 3 presents the elongations of S1-S4 samples. The average elongation values are 6.09%, 3.45%, 1.89%, and 2.99% corresponding to S1, S2, S3, and S4 samples, respectively. Increase the talc content mostly decrease the elongation value of the samples.
Table 3: Flexural strain of the samples
| Sample | S1 | S1 | S3 | S4 |
| Flexural strain (%) | 7.24 | 3.99 | 2.56 | 2.73 |
The reductions of the flexural strength and flexural strain are the result of the toughness and hardness increase. The introduction of rigid particles in a ductile matrix leads to lower elasticity/ deformability of the resulting compound.
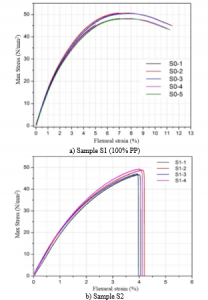
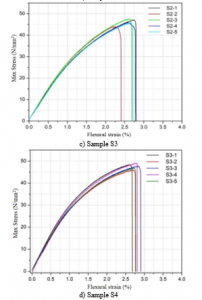
Figure 6: Stress-strain behavior of flexural strength: (a) S1, (b) S2, (c) S3, and (d) S4

Figure 7: Flexural strength comparison of samples
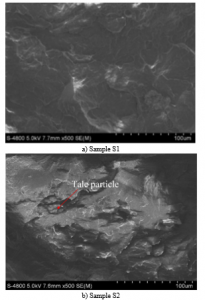
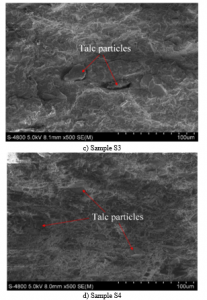
Figure 8: Fracture surface microstructure of samples: (a) Sample S1, (b) Sample S2, (c) Sample S3, and (d) Sample S4
3.3. Microstructure
The fracture surface microstructure of the samples is analyzed by SEM to have a more insightful view, as shown in Figure 8. Figure 8(b), (c) and (d) indicates the presence of talc powder in the polymer matrix. These figures also show the porosity between the talc powder and the PP matrix. Increase the talc will lead to an increase in the existence of this powder and porosity in the matrix.
All these factors contributed to the transfer of stresses from the matrix to the filler leads to reduce the bending properties. Furthermore, it was cleared that the fracture surface of PP matrix was clear and the number of the craze was limited, so the fracture was a brittle fracture. But the fracture surface of PP/Talc blends was rough, and the number of crazes increased with the increasing dosage of talc. Therefore, in this case, the fracture of PP matrix was a brittle fracture as the crystallization of the higher talc contain sample was higher, a similar result to Pan et al. [23].
4. Conclusions
In this study, the effect of 10%, 20%, and 30% talc to the tensile strength and flexural strength was studied. Some important points can be withdrawn as follow:
- The 10% talc powder sample posses the highest mechanical tensile strength of 91 MPa and flexural strength of 47.99 MPa among the talc powder samples. The 30% talc powder sample presents the lowest mechanical tensile strength, while the 20% talc powder sample represents the lowest flexural strength.
- The SEM results indicates the existence of talc powder and porosity between talc plates and PP substrate compared to the pure PP sample. Increasing the talc powder leads to a higher rate of porosity and a higher chance of brittle fracture.
Conflict of Interest
The authors declare no conflict of interest.
Acknowledgment
We are acknowledged HCMC University of Technology and Education, Dong Nhan Phat Co., Ltd and Material Testing Laboratory (HCMUTE). They gave me an opportunity to join in their team, accessed to the laboratory and research machines. Without their appreciated support it would not be possible to conduct this research.
- S. Yin et al. “A life cycle assessment of recycled polypropylene fibre in concrete footpaths”. Journal of Cleaner Production, 112, 2231-2242, 2016. https://doi.org/10.1016/j.jclepro.2015.09.073
- J.H. Lin et al. “Study on the processing technology and mechanical properties of nonwoven fabric composited by recycled PP selvedges”. Advanced Materials Research, 287, 2748-2751, 2011. https://doi.org/10.4028/www.scientific.net/AMR.287-290.2748
- A.L. Inacio et al. “Recycled PP/EPDM/talc reinforced with bamboo fiber: Assessment of fiber and compatibilizer content on properties using factorial design”. Polymer Testing, 61, 214-222, 2017. https://doi.org/10.1016/j.polymertesting.2017.05.022
- P.D. Bloom et al. “Development of novel polymer/quasicrystal composite materials”. Materials Science and Engineering: A, 294, 156-159, 2000. https://doi.org/10.1016/s0921-5093(00)01230-2
- W. Gacitua, “Polymer nanocomposites: synthetic and natural fillers a review”. Maderas. Ciencia y tecnología, 7(3), 159-178, 2005. http://dx.doi.org/10.4067/S0718-221X2005000300002
- R.N. Rothon, “Mineral fillers in thermoplastics: filler manufacture and characterisation”. In Mineral Fillers in Thermoplastics I, 67-107, 1999. https://doi.org/10.1007/3-540-69220-7_2
- N. Shimpi, “Dispersion of nano CaCO3 on PVC and its influence on mechanical and thermal properties”. Journal of composite materials, 44(2), 211-219, 2010. https://doi.org/10.1177/0021998309344637
- T. Lam et al. “Effect of nanosized and surface-modified precipitated calcium carbonate on properties of CaCO3/polypropylene nanocomposites”. Materials Science and Engineering: A, 501(1-2), 87-93, 2009. https://doi.org/10.1016/j.msea.2008.09.060
- S. Ozay “Preparation of organically modified CaCO3 and its use in the manufacture of polypropylene composites”. In ECCM15: 15th European Conference on Composite Materials, 24-28, 2012.
- L. Xie et al.. “Rheological and mechanical properties of PVC/CaCO3 nanocomposites prepared by in situ polymerization”. Polymer, 45(19), 6665-6673, 2004. https://doi.org/10.1016/j.polymer.2004.07.045
- B. Zhou et al.. “Mechanical and thermal properties of poly-ether ether ketone reinforced with CaCO3”. European polymer journal, 40(10), 2357-2363, 2004. https://doi.org/10.1016/j.eurpolymj.2004.05.019
- P. Yang et al. “Design of self-healing microcapsules containing bituminous rejuvenator with nano-CaCO3/organic composite shell: Mechanical properties, thermal stability, and compactability”. Polymer Composites, 39(S3), E1441-E1451, 2018. https://doi.org/10.1002/pc.24343
- H. Essabir, M. Ouadi, D. Rodrigue, “A comparison between bio – and mineral calcium carbonate on the properties of polypropylene composites”. Construction and Building Materials, 134, 549-555, 2017. https://doi.org/10.1016/j.conbuildmat.2016.12.199
- A.L.N. da Silva. “Mechanical and rheological properties of composites based on polyolefin and mineral additives”. Polymer Testing, 21, 57-60, 2002. https://doi.org/10.1016/s0142-9418(01)00047-2
- C. Onuoha, O.O. Onyemaobi, C.N. Anyakwo. “Effect of filler loading and particle size on the mechanical properties of periwinkle shell filled recycled polypropylene composites” Indian Journal of Materials Science, 2017.
- Katiyar J. K., Sinha S. K., Kumar, A.. “Friction and wear durability study of epoxy-based polymer (SU-8) composite coatings with talc and graphite as fillers”. Wear, 362, 199-208, 2016. https://doi.org/10.1016/j.wear.2016.06.011
- M. Ü. N. İ. R. Taşdemir, Ersoy S.. “Mechanical, morphological and thermal properties of HDPE polymer composites filled with talc, calcium carbonate and glass spheres”, 2015.
- H.G. Premalal “Comparison of the mechanical properties of rice husk powder filled polypropylene composites with talc filled polypropylene composites”. Polymer Testing, 21(7), 833-839, 2002. https://doi.org/10.1016/s0142-9418(02)00018-1
- M. Abdouss et al. “Effects of compatibilization of oxidized polypropylene on PP blends of PP/PA6 and PP/talc”. Journal of Applied Polymer Science, 92(5), 2871-2883, 2004. https://doi.org/10.1002/app.20207
- R. Browning et al. “Effects of slip agent and talc surface-treatment on the scratch behavior of thermoplastic olefins”. Polymer Engineering & Science, 46(5), 601-608, 2006. https://doi.org/10.1002/pen.20507
- J.K. Katiyar “Friction and wear durability study of epoxy-based polymer (SU-8) composite coatings with talc and graphite as fillers”. Wear, 362, 199-208, 2016. https://doi.org/10.1016/j.wear.2016.06.011
- S.K. Urmila, “Study of talc filled polypropylene a concept for improving mechanical properties of polypropylene”. International Journal of Research in Engineering and Technology, 2(4), 441-445, 2013.
- W. Pan, X. Ding, H. Gu. “Effect of Talc on Crystallization and Properties of Polypropylene”. American Journal of Materials Research, 2(04), 35-43, 2015.
- A.M. Zihlif, G. Ragosta. “Mechanical properties of talc polypropylene composites”. Materials Letters, ll, 10-12, 1991. https://doi.org/10.1016/0167-577X(91)90136-T
- M.A. Khan, M. Arif Siddiqui. “Effect Of Talc On Bending Strength Of Polypropylene Composites”. International Journal of Mechanical and Production Engineering Research and Development, 3(3), 41-46, 2013.
- H.G. Karian (eds). Handbook of polypropylene composites. Marcel Dekker INC, Second Edition, 295-323, 2003.