Interface for Visualization of Wireless Propagation Multipath Clustering Outcomes

Adv. Sci. Technol. Eng. Syst. J. 5(6), 544–549 (2020);
 DOI: 10.25046/aj050665
A graphical user interface (GUI) is presented to visualize the multipaths generated by COST 2100 channel model (C2CM) and the results of clustering the wireless propagation multipaths using Modified Simultaneous Clustering and Model Selection (MSCAMSMA). The usual practice of authors is to show their data and results using figures, tables, and graphs which are already sufficient to present their studies. However, the manner of displaying the data and results is static; that is, the user cannot examine them to analyze further the relationship of the different variables involved in the study. The paper presents a step further by showing dynamically the data and results which the user can manipulate according to its needs.
1. Introduction
Data and results are integral parts of a scientific study. They are important in the research process as the data is the basis of the study, and the results show the outcomes of the work done. That is why it is important to present the data and results in a manner that is easily read, seen, and understood by the reader.
Most papers use figures, tables, algorithms, equations, diagrams, illustrations, programs, and graphs to visualize the data and results of the study. The technique of presenting the data and results is sufficient for what the authors want to show. However, this method is static and dependent on what the authors want to present. Researchers cannot manipulate the data and analyze the effects of changing the input parameters. This paper addresses this concern by presenting a graphical user interface (GUI) that is dynamic, modifiable, and suitable to the need of the user. This way, researchers can have a deeper and better experience and understanding of what they are studying and examining.
GUI is one of the key technological advancements due to improvements in computer hardware and software. GUI greatly improved user experience by displaying the information. A GUI is an interactive system with visual components for manipulation. An interface is a useful tool that makes the most of the vision capacity of the user. A GUI allows a person to visually control the flow of information and decide on what is relevant and discard what is not [1]. Some lack analysis platform [2]–[4] unlike those in [5]– [13]. In this paper, a GUI is developed to manage the data and results of clustering European Cooperation in Science and Technology (COST) 2100 dataset [14, 15] using Modified Simultaneous Clustering and Model Selection (MSCAMSMA) [16]. The interface is an effective method in visualizing the COST 2100 dataset and the clustering results. A previous work [17] on GUI can visually analyze the reference data and the calculated clusters but considered only the cluster count. In this work, the GUI can be used by the user to visualize, manipulate, and analyze the multipaths generated by the COST 2100 channel model (C2CM) and the clustering results of MSCAMSMA not only giving the accuracy on the number of clusters but also the membership of clusters. The paper is organized in the following way. Section 2 presents the dataset generated by C2CM. Section 3 describes the clustering approach. Section 4 discusses the GUI developed. Section 5 concludes the work.
2. COST 2100 Channel Model (C2CM) Dataset
C2CM [18]–[21] is characterized by multipath clusters, as shown in
Figure 1. C2CM can reproduce the stochastic properties of multiple-
input multiple-output (MIMO) wireless communication channels. A multipath component (MPC) is defined by its delay (τ), angle of departure (Azimuth of Departure (AoD), Elevation of Departure (EoD)), and angle of arrival (Azimuth of Arrival (AoA), Elevation of Arrival (EoA)). Multipath clusters are groups of MPCs with similar delays and angles.
A channel impulse response (CIR) from the base station (BS) to mobile station (MS) antennas is characterized by the combination of MPCs from all the active multipath clusters and is given as
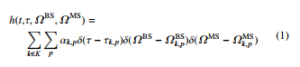
where K is the set of visible cluster indexes, αk,p is the complex amplitude of the pth MPC in the kth cluster, ΩkBS,p is the direction of departure (AoD, EoD), and ΩkMS,p is the direction of arrival (AoA, EoA) of the MPC.
For a MIMO system using V and U multiple antennas arrays at BS and MS, respectively, the U × V MIMO channel matrix H(t,τ), under the plane wave and balanced narrowband array assumptions, can be expressed as
![]()
where sMS is the antenna steering vector at MS and sBS is the antenna steering vector at BS.
The dataset [14, 15] is generated by C2CM, which consist of two indoor and six semi-urban channel scenarios as follows:
- Indoor, Band 1 (B1), Line-of-Sight (LOS), Single Link (SL)
- Indoor, Band 2 (B2), Line-of-Sight, Single Link
- Semi-Urban, Band 1, Line-of-Sight, Single Link
- Semi-Urban, Band 2, Line-of-Sight, Single Link
- Semi-Urban, Band 1, Non-Line-of-Sight (NLOS), Single Link
- Semi-Urban, Band 2, Non-Line-of-Sight, Single Link
- Semi-Urban, Band 1, Line-of-Sight, Multiple Links (ML) 8. Semi-Urban, Band 2, Line-of-Sight, Multiple Links
Each channel scenario has thirty sets of data. There are a different number of multipaths and multipath clusters for each set of data. The seven features of the dataset are the following: whitened x-component of AOD (X AOD W), the whitened y-component of AOD (Y AOD W), the whitened z-component of AOD (Z AOD W), the whitened x-component of AOA (X AOA W), the whitened ycomponent of AOA (Y AOA W), the whitened z-component of

Figure 1: Multipath components and multipath clusters in COST 2100 channel model [22]
AOA (Z AOA W), and the whitened delay (delay W). The reference cluster identifications of the data are given by refclusID, which serves as the ground truth in evaluating the performance of the clustering approach. The power component (rel pow) is not included since it is not needed by the clustering approach.
3. Modified Simultaneous Clustering and Model Selection (MSCAMSMA)
MSCAMSMA [16] is used to cluster the COST 2100 dataset. The clustering approach is introduced to improve the clustering accuracy of SCAMSMA [23]. The accuracy of SCAMSMA depends on the correct formulation of the data affinity matrix, Ccalc, so that a 0-1 block diagonal is formed. MSCAMSMA can be described as follows: Let the dataset X∈RL×D where L was the number of multipath components or the number of rows and D the number of dimensions, which is seven, or the number of columns. A multipath, x, consists of a single row of seven columns. A dataset can be expressed as
![]()
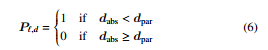
MSCAMSMA depends on three constraints: pairwise, binary, and proximity. Pairwise Constraint, P`,d, depends on the absolute distance, dabs, of the corresponding pair of multipaths for the seven dimensions which are given by
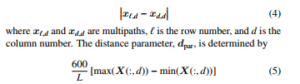
L where max( ) is the function that gives the maximum value of a column while min( ) gives the minimum value of the said column, and “:” denotes all rows if it is in the first argument. Factor 600 is used so that MSCAMSMA applies to all of the datasets. A value less than 600 gives at least one all-zero row leading to an incorrect affinity matrix. A value greater than 600 leads to an all-one matrix, excluding the main diagonal. The resulting affinity matrix is also not correct. The Pairwise Constraint is given by
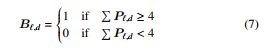
Binary Constraint, B`,d, takes on the sum of the values of the P`,d of the seven dimensions and returns a binary value of either zero or one. If the sum is less than four, then the returned value is zero, which means that the multipaths are not of the same cluster. On the other hand, when the sum is greater than or equal to four, then a value of one is returned, which means that the multipaths are within the same cluster. Binary Constraint is given by
Proximity Constraint is followed by combining multipaths to form clusters around the main diagonal, thus, creating the 0-1 block diagonal of Ccalc. Ccalc serves as input to Alternating Direction of Method of Multipliers (ADMM) which is used to calculate the ideal affinity matrix, Cideal. Asso Constrained Boolean Matrix Factorization (AssoCBMF) takes Cideal as input to solve for the number of clusters and the membership of the clusters.
4. Graphical User Interface (GUI)
A GUI is an interactive system with visual components that can be used to manipulate a computer program. The study uses a GUI to manage the data and results of clustering COST 2100 dataset using MSCAMSMA. The introductory page showing the different tabs and the explanations is illustrated in Figure 2. Aside from the Introduction Tab, there are five other tabs, namely: COST 2100 Dataset, Directional Cosine Transform and Whitening Transform, Modified SCAMSMA, Relative Frequencies, and Summary.
The COST 2100 Dataset tab displaying the various channel scenarios is shown in Figure 3. Each chosen channel scenario gives the corresponding data generated by C2CM and the clustering results.
Figure 4 shows the window arising from the chosen channel scenario in the COST 2100 Dataset tab. When the generate button is pressed, the window shows the characteristics of the channel scenario like the channel frequency, mobile station velocity, the distance between the mobile station and the base station, the number of clusters, and the number of multipaths as shown in Figure 5. The parameters of the multipaths are tabulated and shown in a graph. The multipaths are color-coded with lighter colors representing higher relative power, while darker colors represent lower relative power. The default is Trial 1. Choosing another trial, from Trial 2 to Trial 30, by changing the position of the slider and pressing the Generate button, shows the corresponding characteristics, parameters, and graph of the multipaths.
The multipaths are transformed using Directional Cosine Transform (DCT) and Whitening Transform (WT). DCT is performed to the datasets to overcome the problem of the circular nature of the angular domain. At the same time, WT is applied to the dataset to eliminate the issues on units and standardized the dataset [14]. The corresponding graphs of the transformed multipaths and the

Figure 2: Graphical user interface introductory page containg the different tabs and their descriptions
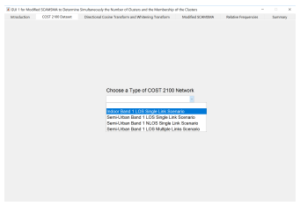
Figure 3: Ensuing window for the COST 2100 dataset tab showing the different channel scenarios
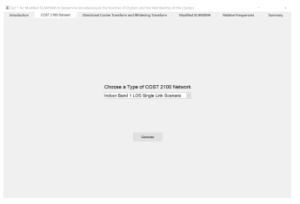
Figure 4: Subsequent window for the chosen channel scenario of the COST 2100 dataset
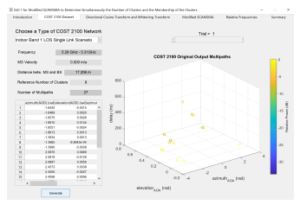
Figure 5: COST 2100 Dataset tab displaying the characteristics, parameters, and graph of the multipaths of the chosen channel scenario
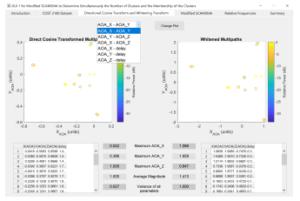
Figure 6: Graphs and tabulated parameters of the transformed multipath components of the chosen combination in the drop down menu
tabulated parameters are shown in the Directional Cosine Transform and Whitening Transform tab in Figure 6. The graphs and tabulated parameters can be changed by choosing a different combination in the drop-down menu and pressing the Change Plot button.
Figure 7 shows the Modified SCAMSMA tab illustrating the grouping of the COST 2100 dataset at the left and the clustering output of MSCAMSMA at the right. The window also shows the reference number of clusters, the calculated number of clusters, the Jaccard index accuracy of the number of clusters, and the Jaccard index accuracy of the membership of clusters. The graphs, number of clusters, and Jaccard indices appear only when the calculated number of clusters is equal to the reference number of clusters.
Otherwise, the results will not be shown.
The Relative Frequencies tab in Figure 8 shows the relative frequencies of the number of clusters in blue and the membership of clusters in red. The higher the relative frequency, when the Jaccard index is closer to one means that the clustering accuracy is higher. On the other hand, relative frequencies near zero Jaccard index implies that there is lower clustering accuracy.

Figure 7: Comparison of the reference multipath clusters and the calculated multipath clusters and the resulting Jaccard indices

Figure 8: Window for tab four showing the relative frequencies of the Jaccard indices of the number of clusters in blue and the membership of clusters in red

Figure 9: Window for tab five showing the mean Jaccard indices of the number of clusters and the membership of clusters of the channel scenarios
Figure 9 shows the Summary tab displaying the mean Jaccard indices of the number of clusters and the membership of clusters of all the channel scenarios. Higher mean Jaccard index means that the multipaths are clustered more accurately.
The MATLAB codes for the GUI, the reference dataset, and the calculated dataset can be found at [24]. The codes together with the reference dataset and the clustered multipaths can be compiled using the MATLAB version 2019a software to manipulate the dataset and the clustering results.
5. Conclusion
This paper shows a GUI that can be used to visualize the multipaths generated by C2CM and the results of clustering the wireless propagation multipaths using MSCAMSMA. The usual practice of authors is to illustrate their data and results using figures, tables, and graphs, which are already sufficient to present their studies. However, the presentation is static and cannot be manipulated by the readers. This study extended the common practice of showing the data and results by presenting an interface to visualize and manage what is not displayed in the publication. This way, researchers can have a better understanding of the study being presented and explore the portions of the study not shown.
Conflict of Interest
The authors declare no conflict of interest.
Acknowledgment
The authors would like to thank the Department of Science and Technology-Engineering Research and Development for Technology (DOST-ERDT), Office of Vice-Chancellor for Research and Innovation (OVCRI) of De La Salle University (DLSU), and Tokyo City University (TCU) for the realization of this paper.
- A. Edwards, ”The rise of the graphical user interface,” Library Hi Tech, 14(1), 46–50, 1996. https://doi.org/10.1108/eb047980
- L. Villanueva, R. Gustilo, ”Artificial neural network based antenna sensitivity assignments for chaotic internet service provider net- work architecture,” Int. J. Eng. Technol.(UAE), 7(2), 14–17, 2018. https://doi.org/10.14419/ijet.v7i2.3.9958
- S. Chatvichienchai, Y. Kawasaki, ”Spreaddb: Spreadsheet- based user interface for querying and updating data of external databases,” Int. J. Adv. Trends Comput. Sci. Eng., 7(2), 6–10, 2018. https://doi.org/10.30534/ijatcse/2018/01722018
- L. Vladareanu, V. Vladareanu, H. Yu, H. Wang, F. Smarandache, ”Robot advanced intellectual control developed through flexible intelligent portable platform,” Int. J. Adv. Trends Comput. Sci. Eng., 8(1.1), 202–208, 2019. https://doi.org/10.30534/ijatcse/2019/3881.12019
- M. Cabatuan, E. Dadios, R. Naguib, ”Computer Vision-Based Breast Self- Examination Palpation Pressure Level Classification Using Artificial Neural Networks and Wavelet Transforms,” in Proceedings IEEE Region 10 Annual In- ternational Conference, 2012. https://doi.org/10.1109/TENCON.2012.6412282
- M. Eman, M. Cabatuan, E. Dadios, L. Gan Lim, ”Detecting and Tracking Female Breasts Using Neural Network in Real-Time,” in Proceedings IEEE Region 10 Annual International Conference, 2013. https://doi.org/10.1109/TENCON.2013.6718899
- J. Jose, M. Cabatuan, E. Dadios, L. Gan Lim, ”Depth Estimation in Monocular Breast Self-Examination Image Sequence Using Optical Flow,” in 7th International Conference on Humanoid, Nanotechnology, Informa- tion Technology, Communication and Control, Environment, and Man- agement joint with 6th International Symposium on Advanced Compu- tational Intelligence and Intelligent Informatics co-located with 10th En- gineering Research and Development for Technology Conferrence, 2014. https://doi.org/10.1109/HNICEM.2014.7016220
- J. Jose, M. Cabatuan, E. Dadios, L. Gan Lim, ”Stroke Position Classification in Breast Self-Examination Using Parallel Neural Network and Wavelet Trans- form,” in Proceedings IEEE Region 10 Annual International Conference, 2015. https://doi.org/10.1109/TENCON.2014.7022288
- J. Jose, M. Cabatuan, R. Billones, E. Dadios, L. Gan Lim, ”Monocular Depth Level Estimation for Breast Self-Examination (BSE) Using RGBD BSE Dataset,” in Proceedings IEEE Region 10 Annual International Conference, 2016. https://doi.org/10.1109/TENCON.2015.7372948
- R. Masilang, M. Cabatuan, E. Dadios, ”Hand Initialization and Tracking Using a Modified KLT Tracker for a Computer Vision-Based Breast Self- Examination System,” in 7th International Conference on Humanoid, Nan- otechnology, Information Technology, Communication and Control, Environ- ment, and Management joint with 6th International Symposium on Advanced Computational Intelligence and Intelligent Informatics co-located with 10th Engineering Research and Development for Technology Conference, 2014. https://doi.org/10.1109/HNICEM.2014.7016244
- R. Masilang, M. Cabatuan, E. Dadios, L. Gan Lim, ”Computer-Aided BSE Torso Tracking Algorithm Using Neural Networks, Contours, and Edge Fea- tures,” in Proceedings IEEE Region 10 Annual International Conference, 2015. https://doi.org/10.1109/TENCON.2014.7022300
- E. Mohammadi, E. Dadios, L. Gan Lim, M. Cabatuan, R. Naguib, J. Avila, A. Oikonomou, ”Real-time evaluation of breast self- examination using computer vision,” Int. J. Biomed. Imag., 2014, 2014. https://doi.org/10.1155/2014/924759
- S. Rabano, M. Cabatuan, E. Sybingco, E. Dadios, E. Calilung, ”Common Garbage Classification Using MobileNet,” in Proceedings 10th International Conference on Humanoid, Nanotechnology, Information Technology, Com- munication and Control, Environment, and Management, 1–4, Nov. 2018. https://doi.org/10.1109/HNICEM.2018.8666300
- J. Blanza, A. Teologo, L. Materum, ”Datasets for Multipath Clustering at 285 MHz and 5.3 GHz Bands Based on COST 2100 MIMO Channel Model,” in 9th International Symposium on Multimedia and Communication Technology, 1–5, 2019. https://doi.org/10.1109/ISMAC.2019.8836143
- J. Blanza, A. Teologo, L. Materum, ”Datasets for Multipath Clustering at 285 MHz and 5.3 GHz Bands Based on COST 2100 MIMO Channel Model,” 2019. [Online]. Available: http://dx.doi.org/10.21227/4cb9-hf81
- J. Blanza, ”Identification of Wireless Propagation Multipath Clusters and Their Cardinality Using Simultaneous Clustering and Model Selection Matrix Affin- ity and Deep Divergence-Based Clustering Approaches,” Ph.D Thesis, De La Salle University, 2020.
- M. Roque, L. Materum, ”Interface for the Factor-inclusion Weighting Approach in Determining the Number of Multipath Propagation Clus- ters,” Int. J. Adv. Trends Comput. Sci. Eng., 8(4), 1768–1776, 2019. https://doi.org/10.30534/ijatcse/2019/107842019
- J. Poutanen, K. Haneda, L. Liu, C. Oestges, F. Tufvesson, P. Vainikainen, ”Parameterization of the COST 2100 MIMO Channel Model in Indoor Scenar- ios,” in Proceedings 5th European Conference on Antennas and Propagation, 3606–3610, 2011.
- L. Liu, C. Oestges, J. Poutanen, K. Haneda, P. Vainikainen, F. Quitin, F. Tufves- son, P. De Doncker, ”The COST 2100 MIMO channel model,” IEEE Wireless Commun., 19(6), 92–99, 2012. https://doi.org/10.1109/MWC.2012.6393523
- R. Verdone, A. Zanella, ”Pervasive Mobile and Ambient Wireless Communica- tions: COST Action 2100 (Signals and Communication Technology),” London: Springer, 2012.
- M. Zhu, G. Eriksson, F. Tufvesson, ”The COST 2100 channel model: Parameterization and validation based on outdoor MIMO measurements at 300 MHz,” IEEE Trans. Wireless Commun., 12(2), 888–897, 2013. https://doi.org/10.1109 .120620
- Y. Li, J. Zhang, Z. Ma, Y. Zhang, ”Clustering analysis in the wireless propa- gation channel with a variational Gaussian mixture model,” IEEE Trans. Big Data, 6(2), 223–232, 2020. https://doi.org/10.1109/TBDATA.2018.2840696
- Z. Li, L. Cheong, S. Yang, K. Toh, ”Simultaneous clustering and model selection: Algorithm, theory and applications,” IEEE Trans. Pattern Anal. Mach. In- tell., 40(8), 1964—1978, 2018. https://doi.org/10.1109/TPAMI.2017.2739147
- https://sites.google.com/a/dlsu.edu.ph/jojoblanz