Variation Between DDC and SCAMSMA for Clustering of Wireless MultipathWaves in Indoor and Semi-Urban Channel Scenarios

Adv. Sci. Technol. Eng. Syst. J. 5(6), 538–543 (2020);
 DOI: 10.25046/aj050664
The performance of Simultaneous Clustering and Model Selection Matrix Affinity (SCAMSMA) and Deep Divergence-Based Clustering (DDC) in clustering wireless mul- tipaths generated by COST 2100 channel model (C2CM) is compared. Enhancing the accuracy of clustering multipaths is an open area of research which the clustering ap- proaches try to improve. Jaccard index is used as the clustering validity metric of the clustering approaches. The results of the clustering approaches are compared using the analysis of variance (ANOVA) toolbox of MATLAB and displayed using the box plots. Re- sults show that the cluster-wise Jaccard index is different between SCAMSMA and DDC for indoor scenarios, while the membership-wise Jaccard index is not. On the other hand, the cluster-wise Jaccard index is not different between the clustering approaches for semi-urban scenarios, while the membership-wise Jaccard index is a little different. The clustering approaches can be used in indoor scenarios based on accuracy.
1. Introduction
The European Cooperation in Science and Technology (COST) 2100 Channel Model (C2CM) [1]–[4] can reproduce the properties of multiple-input multiple-output (MIMO) wireless propagation channels. A multipath component (MPC) is classified based on the delay (τ), angle of departure (Azimuth of Departure (AoD), Elevation of Departure (EoD)), and angle of arrival (Azimuth of
Arrival (AoA), Elevation of Arrival (EoA)). Groups of multipath components with similar delays and angles comprise a multipath cluster, which characterized C2CM.
Analyzing wireless multipaths is an important problem where clustering is crucial. The attribute, performance, and efficiency of the communications system can be studied, understood, and improved by the generated channel model. The accuracy and correctness of the channel models significantly affect the precision and exactness of clustering wireless propagation multipaths. Several channel models and measurements reveal the clustering of multipaths. Inaccurate clustering of the wireless propagation multipaths leads to incorrect channel models and thereby degradation in performance.
Clustering finds the underlying structure of the data. It also group similar data together [5]–[16]. In our previous works [17]–
[20], Simultaneous Clustering and Model Selection Matrix Affinity (SCAMSMA) [21] and Divergence-Based Clustering (DDC) [22] were used to cluster the dataset [23, 24] generated by C2CM. In this work, the comparison of the clustering accuracy of SCAMSMA and DDC are presented. The main contributions of this study are (1) the paper shows the variation in the performance of SCAMSMA and DDC in clustering the COST 2100 dataset; and (2) SCAMSMA and
DDC have a significant difference in their accuracy in clustering the wireless multipaths.
The paper is organized in the following way. Section 2 presents the dataset generated by C2CM. Section 3 describes the clustering approaches. Section 4 explains the ANOVA used. Section 5 defines the Jaccard index. Section 6 discusses the ANOVA results. Section 7 concludes the work.
2. COST 2100 Dataset
COST 2100 channel model (C2CM) [1]–[4] can replicate the stochastic properties of multiple-input multiple-output (MIMO) wireless propagation channels. Multipath clusters characterize C2CM. A multipath component (MPC) is defined by its delay (τ), angle of departure (AOD) (Azimuth of Departure (AoD), Elevation of Departure (EoD)), and angle of arrival (AOA) (Azimuth of Arrival (AoA), Elevation of Arrival (EoA)). MPCs with similar delays and angles are grouped into multipath clusters, as shown in Figure 1.
A channel impulse response (CIR) from the base station (BS) to mobile station (MS) antennas is characterized by the combination of MPCs from all the active multipath clusters and is given as

where K is the set of visible cluster indexes, αk,p is the complex amplitude of the pth MPC in the kth cluster, ΩkBS,p is the direction of departure (AoD, EoD), and ΩkMS,p is the direction of arrival (AoA, EoA) of the MPC.
The dataset [23, 24] is generated by the C2CM, which consist of two indoor channel scenarios at 5.3 GHz and six semi-urban channel scenarios at 285 MHz as follows:
- Indoor, Band 1 (B1), Line-of-Sight (LOS), Single Link (SL)
- Indoor, Band 2 (B2), Line-of-Sight, Single Link
- Semi-Urban, Band 1, Line-of-Sight, Single Link
- Semi-Urban, Band 2, Line-of-Sight, Single Link
- Semi-Urban, Band 1, Non-Line-of-Sight (NLOS), Single Link
- Semi-Urban, Band 2, Non-Line-of-Sight, Single Link
- Semi-Urban, Band 1, Line-of-Sight, Multiple Links (ML)
- Semi-Urban, Band 2, Line-of-Sight, Multiple Links
Each channel scenario has thirty sets of data consisting of a different number of multipaths and multipath clusters. The seven features of the datasets are the following: whitened xcomponent of AOD (X AOD W), the whitened y-component of AOD (Y AOD W), the whitened z-component of AOD (Z AOD W), the whitened x-component of AOA (X AOA W), the whitened ycomponent of AOA (Y AOA W), the whitened z-component of AOA (Z AOA W), and the whitened delay (delay W). The reference cluster identification of the data is given by refclusID. It serves as the ground truth in evaluating the performance of the clustering approach. The power component (rel pow) is not included since it is not needed in clustering the data.

Figure 1: Generated wireless multipath components grouped as multipath clusters in
C2CM [11]
3. Clustering Approaches
The dataset generated by C2CM is clustered using SCAMSMA and DDC. SCAMSMA can simultaneously determine the number of clusters and the membership of the clusters. DDC can solve the membership of the clusters and the cluster count can be calculated according to the membership of the multipaths to their clusters. The clustering approaches are used to cluster images and it is the first time that they are applied to cluster multipaths.
SCAMSMA [21] begins by formulating an affinity matrix Ccalc using the self-expression method where a given dataset X can be represented as XCcalc as follows
![]()
where k · k1 is the `1 norm, which returns the sum of the absolute values of all elements and diag(·) are the diagonal entries of the matrix. The solution of (2) corresponds to Ccalc .
Introducing an ideal affinity matrix such that Cideal = PkK=1 zk◦zk and {zk ∈ {0,1}M}kK=1 where zk = 1 if the point belongs to the cluster otherwise zk = 0 and ◦ represents the vector outer product. By denoting W = −Ccalc, the clustering problem can be expressed as minhW,Cideali, s.t. zk{0,1}M,
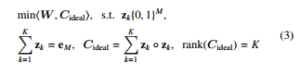
where h·, ·i is the Frobenius inner product, eM is an all one vector of size R while K is the number of clusters. SCAMSMA simultaneously solves the number of clusters and the membership of clusters.
DDC [22] optimizes a loss function based on informationtheoretic measures. The loss function is defined by

where k is the number of clusters, Khid is the kernel similarity matrix, α is the soft cluster assignment, A is the cluster assignment matrix, triu(AAT) is the upper triangular of AAT and m is the simplex corner assignment.
The clusters are represented by their probability density functions. Divergence measures the dissimilarity between clusters. The divergence builds on two fundamental objectives: the separation between clusters and the compactness within clusters, as shown in Figure 2. DDC explicitly exploits knowledge about the geometry of the output space during the optimization. DDC supports end-to-end learning, does not require hand-crafted feature design, and does not need a pre-training phase.
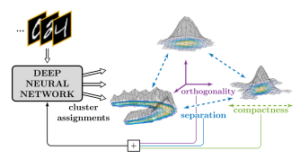
Figure 2: Fundamental objectives of divergence: separation between clusters and compactness within clusters [22]
4. Analysis of Variance (ANOVA)
One-way ANOVA [25, 26] is used to determine if there is a common mean of the data from several groups of a factor. The statistical tool can find out if there are different effects on the response variable of the different groups of an independent variable. The anova1 function of Statistics and Machine Learning Toolbox of MATLAB returns the p-value for a balanced one-way ANOVA. The MATLAB function also displays the box plots of the independent variable. Lastly, the anova1 function tests the hypothesis that the samples in the independent variable are drawn from populations with the same mean against the alternative hypothesis that the population means are not all the same.
One-way ANOVA is a simple, special case of the linear model which can be expressed as
![]()
where
yij is an observation, i represents the observation number, and j represents a different group of the predictor variable y. All yij are independent.
αj represents the population mean for the jth group.
ij is the random error, independent and normally distributed, with zero mean and constant variance.
The equality of column means for the data in matrix y is tested using the MATLAB function anova1(y), where each column is a different group and has the same number of observations.
ANOVA tests the hypothesis that all group means are equal versus the alternative hypothesis that at least one group is different from the others as follows:

ANOVA tests for the difference in the group means by partitioning the total variation in the data into two components: variation of group means from the overall mean and variation of observations in each group from their group mean estimates. It means that ANOVA partitions the total sum of squares (SST) into sum of squares due to between-groups effect (SSR) and sum of squared errors (SS E) given by

where nj is the sample size for the jth group, j = 1, 2, …, k.
ANOVA compares the variation between groups to the variation within groups. If the ratio of within-group variation to betweengroup variation is significantly high, then the group means are significantly different from each other. This ratio can be measured using a test statistic that has an F-distribution with (k − 1, N − k) degrees of freedom where
![]()
N−k where MSR is the mean squared treatment, MS E is the mean squared error, k is the number of groups, and N is the total number of observations. If the p-value for the F-statistic is smaller than the significance level (0.05), then the test rejects the null hypothesis that all group means are equal and concludes that at least one of the group means is different from the others. The p-value is derived by anova1 from the cumulative distribution function (CDF) of the Fdistribution. The p-value is correct, if ij are independent, normally distributed, and have constant variance.
5. Clustering Validity Index
The performance of a clustering approach is measured using a clustering validity index. The study uses the Jaccard index, which compares the similarity between the reference data and the calculated data. For the number of clusters, the Jaccard index is calculated as |C11|
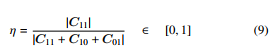
|C11 + C10 + C01| where | · | refers to cardinality, Ck ∈ C, K = |C| is the number of multipath clusters, C11 is the number of clusters that are present in the calculated clusters that are also present in the reference clusters, C10 is the number of clusters that are present in the calculated clusters but not present in the reference clusters, and C01 is the number of clusters that are present in the reference clusters but not present in the calculated clusters. For the membership of the clusters, the
Jaccard index is calculated as
![]()
M11 + M01 + M10 where M11 is the number of members that are present in the calculated clusters that are also present in the reference clusters, M10 is the number of members that are present in the calculated clusters but not present in the reference clusters, and M01 is the number of members that are present in the reference clusters but not present in the calculated clusters. A Jaccard index of one means that the calculated multipath clusters are the same as the reference multipath clusters, or the membership of the calculated multipath clusters is the same as the membership of the reference multipath clusters. A zero Jaccard index, on the other hand, means that there are no calculated multipath clusters that are equal to the reference multipath clusters, or there is no membership of the calculated multipath clusters that are equal to the membership of the reference multipath clusters.
6. Result and Discussion
The clustering accuracy of SCAMSMA and DDC are shown in
Table 1 for the indoor scenarios and Table 2 for the semi-urban scenarios. The performance of the clustering approaches in both indoor and semi-urban scenarios are based on the number of clusters and the membership of clusters. The means of the Jaccard indices are compared using ANOVA. The ANOVA is illustrated using box plots. The box plots and p-values are generated using the anova1 one-way approach function of MATLAB. The box plots display the range of Jaccard indices and can be used to visualize the means. Values of p < 0.05 indicate that the means of SCAMSMA and DDC are significantly different.
Table 1: Jaccard index means of SCAMSMA and DDC in indoor scenarios
| Clustering | Indoor | Indoor |
| Approach | Number of Clusters | Membership of Clusters |
| SCAMSMA | 0.6261 | 0.7444 |
| DDC | 0.7499 | 0.8054 |
Table 2: Jaccard index means of SCAMSMA and DDC in semi-urban scenarios
| Clustering | Semi-Urban | Semi-Urban |
| Approach | Number of Clusters | Membership of Clusters |
| SCAMSMA | 0.0112 | 0.1615 |
| DDC | 0.0102 | 0.2172 |
The box plots of the Jaccard indices of the number of clusters of SCAMSMA and DDC for the indoor scenarios are shown in Figure 3. The p-value is 0.0388, which indicates that there is a significant difference in the means of the clustering accuracies. This difference can be seen in the figure where the box plot of DDC is higher than that of SCAMSMA. DDC is more accurate than SCAMSMA in clustering multipaths by 19.77%.
Figure 4 presents the box plots of the Jaccard indices of the membership of clusters of SCAMSMA and DDC for the indoor scenarios. The p-value is 0.0996, which attests that there is no significant difference in the means of the Jaccard indices. This difference can be visualized in the figure where the box plots are almost on the same level (∼ 0.8). DDC has higher accuracy in clustering multipaths than SCAMSMA by only 8.19%.
The box plots of the Jaccard indices of the number of clusters of
SCAMSMA and DDC for the semi-urban scenarios are illustrated

Figure 3: Box plots of the Jaccard indices for the number of clusters in indoor scenarios of SCAMSMA in box plot 1 and DDC in box plot 2
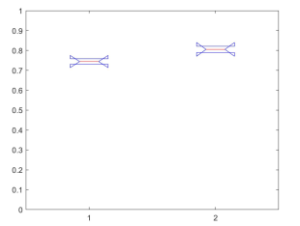
Figure 4: Box plots of the Jaccard indices for the membership of clusters in indoor scenarios of SCAMSMA in box plot 1 and DDC in box plot 2
in Figure 5. The p-value is 0.7419, which suggests that the means of SCAMSMA and DDC are similar (0.0112 vs. 0.0102). The figure indicates that the box plots are on the same level near the horizontal axis (∼ 0). SCAMSMA is more accurate this time by 9.80%.
Figure 6 displays the box plots of the Jaccard indices of the membership of clusters of SCAMSMA and DDC for the semi-urban scenarios. The p-value is 0.0139, which proves that the means of SCAMSMA and 3CAM-SCAMSMA are significantly different.
The figure shows that the box plot of DDC is higher than that of SCAMSMA. DDC has a higher clustering accuracy of 34.49%.
DDC shows consistency in its clustering performance due to higher accuracy of clustering multipaths in all channel scenarios except for the membership of clusters in semi-urban scenarios where SCAMSMA has a slight clustering advantage of 0.0012. Also, the means of SCAMSMA and DDC are significantly different since the

Figure 5: Box plots of the Jaccard indices for the number of clusters in semi-urban scenarios of SCAMSMA in box plot 1 and DDC in box plot 2
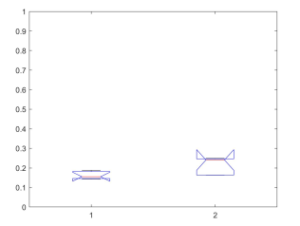
Figure 6: Box plots of the Jaccard indices for the membership of clusters in semiurban scenarios of SCAMSMA in box plot 1 and DDC in box plot 2
p-values are less than 0.05 except in the membership of clusters in semi-urban scenarios. Lastly, the clustering approaches can be used in indoor scenarios but not in semi-urban scenarios based on accuracy which is validated by the measurements done in indoor environment [27].
7. Conclusion
This work presents the comparison of the clustering accuracy of SCAMSMA and DDC in clustering wireless propagation multipaths generated by C2CM. Jaccard index is used as the performance metric of the clustering approaches. Results show that there is a significant difference in the cluster-wise Jaccard index between SCAMSMA and DDC for indoor scenarios while the membershipwise Jaccard index is not different. On the other hand, the clusterwise Jaccard index is not different between the clustering approaches for semiurban scenarios while the membership-wise Jaccard index is a little different. The clustering approaches can be used in indoor scenarios based on accuracy. However, a better multipath clustering method should be used for semi-urban scenarios. For future work, the results will be compared with other clustering approaches to determine the best performance in terms of clustering wireless multipaths in indoor and semi-urban environments.
Conflict of Interest
The authors declare no conflict of interest.
Acknowledgment
The authors would like to thank the Department of Science and Technology-Engineering Research and Development for Technology (DOST-ERDT), Office of Vice-Chancellor for Research and Innovation (OVCRI) of De La Salle University (DLSU), and Tokyo City University (TCU) for the realization of this paper.
- J. Poutanen, K. Haneda, L. Liu, C. Oestges, F. Tufvesson, P. Vainikainen, ”Parameterization of the COST 2100 MIMO Channel Model in Indoor Scenar- ios,” in Proceedings 5th European Conference on Antennas and Propagation, 3606–3610, 2011.
- L. Liu, C. Oestges, J. Poutanen, K. Haneda, P. Vainikainen, F. Quitin, F. Tufves- son, P. De Doncker, ”The COST 2100 MIMO channel model,” IEEE Wireless Commun., 19(6), 92–99, 2012. https://doi.org/10.1109/MWC.2012.6393523
- R. Verdone, A. Zanella, ”Pervasive Mobile and Ambient Wireless Communica- tions: COST Action 2100 (Signals and Communication Technology),” London: Springer, 2012.
- M. Zhu, G. Eriksson, F. Tufvesson, ”The COST 2100 channel model: Parameterization and validation based on outdoor MIMO measurements at 300 MHz,” IEEE Trans. Wireless Commun., 12(2), 888–897, 2013. https://doi.org/10.1109/TWC.2013.010413.120620
- N. Czink, P. Cera, J. Salo, E. Bonek, J.-P. Nuutinen, J. Ylitalo, ”A Frame- work for Automatic Clustering of Parametric MIMO Channel Data Including Path Powers,” in IEEE 64th Vehicular Technology Conference, 1–5, 2006. https://doi.org/10.1109/VTCF.2006.35
- C. Gentile, ”Using the kurtosis measure to identify clusters in wireless channel impulse responses,” IEEE Trans. Antennas Propag., 61(6), 3392–3395, 2013. https://doi.org/10.1109/TAP.2013.2253299
- B. Li, C. Zhao, H. Zhang, Z. Zhou, A. Nallanathan, ”Efficient and robust cluster identification for ultra-wideband propagations inspired by biologi- cal ant colony cluster ng,” IEEE Trans. Commun., 63(1), 286–300, 2015. https://doi.org/10.1109 377120
- S. Cheng, M.-T. Martinez-Ingles, D.P. Gaillot, J.-M. Molina-Garcia-Pardo, M. Lie´nard, P. Degauque, ”Performance of a novel automatic identification algorithm for the clustering of radio channel parameters,” IEEE Access, 3, 2252–2259, 2015. https://doi.org/10.1109/ACCESS.2015.2497970
- R. He, W. Chen, B. Ai, A.F. Molisch, W. Wang, Z. Zhong, J. Yu, S. San- godoyin, ”On the clustering of radio channel impulse responses using sparsity- based methods,” IEEE Trans. Antennas Propag., 64(6), 2465–2474, 2016. https://doi.org/10.1109/TAP.2016.2546953
- R. He, Q. Li, B. Ai, Y. Geng, A. Molisch, V. Kristem, Z. Zhong, J. Yu, ”A kernel-power-density-based algorithm for channel multipath compo- nents clustering,” IEEE Trans. Wireless Commun., 16(11), 7138–7151, 2017. https://doi.org/10.1109/TWC.2017.2740206
- Y. Li, J. Zhang, Z. Ma, Y. Zhang, ”Clustering analysis in the wireless propa- gation channel with a variational Gaussian mixture model,” IEEE Trans. Big Data, 6(2), 223–232, 2020. https://doi.org/10.1109/TBDATA.2018.2840696
- H. Xue, L. Tian, Y. Zhang, C. Wang, J. Zhang, W. Li, H. Wei, ”A Novel Clustering Method Based on Density Peaks and Its Validation by Channel Measurement,” in Proceedings 12th European Conference on Antennas and Propagation, 1–5, 2018. https://doi.org/10.1049/cp.2018.0700
- D. Abinoja, L. Materum, ”Evaluation of techniques for identifying multipath propagation clusters in wireless systems by Bayesian information criterion model-based clustering,” Lecture Notes Adv. Res. Eng. Inf. Technol. 1, 97–102, 2019.
- A. Teologo, L. Materum, ”Cluster-wise Jaccard accuracy of Kpower means on multipath datasets,” Int. J. Emerg. Trends Eng. Res., 7(8), 203–208, 2019. https://doi.org/10.30534/ijeter/2019/16782019
- O. Bialer, N. Garnett, D. Levi, ”A Deep Neural Network Approach for Time-Of-Arrival Estimation in Multipath Channels,” in IEEE International Conference on Acoustics, Speech, and Signal Processing, 2936–2940, 2018. https://doi.org/10.1109/ICASSP.2018.8461301
- A. Abdallah, Z. Kassas, ”Deep Learning-Aided Spatial Discrimination for Mul- tipath Mitigation,” in IEEE/ION Position, Location and Navigation Symposium, 1324–1335, 2020. https://doi.org/10.30534/ijeter/2019/16782019
- J. Blanza, L. Materum, ”Grouping of COST 2100 indoor multipaths using simultaneous clustering and model selection,” Int. J. Emerg. Trends Eng. Res., 7(8), 197–202, 2019. https://doi.org/10.30534/ijeter/2019/15782019
- J. Blanza, L. Materum, ”Wireless propagation multipath clustering: On simultaneously solving the membership and the number of clus- ters,” Int. J. Adv. Trends Comput. Sci. Eng., 8(5), 1914–1919, 2019. https://doi.org/10.30534/ijatcse/2019/15852019
- J. Blanza, L. Materum, ”Joint identification of the clustering and cardinality of wireless propagation multipaths,” Int. J. Emerg. Trends Eng. Res., 7(12), 762–767, 2019. https://doi.org/10.30534/ijeter/2019/057122019
- J. Blanza, L. Materum, T. Hirano, ”Deep divergence-based clustering of wireless multipaths for simultaneously addressing the grouping and the cardinality,” Int. J. Emerg. Trends Eng. Res., 8(7), 3104–3110, 2020. https://doi.org/10.30534/ijeter/2020/37872020
- Z. Li, L. Cheong, S. Yang, K. Toh, ”Simultaneous clustering and model selec- tion: Algorithm, theory and applications,” IEEE Trans. Pattern Anal. Mach. In- tell., 40(8), 1964—1978, 2018. https://doi.org/10.1109/TPAMI.2017.2739147
- M. Kampffmeyer, S. Løkse, F. M. Bianchi, L. Livi, A.-B. Salberg, R. Jenssen, ”Deep divergence-based approach to clustering,” Neural Netw., 113, 91–101, 2019. https://doi.org/10.1016/j.neunet.2019.01.015
- J. Blanza, A. Teologo, L. Materum, ”Datasets for Multipath Clustering at 285 MHz and 5.3 GHz Bands Based on COST 2100 MIMO Channel Model,” in 9th International Symposium on Multimedia and Communication Technology, 1–5, 2019. https://doi.org/10.1109/ISMAC.2019.8836143
- J. Blanza, A. Teologo, L. Materum, ”Datasets for Multipath Clustering at 285 MHz and 5.3 GHz Bands Based on COST 2100 MIMO Channel Model,” 2019. [Online]. Available: http://dx.doi.org/10.21227/4cb9-hf81
- C. Wu, M. Hamada, Experiments: Planning, Analysis, and Parameter Design Optimization, USA, Willey, John & Sons Incorporated, 2000.
- J. Neter, M. Kutner, C. Nachtsheim, W. Wasserman, Applied Linear Statistical Models 4th ed., Irwin Press, 1996.
- J. Poutanen, ”Geometry-based Radio Channel Modeling: Propagation Analysis and Concept Development,” Ph.D Thesis, Aalto University School of Electrical
Engineering, 2011.