Reliability Improvement of Radial Distribution System by Reconfiguration
 , Gulshan Sharma 2, Girish Ganesan. R 3, Tomonobu Senjyu 3
Adv. Sci. Technol. Eng. Syst. J. 5(6), 472–480 (2020);
 DOI: 10.25046/aj050656
In a radial distribution system, component failure leads to service interruption and subsequent disconnection of a few load points. An abnormal variation in the voltage levels and high power loss gives rise to reliability issues. In this work, feeder reconfiguration is performed to improve reliability, minimize voltage deviation and power loss. A Binary Particle Swarm Optimization based search function handles the reconfiguration. The goal of this search function is to identify the optimal tie switches which minimize the multi-objective function. The search algorithm based on Binary Particle Swarm Optimization is utilized to handle the reconfiguration which identifies the optimal tie switches for minimizing the multi-objective function. The effect of the various algorith parameters on the convergence rate is studied. The proposed algorithm has been tested on Standard IEEE 33 and 69 test systems and the obtained results show a boost in the system reliability.
1. Introduction
Electric distribution system (EDS) are exponentially evolving due to the increasing demand and the changing sensitivity of customers loads. An interruption in electric power supply to the customers is caused by many events such as equipment failure, faults at substations, trees and much more. These interruptions cause a severe impact in the load equipment apart from the obvious financial losses and inconvenience. It is proclaimed that the failures in the distribution system causes nearly 80% of the interruptions. The customers of the electric utility desires an interruption free reliable power supply at the end of the day, emphasizing the need for calculating the reliability of EDS.
Reconfiguration is opening and closing of sectionalizing and tie switches. The former is normally closed whereas the latter is normally open switches. The alteration of the status of the switches under normal conditions or during contingencies results in change in topology of the feeders. It reduces the cost of implementation of various protective devices while satisfying the constraints such as maintaining radial condition of the system and feeding all the buses. It has become a practice nowadays to implement distributed generators along with reconfiguration to obtain better results [1]-[3]. But implementing Distributed Generation (DG) increases the overall cost of the EDS. Implementing reconfiguration will ensure that the customer does not face outages by rerouting the required power thereby enhancing reliability of the system. Voltage fluctuation of can be endured only for a brief stretch. If not, the impairment instigated in the equipment connected to the EDS would be high [4]. So reconfiguration is used to maintain the same within limits. Reconfiguration contributes to proper distribution of load and hence lower magnitude of current in the branches thereby reducing the power loss. This increases the loadability of the feeder thus contributing to the enhancement of reliability of the system.
There are several documented ways to solve for the optimal system reconfiguration, namely, heuristic, meta-heuristic and deterministic methods. Deterministic models hold no uncertainity and the output only depends on the intial state of the system and the value of the system parameters. Heuristic techniques are often greedy algorithms pursuing a local optimum instead of a global optimum even though they are problem dependent. Meta-heuristic approaches are independent of the problem and not greedy, allowing them to perform and in-depth search of the workspace to get an optimum solution. In most cases, the parameters of interest are power loss, voltage profile and reliability. From the extensive literature cited in this work it is seen that employing meta-heuristic methods are techniques has been a recent trend in the research field.
In [5]-[14] an objective function has been developed consisting of both reliability indices and loss in models with and without a DG while [15]-[18] involve loss reduction and voltage profile improvement. Since 1980, Genetic algorithm(GA) which is classified as an evolutionary algorithms is widely used as an optimization tool [5], [8], [19] and [20]. But it is a slow algorithm [19] as it requires decent sized population and a number of generations to see good results whereas Particle Swarm Optimzation (PSO) entails small quantity of ciphering time not counting the better accuracy in results in contrast to GA. In [8] an Enhanced GA is presented that can resolve the reconfiguration of the feeder proficiently and sturdily with fewer iteration and time. A novel Micro genetic algorithm with reduced number of efficient solution which works well for multi-objective functions is presented in [6].
The technique shown in [7] adopts an Analytic Hierarchy Process for decision making with multiple criteria analysis. In the work presented in [9], Dynamic programming is used to find minimal cutsets and a search based technique for reconfiguration to attain the ideal set of switches has been articulated for RDS using DG. In [11] reconfiguration is solved using a novel Imperialist Competitive Algorithm which intensifies the exploration ability.In [14] the randomness in the reliability data is taken into account and has
introduced a robust approach. In [3] a CRO algorithm to deal with complex network reconfiguration with DG present is taken. Different versions of Particle Swarm Optimization (PSO) is used in [10], [15], [17], [19], [21]–[24] where [15] and [23] takes another step by hybridizing PSO with Ant Colony Optimization and Evolutionary Programming respectively, for reconfiguration for various objectives. This algorithm provides better results faster in comparison to the other algorithms.
The contribution of this paper is the enhancement of reliability indices by performing an optimal reconfiguration of the distribution system using a modified version of PSO. The objective function involves minimization of Reliability index SAIDI, Voltage Deviation and Power loss. Four other reliability indices are calculated as well. The influence of certain parameters in PSO are determined using a MATLAB simulation environment and the results prove the validity of the proposed concept.
2. Problem Formulation
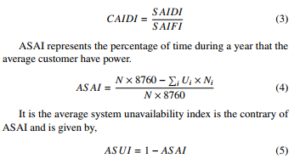
Reliability is the ability of a distribution system to provide uninterrupted power supply to customer [25]. Reliability indices are the benchmark parameters for evaluating reliability of the distribution system and performance of the utility. There are five standard reliability performance indices: System Average Interruption Frequency Index (SAIFI), System Average Interruption Duration Index (SAIDI), Customer Average Interruption Duration Index (CAIDI),
Average System Availability Index (ASAI) and Average System Unavailability Index (ASUI) which are briefed below.
2.1. Reliability Indices
SAIFI is the average frequency of interrupt occurences that a customer experiences,
![]()
Ni
where, λi – failure rate(failure/year) of ith load point Ni – Number of customers at point i.
SAIDI is the average duration of interrupt a customer experiences,
![]()
Ui – product of failure rate and repair rate of ith load point.
Failure rate (λi) and Repair rate (ri) are called load point indices and are calculated using Cutset Approach as the systen is a series-parallel system.
CAIDI is the average interruption time a consumer is affected by interruption per year. It is related to SAIFI and SAIDI indices.
S AIDI S AIFI
2.2. Voltage Deviation and Power Loss
A stable voltage profile alongside low power loss is important as it directly benefits the electric utility operation and subsequently increases customer satisfaction. For this reason, it is embedded into the objective function. Voltage deviation and power loss can be calculated as follows,
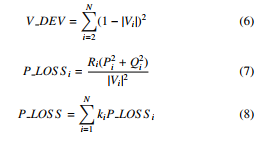
where,
P LOSS i is the power loss of branch i, P LOSS is the total power loss, Pi and Qi are the real power and reactive power of branch i, Ri and is the branch resistance, Vi is the voltage at bus i,
N is the total number of branches and ki is the status of branch i
(1=close, 0=open)
2.3. Constraints
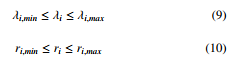
2.3.1. Failure and Repair rate constraints
![]()
![]()
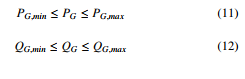
λi,min, ri,min, λi,max and ri,max are the limits of the values of failure and repair rate. PG,min and PG,max are the vectors of lowest and highest available real power generation whereas QG,min and QG,max are the vectors of lowest and highest available reactive power generation.
Vi,min and Vi,max are the limits of the branch voltages and ϕ(L) is the number of loops in the system.
2.4. Objective Function

As the objectives have different dimension they’re conveter to per-unit values. S AIDIT,V DEVT and P LOSS T are the initial case values of SAIDI, Voltage deviation and Power Loss respectively. Thus multiple objectives are unified into a single objective resulting in reduced optimization load. The system condition before reconfiguration is taken as the base.
3. Proposed Method
This section presents the basics of PSO and the formulation an intelligent search method depending on PSO. All the feasible configurations of the distribution system that satisfy the objective function is presented.
3.1. Particle Swarm Optimization
PSO is a meta heuristic population based technique with its genesis from the observation of social behaviour associated with birds flocking. It can be applied to both continuous and discrete systems. In the presented problem, the switches are chosen from a discrete set for different bus systems and therefore discrete PSO is applied in this case.
The algorithm develops a population of particles each of which are a viable solution for the problem. Initially each particle is assigned a random position, velocity and objective function, Xi, Vi and Fi respectively. The evaluation is carried out using positional coordinates and population size as the input. Each particle has a follow up of its position and the best value acquired so far and is stored in Pbest. . In the meantime the overall best value produced so far by any particle is stored as Gbest.
![]()
itermax
The interia of the particles has an impact on the future velocities of the particles. Experimentally it is observed that decreasing the value of inertia over the iterations causes exploration and exploitation to occur linearly. Number of particles in the swarm is represented by n. Smaller value takes large number of iterations to converge whereas high value cause a rise in computational complexity and time consumed. So a suitable value is chosen.
![]()
where, vtij – particle velocity xijt – particle position c1 – cognitive parameter
c2 – social parameter c1 and c2 represents the weights of the
stochastic acceleration term that pulls the particles towards Pbest and Gbest respectively.
r1 and r2 are random values in the range [0,1].
The particles coordinates are updated using the sigmoidal equation,
![]()
The ciel of the function converts the continuous to discrete values. It is further modified according to the problem at hand to choose the values from a particular set of values. In our work, the set of values corresponds to the switches that are to be opened for reconfiguration from the array of switches from each loop of the bus system if the tie lines are closed.
3.2. Algorithm
- Add Load bus data, line data maximum iterations and switch value matrix. Initialize population, position, random velocities, Pbest, Gbest.
- Calculate inertia, update velocity and particles coordinates.
- Check radiality constraint and calculate fitness. Power loss and voltage deviation are calculated from load flow solution. Reliability is calculated using the concept of cutsets.
Backward Forward Sweep Algorithm is used as the load flow solution.
- Update Pbest if the fitness function is lesser than the previous value.
- Update Gbest if the fitness function is lesser than the previous value.
- If there is no criteria match, update particle velocity using the previous velocity, distance to Pbest and distance to Gbest in the equation
- Update particle position from provided switches.
- Terminate if the maximum iterations is reached. Go to step 3.
The flowchat of the proposed algorithm is shown in Figure 1.
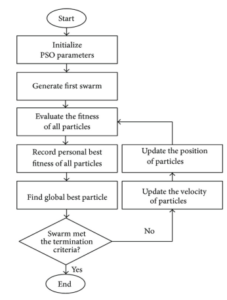
Figure 1: Flowchart of Proposed PSO
4. Results and Discussion
The IEEE 33 and 69 bus system data is presented in [10]. The failure rate and repair rate for the same is presented in [20]. The proposed method is implemented on the test cases and and the effectiveness is tested for the given objective function. Each load point is assumed to have one customer. Four different cases is made out of the objective function presented in Eq.15 with different weightage to each objective but with heighest weightage to SAIDI.
- Case 1: w1 = 1.0, w2 = 0 and w3 = 0
- Case 2: w1 = 0.75, w2 = 0 and w3 = 0.25
- Case 3: w1 = 0.75, w2 = 0.25 and w3 = 0
- Case 4: w1 = 0.5, w2 = 0.25 and w3 = 0.25
4.1. 33 Bus System
It has a voltage rating of 12.7kV with a constant power load of
(3.715 +j2.3) MVA. It is generally used to evaluvate the distribution reconfiguration problem. Figure 2 shows the single line diagram for a 33 bus system. In the base configuration, the solid lines represent the NC switches (1 through 32) and the dotted lines represed the NO switches (33 through 37).
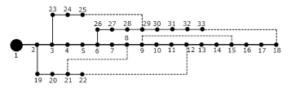
Figure 2: 33 bus system before reconfiguration
4.1.1. Case 1
The main objective of this case is to minimise the reliability index, SAIDI, which is used to find how reliable the system is. The algorithm is trained using this test case in order to find optimal solutions in the upcoming cases for the multi-objective function. For comparison purposes, the values of the indices of the base case is calculated.
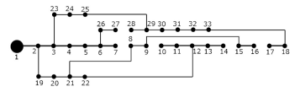
Figure 3: 33 bus system after reconfiguration (Case 1)
Figure 3 shows the bus system post reconfiguration. In this case a drop of 0.8769 p.u for duration index which is a 40% reduction from the original value making the system highly reliable. The
Table 1 shows the best possible values, wmin, wmax and population size. A value of population swarm between 40 and 50 reduces the convergence time. The fitness function converges in the 6th iteration when population is randomized and in the 8th iteration when inertia is randomized.
Table 1: PSO parameters – 33 bus system
| Parameter | Value |
| wmin | 0.2 |
| wmax | 0.9 |
| Population | 48 |
The Voltage deviation and power loss have shown a reduction of 24% and 55% for the reconfigured system even without giving weightage to the same as shown in Table 2. Power loss and voltage deviation has shown drastic reduction in its values in spite of not giving weightage to them in this case thus concluding on the fact that all the three objectives are interrelated.
4.1.2. Case 2
The values of the parameters, inertia weight (minimum and maximum) and population of the swarm, are fixed for cases 2, 3 and 4. From Table 2 it is clear that with a 0.5% sacrifice of SAIDI, the voltage deviation and power loss values have been lowered by additional 4% and 2% respectively in comparison with the results of case
- As shown in Figure 4 the system is radial post reconfiguration.
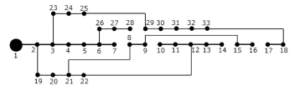
Figure 4: 33 bus system after reconfiguration (Case 2)
4.1.3. Case 3
It was found that the results of Case 3 is identical and hence the single line diagram is not repeated. The loss is reduced by an additional 4% when compared to case 1 while giving up only a 0.5% in SAIDI value with respect to case 1.
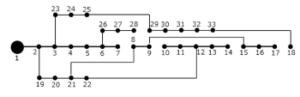
Figure 5: 33 bus system after reconfiguration (Case 4)
4.1.4. Case 4
It can be seen that a further reduction of 4kW power loss in comparison to the previous two cases. Voltage deviation has also reduced by an extra 2% when compared to the past two cases along with the betterment of minimum voltage in the system. Hence it is proved that the system is highly reliable with power loss and voltage deviation improved drastically. Figure 5 displays the bus system configuration after reconfiguration. Due to space issues, Voltage profile and Convergence graph of the final case is alone shown in Figure 6 and
7 to picturize the improvement in the voltage profile and the efficacy of the proposed method.
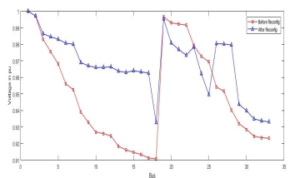
Figure 6: Voltage Profile pf 33 Bus System (Case 4)
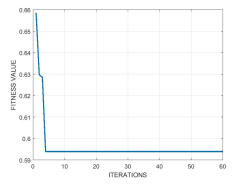
Figure 7: Convergence graph of 33 Bus System (Case 4)
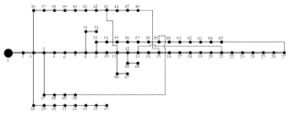
Figure 8: 69 bus system before reconfiguration
4.2. 69 Bus System
Table 2: Consolidated Results of 33 Bus System
|
The proposed topology is tested on a IEEE Standard 69 Bus system. This system has a rated voltage of 12.7kV.NO switches are 69 through 73 as in Figure 8. The reliability indices before reconfiguration are recorded by applying the algorithm to the base case of the 69 bus system. Other than the zero injection buses, each load point is assumed to have one customer. The Inertia and Population are randomized separately and run hundreds of iterations to arrive at the best values. The values obtained as shown in Table 3 further implicate that wmin, wmax should be chosen with a difference of 0.5 for accurate results and reaffirms that population value within [40,50] holds the best results.
4.2.1. Case 1
Apart from SAIFI and SAIDI other indices such as CAIDI, ASAI and ASUI are found for base case in order to compare the results of all the cases. The switches that are to be opened post reconfiguration are {14, 18, 56, 64, 69}. When the switches are compared with the failure and repair rate, it is found that the branches with maximum failure rate are opened so that the values of the indices drop according to the Eq. 1 and Eq. 2. Table 4 shows that there is a major cutback of 0.7431 p.u which is 28.8% for SAIFI and 0.3804 which is 22.28% for SAIDI. Values of all the indices are shown as well. The power loss and voltage deviation is determined for the reconfigured system. Loss before and after reconfiguration presents a substantial drop of 47.11%. Voltage deviation has reduced by 71.2%. Figure 9 represents the 69 bus system after reconfiguration maintaining radial topology and its load evened out.
4.2.2. Case 2
In this case duration and voltage deviation are optimized. SAIDI plummeted by a 21% while voltage deviation which was given a weightage of 0.25 in the objective function dropped by 2.49 p.u which is nearly 74% with respect to base improving the voltage profile substantially and thereby improving overall reliability of the power system. Power loss for the above configuration was 119.6465kW which an improvement from the previous case highlighting the impact of better voltage profile on power loss. Figure 10 represents the 69 bus system after reconfiguration maintaining radial topology.
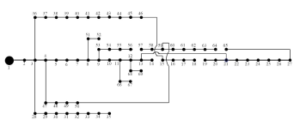
Figure 9: 69 bus system after reconfiguration (Case 1)
Table 3: PSO parameters – 69 bus system
| PARAMETER | VALUE |
| wmin | 0.2 |
| wmax | 0.7 |
| Population | 46 |
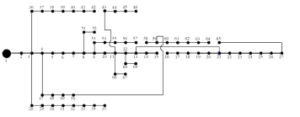
Figure 10: 69 bus system after reconfiguration (Case 2)
4.2.3. Case 3
This case involves optimizing SAIDI and Power loss with a weightage of 0.75 and 0.25 respectively. Table 4 shows the result after reconfiguration and it is found that loss has reduced to 106.7573kW even though SAIDI raised by a value of 0.04. The voltage deviation calculated after reconfiguration was 0.8958 which is just a 0.02 p.u rise while the loss has reduced considerably. The minimum value of voltage has improved due to minimized power loss. This helps the sensitive equipment from falling a prey for low voltage conditions and hence improves the reliability of the system. Figure 11 represents the 69 bus system after reconfiguration maintaining radial topology.
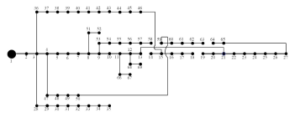
Figure 11: 69 bus system after reconfiguration (Case 3)
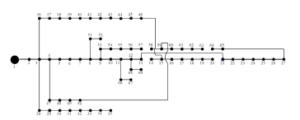
Figure 12: 69 bus system after reconfiguration (Case 4)
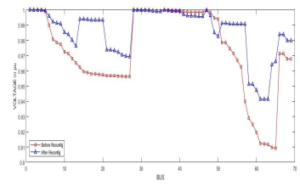
Figure 13: Voltage Profile of 69 Bus System (Case 4)
4.2.4 Case 4
This case includes all the three objectives with equal weightage to voltage deviation and power loss of 0.25 and reliability index SAIDI holding higher importance with weightage of 0.5. It is clearly seen from Table 4 that all three objective functions have their values reduced from case 3 giving us the best possible combination of switches under the above condition. The minimum voltage stays the same as previous case but overall voltage profile has improved. In comparison to the base case there is a drop of 20.4%, 73.45% and 52.57% in SAIDI, Voltage deviation and Power loss respectively as shown in Table 4. Figure 12 sketches the 69 Bus System with loads distributed and following the radial topology constraint. Figure 13 shows the pictorial representation of the improvement in voltage profile while Figure 14 supports the claim of high convergence rate in the proposed method.
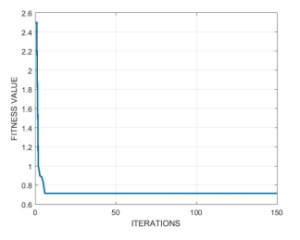
Figure 14: Convergence graph of 69 Bus System (Case 4)
5. Conclusion
This work presents a method for reliability improvement of Radial Distribution System through feeder reconfiguration. It is constructed based on Particle Swarm Optimization. The radial topology is conserved using the graph theory function in MATLAB. The load point indices such as failure rate and repair rate are calculated using Cutset concept. The reliability indices are calculated using theoretical formulae. Power loss and Voltage deviation is computed by utilizing Backward-Forward Sweep algorithm.
The Inertia weight and Population values in the proposed algorithm clearly influences the accuracy of the results and the time to taken to obtain the same as it regulates the exploration and exploitation of the search space.
In single objective function, the switch selection for reconfiguration solely depends on the values of the load point indices (λi & Ui) and hence switches with highest values of the indices are opened. This results in cutting down the number of load points in the longest branch and distributing them to other branches.
In multi objective function, the switch combination chosen not only depends on the failure rate and repair rate of the load points but also on the voltage and power loss. This results in minor increase in the SAIDI and other reliability indices but it improves the voltage profile aiding the loads connected the system. It takes some demand of the utility system due to reduced power losses.
Table 4: Consolidated Results of 69 Bus System |
- K. Jasthi, D. Das, “Simultaneous distribution system reconfiguration and DG sizing algorithm without load flow solution,” IET Generation, Transmission Distribution, 12(6), 1303–1313, 2018, doi:10.1049/iet-gtd.2017.0338.
- J. Wen, Y. Tan, L. Jiang, K. Lei, “Dynamic reconfiguration of distribution networks considering the real-time topology variation,” IET Generation, Trans- mission Distribution, 12(7), 1509–1517, 2018, doi:10.1049/iet-gtd.2017.1304.
- P. Sharma, N. Gupta, K. R. Niazi, A. Swarnkar, “Investigation of network reconfiguration on the reliability and performance of distribution systems using CRO,” in 2017 6th International Conference on Computer Applica- tions In Electrical Engineering-Recent Advances (CERA), 80–85, 2017, doi: 10.1109/CERA.2017.8343305.
- K. Muttaqi, A. Dt Le, G. Ledwich, M. Negnevitsky, “Minimising Voltage De- viation in Distribution Feeders by Optimising Size and Location of Distributed Generation,” Australian Journal of Electrical and Electronics Engineering, 3, 2007, doi:10.1080/1448837X.2007.11464155.
- M. M. Legha, M. Mohammadian, M. Darini, “Loss Reduction and Reliability Improvement with Optimization of DGs Placement Using Genetic Algorithm – A Case Study on the Electrical Distribution Network of North Kerman Area,” International Journal of Scientific & Engineering Research, 5(2), 2014.
- J. E. Mendoza, M. E. Lopez, C. A. C. Coello, E. A. Lopez, “Microgenetic mul- tiobjective reconfiguration algorithm considering power losses and reliability indices for medium voltage distribution network,” IET Generation, Transmis- sion Distribution, 3(9), 825–840, 2009, doi:10.1049/iet-gtd.2009.0009.
- A. P. C. Mello, D. P. Bernardon, L. L. Pfitscher, L. N. Canha, V. J. Gar- cia, M. Sperandio, “Reconfiguration of distribution network considering distributed generation and multivariables criteria,” in 2013 48th Interna- tional Universities’ Power Engineering Conference (UPEC), 1–6, 2013, doi: 10.1109/UPEC.2013.6714870.
- D.-L. Duan, X.-D. Ling, X.-Y. Wu, B. Zhong, “Reconfiguration of distribution network for loss reduction and reliability improvement based on an enhanced genetic algorithm,” International Journal of Electrical Power & Energy Systems, 64, 88 – 95, 2015, doi:https://doi.org/10.1016/j.ijepes.2014.07.036.
- P. Pavani, S. N. Singh, “Reconfiguration of radial distribution networks with distributed generation for reliability improvement and loss minimiza- tion,” in 2013 IEEE Power Energy Society General Meeting, 1–5, 2013, doi: 10.1109/PESMG.2013.6672876.
- S. Elsaiah, M. Benidris, Y. Tian, J. Mitra, “A Comprehensive Analysis of Reliability-oriented Optimal Distribution System Reconfiguration,” in 2018 IEEE Industry Applications Society Annual Meeting (IAS), 1–9, 2018, doi:10.1109/IAS.2018.8544624.
- M. Esmaili, M. Sedighizadeh, M. Mahmoodi, M., “Reconfiguration of distribu- tion systems to improve reliability and reduce power losses using Imperialist Competitive Algorithm,” Iranian Journal of Electrical and Electronic Engineer- ing, 13, 2017, doi:10.22068/IJEEE.13.3.6.
- A. Kavousi-Fard, M.-R. Akbari-Zadeh, “Reliability enhancement using opti- mal feeder reconfiguration,” Neurocomputing, 106, 1–11, 2013, doi:10.1016/j. neucom.2012.08.033.
- N. G. Paterakis, A. Mazza, S. F. Santos, O. Erdinc¸, G. Chicco, A. G. Bakirtzis, J. P. S. Catala˜o, “Multi-Objective Reconfiguration of Radial Distribution Sys- tems Using Reliability Indices,” IEEE Transactions on Power Systems, 31(2), 1048–1062, 2016, doi:10.1109/TPWRS.2015.2425801.
- J. C. Lo´pez, M. Lavorato, J. F. Franco, M. J. Rider, “Robust optimisation applied to the reconfiguration of distribution systems with reliability con- straints,” IET Generation, Transmission Distribution, 10(4), 917–927, 2016, doi:10.1049/iet-gtd.2015.0558.
- M. Amin Heidari, “Optimal network reconfiguration in distribution system for loss reduction and voltage-profile improvement using hybrid algorithm of PSO and ACO,” CIRED – Open Access Proceedings Journal, 2017(1), 2458–2461, 2017, doi:10.1049/oap-cired.2017.1007.
- I. A. Quadri, S. Bhowmick, D. Joshi, “Multi-objective approach to maximise loadability of distribution networks by simultaneous reconfiguration and allo- cation of distributed energy resources,” IET Generation, Transmission Distri- bution, 12(21), 5700–5712, 2018, doi:10.1049/iet-gtd.2018.5618.
- S. R. Tuladhar, J. G. Singh, W. Ongsakul, “Multi-objective approach for distri- bution network reconfiguration with optimal DG power factor using NSPSO,” IET Generation, Transmission Distribution, 10(12), 2842–2851, 2016, doi: 10.1049/iet-gtd.2015.0587.
- Z. Gong, Q. Chen, K. Sun, “Novel methodology solving distribution network reconfiguration with DG placement,” The Journal of Engineering, 2019(16), 1668–1674, 2019, doi:10.1049/joe.2018.8521.
- B. Vasudevan, K. Sinha, A., “Reliability improvement of reconfigurable distri- bution system using GA and PSO,” Electrical Engineering, 100, 1–13, 2017, doi:10.1007/s00202-017-0580-9.
- N. Gupta, A. Swarnkar, K. R. Niazi, “Distribution network reconfiguration for power quality and reliability improvement using Genetic Algorithms,” Inter- national Journal of Electrical Power & Energy Systems, 54, 664 – 671, 2014, doi:https://doi.org/10.1016/j.ijepes.2013.08.016.
- S. Elsaiah, M. Benidris, J. Mitra, “Reliability improvement of power distribu- tion system through feeder reconfiguration,” in 2014 International Conference on Probabilistic Methods Applied to Power Systems (PMAPS), 1–6, 2014, doi:10.1109/PMAPS.2014.6960676.
- K. B. Kela, L. D. Arya, “Reliability Optimization of Radial Distribution Sys- tems Employing Differential Evolution and Bare Bones Particle Swarm Op- timization,” Journal of The Institution of Engineers (India): Series B, 95, 231–239, 2014, doi:10.1007/s40031-014-0094-z.
- M. F. Sulaima, N. H. Shamsudin, H. I. Jaafar, W. M. Dahalan, H. Mokhlis, “A DNR and DG Sizing Simultaneously by Using EPSO,” in 2014 5th Interna- tional Conference on Intelligent Systems, Modelling and Simulation, 405–410, 2014, doi:10.1109/ISMS.2014.75.
- I. I. Atteya, H. Ashour, N. Fahmi, D. Strickland, “Radial distribution network reconfiguration for power losses reduction using a modified particle swarm op- timisation,” CIRED – Open Access Proceedings Journal, 2017(1), 2505–2508, 2017, doi:10.1049/oap-cired.2017.1286.
- P. C. Sekhar, R. A. Deshpande, V. Sankar, “Evaluation and improvement of reli- ability indices of electrical power distribution system,” in 2016 National Power Systems Conference (NPSC), 1–6, 2016, doi:10.1109/NPSC.2016.7858838.
No related articles were found.