Extending the Classifier Algorithms in Machine Learning to Improve the Performance in Spoken Language Understanding Systems Under Deficient Training Data

Adv. Sci. Technol. Eng. Syst. J. 5(6), 464–471 (2020);
 DOI: 10.25046/aj050655
One of the open domain challenges for Spoken Dialogue System (SDS) is to maintain a natural conversation for rarely visited domain i.e. domain with fewer data. Spoken Language Understanding (SLU) is a component of SDS that converts user utterance into a semantic form that a computer can understand. If we scale SDS open domain challenge to SLU then it should be able to convert user utterance to a semantic form even if less data is available for the rarest visited domain. The SLU reported in literature incorporate classifiers for the task of identifying the domain of user utterance, understanding the intent of the user, and filling slots-value pair. Thus, to address open domain challenges, classifiers in SLU must be robust to scarce training data. This paper presents investigations to improve the performance of SLU to convert user utterance into semantic form even if less training data is available. Eleven classification algorithms from machine learning have experimented under deficient data. The evaluation matrices used are accuracy, f-score, and inter cross-entropy. Comprehensive experimentation is carried out on the two publicly available datasets DSTC2 and DSTC3 were carried out.The accuracy for Support Vector Machine (SVM) , Stochastic Gradient Descent (SGD) and Decision tree are 0.940, 0.960 , 0.955 for DSTC2 and 0.916, 0.900, 0.901 for DSTC3 database respectively. The F-score for SVM, SGD and Decision tree are 0.855, 0.868, 0.849 for DSTC2 dataset and 0.725, 0.715, 0.700 for DSTC3 database, respectively. The ICE for SVM and SGD are 1.191,1.100 for DSTC2 dataset and 3.180,2.999 for DSTC3 database, respectively. The performance of SLU based on SVM and SGD was found to be the best among all. The worst performance in terms of all three evaluation metrics was displayed by SLU incorporating Automatic Relevance Determination (ARD) and Relevance Vector Machine (RVC) classifier.
1. Introduction
Spoken Dialogue System (SDS) interacts with the user in the most natural form of communication. It helps the user to achieve a goal through a series of interactions. SDS is moving to the open domain now. In the open domain, SDS has to maintain natural conversation even if data are scarce. Recently a lot of work is reported in the literature for open-domain Spoken Language Understanding (SLU) where it should be able to convert user utterance to semantic form even if less data is available. SLU reported in literature incorporates classifiers at different levels. The first level classifier in SLU will classify utterance to a domain example restaurant, flight booking, and tourist information. The next level classifier will classify user intend within domain example for example finding a restaurant or flight.
Subsequent levels in SLU should fill the slots such as time, date, etc. Filling slots will allow the flow of conversation to achieve the user goal. Thus, the robustness of the classifier to infer the output even if training data is less is important. There is a need for investigation of the robust classifier for SLU, which can convert user utterance to semantic form even if less training data is available. The work in the paper investigates a robust classifier. This research is broadening of work initially reported in the conference paper [1] The work is extended by incorporating CNN for feature extraction and investigating eleven classifiers from literature. Comprehensive experimentation was done on the DSTC2 dataset and the DSTC3 dataset. The evaluation was done on two domain datasets. DSTC2 datasets for the restaurant domain and DSTC3 datasets for the tourist domain were used for evaluation.
Classification is an important task in many applications as image processing, spoken dialogue systems, etc. Choosing the right classifier for an application is a very important task. A lot of work is reported in the literature for investigating a robust classifier for a particular application. The work [2] has predicted error rates of k-neighborhood, SVM, and decision tree classifiers for the application of computer-aided diagnostic (CAD). The evaluation of the classifiers is done on a small training set. Later the work was extended to three tasks in CAD. The task was detecting cancer, identifying high or low-grade and-later the work was extended by adding more features [3] Another work investigates classifiers for text classification [4] The Paper investigates Rocchio Classification, K Nearest Neighbor, Naïve Bayes Classification, SVM Classification, and Regression-Based Classification for the task of classifying text. The paper concludes with a study stating that the right choice of dimension reduction algorithm and classifier can improve the performance of text classification. One more paper [5] refers to the classifier investigation for the task of text classification under limited data. A naive Bayes classifier is also investigated for text classification [6] The work combines the dimension reduction method with a classification algorithm for text classification under limited training data. The study was reported in [7] Paper [8] tackles the issue of imbalance data under training data. They tackle the issue by a stable space for testing data proposed using a metric algorithm. The effect of training size on the neural network classifier is also demonstrated in the literature [9] Recently a work [10] reported classifiers for clinical treatment. The study also includes data augmentation techniques along with classifiers Thus, a lot of classification algorithm investigation for different applications is done. This paper investigates a robust classifier for the slot filling task of SDS.
To improve SLU’s performance for classifying utterance to predefined slots, different classification algorithms from machine learning were investigated. The purpose of the work is to:
1) Extend a robust classifier algorithm in machine learning to the semantic decoder in spoken language understanding for the task of converting user utterance into a semantic form of dialogue act and slot-value pair.
2) To demonstrate the impact of data scarcity on SLU incorporating different classifiers.
3) Comprehensive experiment on SLU incorporating eleven classifiers on two public datasets DSTC2 and DSTC3. The metrics used for evaluation are accuracy, f-score, and item cross-entropy.
2. Related Background
2.1. Decision Tree [DT]
DT is a popular classifier and is used in various machine learning applications such as data mining, image processing, statistics, etc. It uses if and then rules and follow the top-down method. In paper [11] decision tree is used for mining applications. A decision tree is used to extract information from huge data. Another work discusses the framework for decision tree algorithm, splitting criteria, and pruning methods [12] The paper also discusses extended decision trees such as obvious tree s decision trees, incremental tree, tree inducers, and fuzzy trees. A decision is also used as an inductive inference system [13] The decision tree algorithm consists of a set of rules called a decision. It extracts knowledge from example. Thus, it resembles the machine learning principle of learning from examples. In a research work presented in paper [14], the IDA decision algorithm is proposed. The ID3 decision algorithm is also discussed and compared with IDA.ID3 algorithm uses entropy for finding the uncertainty of classification output. While IDA uses divergence for classification. As reflected in the results, the IDA algorithm performance displays its effectiveness over ID3. Another paper [15] proposes an improved ID3 algorithm. It incorporates the Taylor series in ID3 to improve the classifier. One of the popular applications of the decision tree is data mining [16]
2.2. Multilayer Perceptron [MLP]
One of the most powerful classifiers used in machine learning is the MLP classifier. It uses a supervised learning and feedforward network. One of the applications reported for MLP is for recognizing a number in the Bengali language [17] For numbers recognizing pre-processing techniques such as feature, the selection is also incorporated. Another application reported is for the inference of liver cirrhosis [18] However, it is very difficult to tune the parameter of a multilayer perceptron. To overcome this difficulty a methodology is proposed in the paper [19] The methodology can find the number of epochs to get the best performance which is optimal.
2.3. Gaussian naïve Bayes
Gaussian naive Bayes classifier is a probabilistic classifier applied to many applications. Bayes theorem is used for classification. One application is discussed in [20] for breast cancer classification. A framework consisting of data pre-processing, feature selection, and classifier is proposed for breast cancer classification.
2.4. Gaussian classifier
Gaussian classifiers are used in many applications such as language identification [21], spectrum recognition [22] and dialogue representation [23] The work in paper [24] discusses the parametric Gaussian classifier. In this work, a Gaussian classifier incorporating a neural network is discussed. The results demonstrate the effectiveness of the parametric approach applied to Gaussian distribution. The Gaussian classifier is also analyzed for limited training data [25] The work discusses the impact of limited data on the decision boundary of a classifier.
2.5. AdaBoost classifier
In literature AdaBoost are used for detecting objects[26] ,detecting faults in gearbox [27] and detecting hands [28] In another paper, AdaBoost is used in mobile intelligent terminals for security level classification [29] Various modified AdaBoost algorithms are were analyzed for classification margin[30] Further, in the same paper, generalized error for eight variants of AdaBoost was reported. Personalized AdaBoost which is a variant of AdaBoost as reported in the paper has the least generalization error
2.6. Relevance vector machine
Relevance vector machine (RVM) is a probabilistic model used for classification and regression. The prediction of the output of RVM is probabilistic. RVM is used for the classification of hyperspectral images using wavelet kernel [31] As reported in the paper, training speed was improved by RVC incorporating wavelet kernel. Another application was reported for RVM for the detection of clustering in mammogram [32] For mammogram classification, RVM was able to maintain better classification with less computation complexity
2.7. Stochastic gradient (SGD)
It is a linear classifier that incorporates SGD learning. These classifiers are used in classifying emotions in Hindi text [33] In the Hindi emotion classification model, first pos tagging is done on the text and then features are extracted from the text. Extracted features are used to train the SGD classifier or random forest classifier. The results were improved by incorporating reduced features to SGD. Another application for SGD in literature is for the categorization of Bangla text [34] The results for Bangla text classification was improved using SGD.
2.8. Support Vector Machine [SVM]
It is a linear non-probabilistic classifier. It uses Platt’s model to predict the output. One of the applications in literature is big data automated selection [35] The quality of data affects the classification performance of SVM. Results in the paper showed that optimizing the SVM parameter can improve the performance. SVM is also used for skin disease classification [36] In this work, the Image was flattened to get an array of pixel intensities. This array of labeled data was used to train SVM. Recently SVM using field programmable gate array is used for knowledge discovery.
2.9. K-nearest neighborhood [KNN]
It is a supervised classifier based on distance measurement. It is widely applied to data mining for the classification task.In recent work[37], KNN is used for saving energy for the home. KNN is used here for appliance classification. The KNN classifiers were able to detect home appliances in a short time. Lot variants of KNN such as dynamic KNN, weight-adjusted KNN and distance weighted KNN are proposed to speed up the learning process [38]
2.10. Random Forest [RF]
It is an algorithm based on a decision tree. In a paper [39], RF is used for Android malware detection applications. The framework proposed in the paper was evaluated on the android feature dataset. RF was used for the classification task of identifying applications as benign or malicious. Misclassification error for classifying malware was least for the random forest. Recently in a paper, RF is used for identifying and classifying applications for network traffic detection. The algorithm used for comparison were random forest, SVM, and logistic regression. RF outperformed all the classifiers in terms of accuracy and f-score.
2.11. Variational Relevance Vector Machine [VRVM]
A variant of RVM is proposed in paper [40] known as variational relevance vector machine. This method is RVM with variational inference. VRVM is applied for RVM multi-dimension array classification. Another application for VRVM is discussed in the literature for the classification of table data such as blocks of image [41] VRVM was found more robust then RVM.
3. Block diagram of SLU
SLU is an important component of the SDS system which converts user utterance to a semantic form consisting of dialogue act and slot value pair. Figure 1 shows the block diagram of SLU.
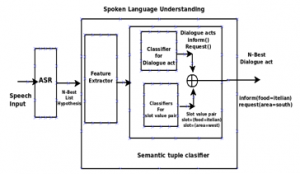
Figure 1: Structure of SLU
SLU plays a very important role in understanding user intent. User utterance is given to the Automatic Speech Recognition (ASR) system which converts speech into text form. The text input is given to SLU. It extracts features from text utterance. The features are fed to a set of classifiers to extract dialogue act and slot-value pair from features. The dialogue act and slot-value pair are combined to form a semantic representation of user utterance. Semantic representation is further analyzed to understand user utterance.
4. Implementation of SLU
Figure 2 represents a semantic tuple classifier for the task of semantic classification which is described in the paper [42]

Figure 2: SLU incorporating classifiers for dialogue act and slot-value pair
The speech input is given to ASR. The ASR converts speech input to text form which is the N-best list. The features are extracted from the text. The feature extraction method in paper [42] is extended by incorporating CNN. The deep extracted feature is fed to the classifier. The first classifier classifies user utterance to dialogue act such as to inform (), request (), and bye (). This will help to understand the goal of the user. The next set of classifier identifies the slot-value pair for user utterance. The semantic form of user utterance consists of dialogue act and slot- value pair. Next, eleven classifiers from machine learning are investigated for dialogue act classification and to find slot–value pair. The classifiers investigated on SLU are support vector machine, stochastic gradient descent classifier, AdaBoost classifier, decision tree, relevance vector classifier, random forest, k-nearest neighbor classifier, multi-layer perceptron classifier, automatic relevance determination classifier, Gaussian naive Bayes classifier, and variational relevance vector machine. The experimentation was performed with a different amount of training data. The performance of SLU was studied and compared incorporating different classifiers under limited training data on DSTC2 and DSTC3 databases. The experimentation for measuring robustness on limited training data was conducted by training the model on 25% training data and then testing the model on entire testing data. Later experimentation was repeated for 50% training data, 75% of training data, and 100% training data. The evaluation was done on metric Inter Cross-Entropy (ICE), accuracy, and F-score.
5. Results and Discussion
5.1. Datasets
Experimentation is done on two public datasets DSTC2 and DSTC3. The DSTC2 dataset for the restaurant domain. It consists of 1765 dialogues for training data, 441 validation data and 1117 dialogue for testing data. The DSTC3 dataset is for the tourist domain. It consists of a total of 2265 dialogues. The training data used for the experiment is 1265 dialogues and 250 dialogues for validation. The testing data for the experiment is 750 dialogues.
5.2. Evaluation metrics
The framework is evaluated with three metrics: Inter Cross-Entropy (ICE), accuracy, and F-score. The ICE is cross-entropy between the probability density from the confidence and the optimal density given by delta functions at the correct values [43] In the paper, it was demonstrated ICE gives a consistent performance ranking for both the confidence scores and the overall correctness of the system. A lower ICE metric indicates good dialogue confidence performance. Accuracy and F-score are in range 0 to 1 and higher values indicate good performance. ICE metric is highly correlated with the performance of SDS. Accuracy and F-score will reflect the performance of the SLU model. Thus for the evaluation of model in the experiment is done with ICE, f-score, and accuracy.
5.3 Baseline Method
The framework used for experimentation is an extension of the semantic decoder [42] The decoder is extended by incorporating CNN for feature extraction. The extended framework experimented with incorporating eleven different classifiers from machine learning. The framework was evaluated on DSTC2 and DSTC3 datasets. The framework was also investigated for robustness for less training data.
5.4 Experimental setting 1
The first set of experimentation was carried out on the DSTC2 dataset. The experiment was conducted on a deep semantic decoder by incorporating 11 different classifiers. For each classifier, the robustness was evaluated by training the model with different quantity of training data and then testing using the entire set. The different quantity of training data was 1765 dialogues (100% training data), 1323 dialogues (75% data), 882 dialogues (50% training data), and 441 dialogues (25% training data). Testing of SLU for all different quantity of training data was done on 1117 testing dialogues. The classifiers investigated on SLU are SVM, SGD, AdaBoost, DT, RVC, MLP, RF, k-neighbourhood, ARD, Gaussian naive Bayes, and VRVM.
Figure 3: ICE for a model trained on 25% training data, 50% training data, 75% training data, and 100% DSTC 2 training data.
Figure 3 shows the experimental results for ICE measured on the dSTC2 dataset for different quantity of training data. Results show ICE is directly proportional to training data. Almost all classifier ICE was high when training data was less. This indicates the overall quality of distribution was least for 20% of training data and most when 100% training data. Their set of classifiers displaying the best performance are SVM, SGD, and VRVM at 100% data. SVM and SGD displayed the least variation in ICE at the different quantity of training data. The variation in VRVM and MLP was most for different quantity of training data. The set of classifiers displaying the worst performance are ARD, RVC, and MLP. The classifier which had an overall good performance for all quantity of training data and full data is SGD.
The testing accuracy results of the experiment on the DSTC2 dataset are shown in Figure 4. The measurement accuracy is for correct classification of user utterance to semantic form consisting of dialogue act and slot value pair. The classifiers whose topmost semantic hypothesis was correct are SVM, VRVM, decision tree, and SGD. These classifiers were also able to predict the semantic hypothesis for testing data even if the training data was less. VRVM was not able to maintain its performance for limited training data. Thus SVM, decision tree, and SGD were able to maintain its performance even if training data was scarce. The classifiers displaying the least performance are ARD, RVC, and random forest. The VRVM’s testing accuracy measured for 20% training data is 0.827 and for training 100% data it is 0.939. Thus, it is not able to maintain its performance under a scarcity of data. Similarly, MLP and k– neighborhood classifiers were also not able to maintain its performance under data scarceness.

Figure 4: Testing data accuracy for a model trained on 25% training data, 50% training data, 75% training data, and 100% DSTC 2 training data.
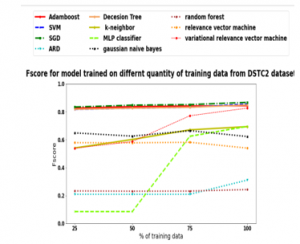
Figure 5: Testing data F-score for a model trained on 25% training data, 50% training data, 75% training data, and 100% DSTC 2 training data.
F-score for testing data DSTC2 is presented in Figure.5. A high value of the F-score will indicate a low false-negative and positive value of the semantic hypothesis. A high F-score was displayed by SLU incorporating Decision Tree, SVM, VRVM, and SGD. SLU’s robustness for limited data was increased with these classifiers. VRVM again failed to show robustness for limited data. Low F-score was displayed by random forest and RVC. SLU incorporating MLP also had a lot of variation in F-score for different quantity of training data.
5.5. Experimental setting 2
The second set of experiments was carried out on DSTC3. The different quantity of training data was 1265 dialogues (100% training data), 925 dialogues (75% training data), 600 dialogues (50% training data), and 300 dialogues (25% training data). The testing data consist of 750 dialogues. The eleven classifiers included in an experiment setting 1 is also included in experiment setting 2 as well.

Figure 6: ICE for a model trained on 25% training data, 50% training data, 75% training data, and 100% DSTC 3 training data.
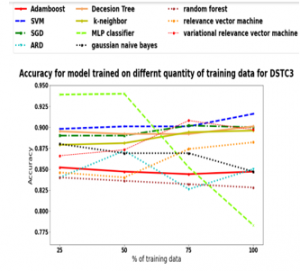
Figure 7: Testing data accuracy for a model trained on 25% training data, 50% training data, 75% training data, and 100% DSTC 3 training data
Figure 6 shows the ICE readings for the different quantity of training data for DSTC3 datasets. The results are similar as found for the DSTC2 experiment. The SLU incorporating the set of classifiers displaying good results are SVM, SGD, and VRVM. Variation in ICE for different quantity of training data was minimum for SVM and SGD. Variation in ICE was more in VRVM. The SLU incorporating a set of classifiers displaying the worst results are ARD, RVC, and RF. The maximum variation in ICE was displayed by MLP, RVC, and K-neighbourhood.
Testing accuracy for the SLU model for different quantity of training data for the DSTC3 dataset is shown in Figure 7. Again, the results are in line with DSTC2 results. The classifiers which were able to classify user utterance to semantic form most accurately were SVM, SGD, and decision tree. The classifiers performing well under data scarcity are SVM, SGD, and decision tree. The worst performance in terms of data scarcity was showed by the MLP classifier. In terms of accuracy worst performance was shown by ARD, RF, and RVC.

Figure 8: Testing data F-score for a model trained on 25% training data, 50% training data, 75% training data, and 100% DSTC 3 training data.
The results for SLU model performance on the DSTC3 dataset are shown in Figure 8. The results are again similar to the DSTC2 dataset. F-score was high for SLU when incorporated SGD, SVM, VRVM, and decision tree. Low F-score was displayed by SLU when incorporated RVC, RF, and ARD.
Variation in ICE for SGD and SVM when SLU is trained for least and highest train data is 0.296 and 0.209 for the DSTC2 dataset and 0.190 and 0.190 for the DSTC3 dataset, respectively. The least variation in ICE was found for SVM and SGD. Thus, the set of classifiers showing robustness under limited training data for ICE metrics are SVM and SGD. Variation in ICE for MLP and Gaussian naive Bayes when SLU is trained for least and highest train data is 1.95 and 1.45 for DSTC2 and 2.251 and 0.18 for DSTC3 dataset, respectively. The highest variation in ICE was found for MLP and Gaussian naive Bayes. Thus set of classifiers showing the worst result for ICE are MLP and Gaussian naive Bayes.
Table 1: Results on DSTC2 dataset
| S.No | Classifier | ICE | Accuracy | F-score |
| 1 | Adamboost | 1.861 | 0.863 | 0.848 |
| 2 | SVM | 1.191 | 0.940 | 0.855 |
| 3 | SGD | 1.100 | 0.960 | 0.868 |
| 4 | ARD | 4.02 | 0.788 | 0.311 |
| 5 | Decision Tree | 2.107 | 0.955 | 0.849 |
| 6 | k-neighbor | 2.765 | 0.873 | 0.694 |
| 7 | MLP classifier | 3.224 | 0.894 | 0.696 |
| 8 | gaussian naive Bayes | 5.03 | 0.842 | 0.623 |
| 9 | random-forest | 2.916 | 0.773 | 0.243 |
| 10 | RVC | 3.053 | 0.799 | 0.540 |
| 11 | VRVM | 1.405 | 0.939 | 0.827 |
Table 1 shows the results for the DSTC2 dataset. Table 2 shows results for the DSTC3 dataset for the tourist domain. Comparison of accuracy, F-score and ICE from table 1 and table 2 can be studied.
Table 2: Results on DSTC3 dataset
| S.No | Classifier | ICE | Accuracy | F-score |
| 1 | Adamboost | 3.723 | 0.847 | 0.699 |
| 2 | SVM | 3.180 | 0.916 | 0.725 |
| 3 | SGD | 2.999 | 0.900 | 0.715 |
| 4 | ARD | 4.380 | 0.850 | 0.450 |
| 5 | Decision Tree | 3.458 | 0.901 | 0.700 |
| 6 | k-neighbor | 3.499 | 0.896 | 0.687 |
| 7 | MLP classifier | 3.780 | 0.783 | 0.324 |
| 8 | gaussian naive Bayes | 3.721 | 0.847 | 0.699 |
| 9 | random forest | 4.179 | 0.828 | 0.186 |
| 10 | RVC | 4.375 | 0.884 | 0.400 |
| 11 | VRVM | 0.311 | 0.897 | 0.677 |
The results from table 1 and table 2 are analyzed to find the classifier performing best and worst. The lowest ICE results are obtained by SLU incorporating SGD and SVM when evaluated on both DSCT2 and DSTC3 datasets. The highest accuracy is obtained by SLU incorporating SVM and SGD for DSTC2 and DSTC3. The highest F-score is obtained by SLU incorporating SVM and SGD for DSTC2 and DSTC3.
6. Conclusion
The work extends the classification algorithm in machine learning to the semantic decoder in SLU. Experimental results on both the DSTC2 database for the hotel domain and the DSTC3 database for the tourist domain had similar findings. The SLU’s robustness for data scarcity was measured by three evaluation metrics: accuracy, ICE, and F-score. The SLU model was trained at 25% data (least training data), 50% data, 75% data, and 100% data (highest training data). The work indicates three important findings from the results obtained from experimentation. The first finding is that both the databases are displaying variation in SLU performance for different classifiers indicating SLU performance is influenced by the selection of proper classifiers. The second finding is that there is variation in ICE for least and maximum training data for all the classifiers indicating ICE is highly influenced by the quantity of training data used to train the SLU model. The third finding is the amount of variation in ICE displayed by each classifier is different indicating the robustness of SLU to work under data scarceness is influenced by the right choice of the classifier.
Variation in ICE, accuracy and F-score for SLU incorporating SVM is 0.209, 0.007, 0.035 for DSTC2 database and 0.190, 0.018, 0.052 for DSTC3 database, respectively. Variation in ICE, accuracy, and F-score for SLU incorporating SGD is 0.296, 0.016,0.033 for DSTC2 database and 0.190, 0.010, 0.035 for DSTC3 database, respectively. Thus, the overall performance of SLU, maintaining good performance for all the three evaluation metrics, is by incorporating SVM and SGD. The overall low performance is displayed by SLU incorporating ARD, RVC, MLP, Gaussian naive Bayes, and RF.
- S. Jagdale, M. Shah, “Evaluation of Stochastic Gradient Descent and Spoken Language Understanding,” 2019 International Conference on Nascent Technologies in Engineering (ICNTE), 1–4, 2019, DOI:10.1109/ICNTE44896.2019.8946073
- A. Torres-Rodríguez, D. Morillón-Gálvez, D. Aldama-Ávalos, V.H. A. Basavanhally, S. Doyle, A. Madabhushi, “Predicting classifier performance with a small training set: Applications to computer-aided diagnosis and Rutgers, The State University of New Jersey Department of Biomedical Engineering,” Biomedical Engineering, 1, 229–232, 2010, DOI:10.1109/ISBI.2010.5490373
- A. Basavanhally, S. Viswanath, A. Madabhushi, “Predicting classifier performance with limited training data: Applications to computer-aided diagnosis in breast and prostate cancer,” PLoS ONE, 10(5), 1–18, 2015, DOI:10.1371/journal.pone.0117900.
- V.K. Vijayan, K.R. Bindu, L. Parameswaran, “A comprehensive study of text classification algorithms,” 2017 International Conference on Advances in Computing, Communications and Informatics, ICACCI 2017, 2017-Janua, 1109–1113, 2017, DOI:10.1109/ICACCI.2017.8125990
- G. Forman, I. Cohen, “Learning from little: Comparison of classifiers given little training,” Lecture Notes in Computer Science (Including Subseries Lecture Notes in Artificial Intelligence and Lecture Notes in Bioinformatics), 3202, 161–172, 2004, DOI:10.1007/978-3-540-30116-5_17.
- A.S. Altheneyan, M.E.B. Menai, “Naïve Bayes classifiers for authorship attribution of Arabic texts,” Journal of King Saud University – Computer and Information Sciences, 26(4), 473–484, 2014, DOI:10.1016/j.jksuci.2014.06.006
- S. Pournouri, S. Zargari, B. Akhgar, “An Investigation of Using Classification Techniques in Prediction of Type of Targets in Cyber Attacks,” Proceedings of 12th International Conference on Global Security, Safety and Sustainability, ICGS3 2019, 202–212, 2019, DOI:10.1109/ICGS3.2019.8688266.
- N. Wang, X. Zhao, Y. Jiang, Y. Gao, “Iterative metric learning for imbalanced data classification,” IJCAI International Joint Conference on Artificial Intelligence, 2018-July, 2805–2811, 2018, DOI:10.24963/ijcai.2018/389
- G.M. Foody, M.B. McCulloch, W.B. Yates, “The effect of training set size and composition on artificial neural network classification,” International Journal of Remote Sensing, 16(9), 1707–1723, 1995, DOI: 10.1080/01431169508954507.
- S.S. Yadav, S.M. Jadhav, “Deep convolutional neural network-based medical image classification for disease diagnosis,” Journal of Big Data, 6(1), 2019, DOI: 10.1186/s40537-019-0276-2.
- H. Sharma, S. Kumar, “A Survey on Decision Tree Algorithms of Classification in Data Mining,” International Journal of Science and Research (IJSR), 5(4), 2094–2097, 2016, DOI:10.21275/v5i4.nov162954
- N. Patel, S. Upadhyay, “Study of Various Decision Tree Pruning Methods with their Empirical Comparison in WEKA,” International Journal of Computer Applications, 60(12), 20–25, 2012, DOI: 10.5120/9744-4304.
- J.R. Quinlan, “Induction of decision trees,” Machine Learning, 1(1), 81–106, 1986, DOI: 10.1007/bf00116251.
- P.L. Tu, J.Y. Chung, “A new decision-tree classification algorithm for machine learning,” Proceedings – International Conference on Tools with Artificial Intelligence, ICTAI, 1992-Novem, 370–377, 1992, DOI:10.1109/TAI.1992.246431
- H. Sharma, S. Kumar, “A Survey on Decision Tree Algorithms of Classification in Data Mining,” International Journal of Science and Research (IJSR), 5(4), 2094–2097, 2016, DOI:10.21275/v5i4.nov162954.
- H. Sharma, S. Kumar, “A Survey on Decision Tree Algorithms of Classification in Data Mining,” International Journal of Science and Research (IJSR), 5(4), 2094–2097, 2016, DOI:10.21275/v5i4.nov162954
- S. Basu, N. Das, R. Sarkar, M. Kundu, M. Nasipuri, D.K. Basu, “An MLP based approach for recognition of handwritten ‘Bangla’ numerals,” Proceedings of the 2nd Indian International Conference on Artificial Intelligence, IICAI 2005, (March), 407–417, 2005.
- M. Abdar, N.Y. Yen, J.C.S. Hung, “Improving the Diagnosis of Liver Disease Using Multilayer Perceptron Neural Network and Boosted Decision Trees,” Journal of Medical and Biological Engineering, 38(6), 953–965, 2018, DOI: 10.1007/s40846-017-0360-z.
- M. Abdar, N.Y. Yen, J.C.S. Hung, “Improving the Diagnosis of Liver Disease Using Multilayer Perceptron Neural Network and Boosted Decision Trees,” Journal of Medical and Biological Engineering, 38(6), 953–965, 2018, DOI: 10.1007/s40846-017-0360-z.
- T. Windeatt, “Ensemble MLP classifier design,” Studies in Computational Intelligence, 137(5), 133–147, 2008, DOI:10.1007/978-3-540-79474-5_6.
- B.M. Gayathri, C.P. Sumathi, “An Automated Technique using Gaussian Naive Bayes Classifier to Classify Breast Cancer,” International Journal of Computer Applications, 148(6), 16–21, 2016
- R. Cordoba, L.F. D’Haro, F. Fernandez-Martinez, J.M. Montero, R. Barra, “Language identification using several sources of information with a multiple-Gaussian classifier,” International Speech Communication Association – 8th Annual Conference of the International Speech Communication Association, Interspeech 2007, 3(May 2014), 1913–1916, 2007
- P. Guo, Y. Jia, M.R. Lyu, “A study of regularized Gaussian classifier in high-dimension small sample set case based on MDL principle with application to spectrum recognition,” Pattern Recognition, 41(9), 2842–2854, 2008, DOI:10.1016/j.patcog.2008.02.004.
- M. Morchid, R. Dufour, P.M. Bousquet, M. Bouallegue, G. Linares, R. De Mori, “Improving dialogue classification using a topic space representation and a Gaussian classifier based on the decision rule,” ICASSP, IEEE International Conference on Acoustics, Speech, and Signal Processing – Proceedings, 126–130, 2014, DOI:10.1109/ICASSP.2014.6853571.
- H. El Sorady, A. Shoukry, S. Bassiouny, “Improving the parametric Gaussian classifier using neural networks,” National Radio Science Conference, NRSC, Proceedings, 1996, DOI:10.1109/nrsc.1996.551118.
- C. Lee, E. Choi, B. Baek, C. Yoon, “Analyzing the Gaussian ML classifier for limited training samples,” International Geoscience and Remote Sensing Symposium (IGARSS), 5(C), 3229–3232, 2004, DOI:10.1109/igarss.2004.1370389
- Y.G. Zhao, F. Zheng, Z. Song, “Hand Detection Using Cascade of Softmax Classifiers,” Advances in Multimedia, 2018, 2018, DOI:10.1155/2018/9204854
- D. Song, C. Lu, J. Ma, “Gearbox fault diagnosis based on VMD-MSE and AdaBoost classifier,” Vibroengineering Procedia, 14, 120–125, 2017, DOI:10.21595/vp.2017.19242.
- M.L.R. Chandra, B.V. Kumar, B. Sureshbabu, “IoT enabled home with smart security,” 2017 International Conference on Energy, Communication, Data Analytics, and Soft Computing, ICECDS 2017, 1193–1197, 2018, DOI:10.1109/ICECDS.2017.8389630.
- F. Wang, D. Jiang, H. Wen, H. Song, “AdaBoost-based security level classification of mobile intelligent terminals,” Journal of Supercomputing, 75(11), 7460–7478, 2019, DOI:10.1007/s11227-019-02954-y.
- S. Wu, H. Nagahashi, “Analysis of generalization ability for different AdaBoost variants based on classification and regression trees,” Journal of Electrical and Computer Engineering, 2015, 2015, DOI:10.1155/2015/835357.
- C.H. Zhao, Y. Zhang, Y. Wang, “RVM classification of hyperspectral image based on wavelet kernel function,” 2011 International Conference on Multimedia Technology, ICMT-2011, 3647–3650, 2011, DOI:10.1109/ICMT.2011.6002159.
- L. Wei, Y. Yang, R.M. Nishikawa, M.N. Wernick, A. Edwards, “Relevance vector machine for automatic detection of clustered micro calcifications,” IEEE Transactions on Medical Imaging, 24(10), 1278–1285, 2005, DOI:10.1109/TMI.2005.855435.
- K. Pal, B. V. Patel, Emotion Classification with Reduced Feature Set SGD Classifier, Random Forest, 2020, DOI: 10.1007/978-981-15-6648-6.
- F. Kabir, S. Siddique, M.R.A. Kotwal, M.N. Huda, “Bangla text document categorization using Stochastic Gradient Descent (SGD) classifier,” Proceedings – 2015 International Conference on Cognitive Computing and Information Processing, CCIP 2015, 0–3, 2015, DOI:10.1109/CCIP.2015.7100687.
- N.V. Kumar, P.V. Kumar, K. Pramodh, Y. Karuna, “Classification of Skin diseases using Image processing and SVM,” Proceedings – International Conference on Vision Towards Emerging Trends in Communication and Networking, ViTECoN 2019, 1–5, 2019, DOI:10.1109/ViTECoN.2019.8899449.
- T.D. Nguyen, T.D. Do, M.H. Le, N.T. Le, W. Benjapolakul, “Appliance Classification Method Based on K-Nearest Neighbors for Home Energy Management System,” 2019 1st International Symposium on Instrumentation, Control, Artificial Intelligence, and Robotics, ICA-SYMP 2019, 53–56, 2019, DOI:10.1109/ICA-SYMP.2019.8646278.
- S. Taneja, C. Gupta, K. Goyal, D. Gureja, “An enhanced K-nearest neighbor algorithm using information gain and clustering,” International Conference on Advanced Computing and Communication Technologies, ACCT, 325–329, 2014, DOI:10.1109/ACCT.2014.22.
- M.S. Alam, S.T. Vuong, “Random forest classification for detecting Android malware,” Proceedings – 2013 IEEE International Conference on Green Computing and Communications and IEEE Internet of Things and IEEE Cyber, Physical and Social Computing, GreenCom-IThings-CPSCom 2013, 663–669, 2013, DOI:10.1109/GreenCom-iThings-CPSCom.2013.122.
- S. Hwang, M.K. Jeong, “Robust relevance vector machine for classification with variational inference,” Annals of Operations Research, 263(1–2), 21–43, 2018, DOI: 10.1007/s10479-015-1890-9.
- D. Kropotov, D. Vetrov, L. Wolf, T. Hassner, “Variational relevance vector machine for tabular data,” Journal of Machine Learning Research, 13(2001), 79–94, 2010.
- M. Henderson, M. Gasic, B. Thomson, P. Tsiakoulis, K. Yu, S. Young, “Discriminative spoken language understanding using word confusion networks.,” SLT, 176–181, 2012, DOI:10.1109/SLT.2012.6424218.
- B. Thomson, “Statistical methods for spoken dialogue management,” Ph.D. Cambridge University, (December), t, 2009, DOI: 10.1007/978-1-4471-4923-1_1.