A Simulation Based Proactive Approach for Smart Capacity Estimation in the Context of Dynamic Positions and Events

Adv. Sci. Technol. Eng. Syst. J. 5(6), 423–438 (2020);
 DOI: 10.25046/aj050651
Technologies are growing with the passage of time and providing solutions for the existing problems. One of such problems is to manage the crowd according to available capacity. Especially when the crowd density is dynamic because of dynamic position of the persons (Pilgrims). Not only dynamic position of the pilgrims makes crowd capacity dynamic but also special events increase and decrease in number of pilgrims that affect the capacity in a specific place. Therefore, it is not an easy job to estimate the available capacity according to the dynamic position and event. To overcome such problems of dynamic position and event-based crowd management different techniques and approaches are adopted. To solve the above-mentioned problem, this paper proposes a proactive approach to estimate the space occupy by the pilgrims in different positions in a zone or level. Maximum capacity in each zone and level is define on the basis of each position. On the basis of maximum and occupy capacities, available (remaining) capacity has been estimated in a zone and level according to the events such as Pilgrimage, Ramadan, Jummah etc. The occupied and available capacities in a zone, level or in the whole building can be estimated with the help of technologies such as Wireless Sensor Network (WSN), cloud computing, Internet of Things (IoT) and sensor topologies according to position and event. Simulation shows different scenarios according to the zones and different levels of building to prove the proactive approach. According to the results, it is concluded that zones, levels and point of entrances should be allocated to the pilgrims to avoid the congestion problems. Further for massive crowd and large area multi sink solution is better than single sink solution to estimate available capacity.
1. Introduction
Capacity estimation plays a vibrant role to maintain equilibrium among the maximum, occupied, and remaining capacities so that number of the persons can be allowed to enter in a zone, level or in a building [1]. Number of the persons permitted to enter an area directly dependent on the remaining capacity [2]. Although image-based method does not depend on the crowd to carry any type of device and counting can be performed without handling of device by the crowd. But the crowd counting done on the basis of images, does not provide result in case of dark or fade environment [3]. To provide the population awareness globally, crowd analysis can be done on the basis of video imagery to calculate and estimate the density of the crowd. It is considered an important tool of analysis for crowd density estimation at public places. Other methods also involve counting by performing the detection method or by using the clustering method for crowd estimation. Due to the more crowded environment one of the recent ways is regression. It has the capability to handle large crowded area [4]. The proposed proactive approach for capacity estimation is to calculate the number of the persons entering and exiting from the certain area. It is estimated according to the maximum capacity on the occasion of different positions and events. The sensor devices have the capability to sense and collect data at a given zone, level, building or an area [5]. In a specific scenario, data may include person ID (pilgrim ID), device ID, zone and level number, date and time for entry and exit etc. The sensed data then can be forwarded to the cluster head, then to a sink or server at each level and finally to central cloud storage location in order to calculate the remaining capacity of the areas. For different statistics, cloud computing can play a vibrant role to use the stored data. With the help of IoT data can be forwarded to different stakeholder for timely information to manage the crowd according to the position and events.
To overwhelm the problem of estimation of the capacity in different position and event, proposed proactive approach is one of the efficient solutions to provide advantages including:
- Counting number of pilgrims without human intervention
- Set the maximum capacity for different positions (Prayer, Walking, Sitting, Standing)
- Capacity estimation for different zone, Mataf area and on each level
- Capacity estimation according to Extreme crowded events such as, Jummah prayer, Ramadan, Eidain, Pilgrimage
- To restrict the pilgrims if they already performed Umrah so that remaining pilgrims can get opportunity
- Lost pilgrims can be traced within the coverage area
One of the central pillars of Islam is also Pilgrimage. Approximately 3.5 million pilgrims assemble to perform pilgrimage in the holy city of Makkah [6]. In the month of Ramadan millions of people gather to perform Umrah and other prayers [7]. Pilgrims perform different supplications at different places and time to achieve the Pilgrimage or Umrah requirements. To perform the Umrah during Ramadan people persist around the Masjid Al-Haram. The estimation of available capacity inside the Masjid Al-Haram, may be calculated by number of pilgrims in a specific zone, or level minus maximum threshold of the capacity. It has been observed that it is problematic to estimate capacity for a massive dynamic crowd, the number of pilgrims entered in Masjid Al-Haram and what is the remaining capacity inside? When it exceeds to maximum capacity? In this paper, we try to solve the above-mentioned problem by exploiting WSN. We proposed a proactive approach to process the data for different zones and levels to estimate available capacity. As I myself perform the Jummah Prayer many times, The Holy Masjid Al-Haram was so much overcrowded that it became difficult to perform Sajood and Tashahud. It is because of wrong capacity estimation of zone or level.
This paper is an extension of our previous work accepted in The International Arab Conference on Information Technology ACIT’2019 [1]. The extension includes capacity estimation of dynamic position, event, study of sensor topologies and proactive approaches.
1.1 Paper Layout
In section 2, we briefly discussed the technologies used in our proposed proactive approach that includes the technologies such as cloud computing, IoT, clustering and WSN. In Section 3, there are briefly given the approaches or strategies at present used for capacity estimation. Section 4 depicts the proposed proactive approaches according to zone, level and for the whole building. Section 5 elaborates the use case, section 6 offers comparison between existing and proposed capacity estimation, section 7 defines the algorithms, section 8 simulation and results, section 9 gives discussion and section 10 conclusion and future directions.
2. Technologies for Proposed Framework and Proactive Approach
2.1. Cloud Computing
Cloud computing is one of the most important technologies for proposed proactive approach. In cloud computing, cloud resources are located at different physical places. But via internet cloud computing makes efficient cloud services available globally to a large number of consumers located on many geographical locations [8], [9]. In a cloud computing environment, wearable devices are suggested for supportive communication between wearables and cloud server. Wearable device can be accessed remotely via the Internet [10]. Moreover, its everything-as-service-model (XaaS) impacts its clients and creators with many benefits [11]-[13]. Cloud computing is cost effective for the customers and uses the strategy “pay as you go” [14][15]. To process and access information in a more accurate way, cloud based software architecture has been proposed [16], [17]. Sensors, actuators and many other embedded devices are considered as a data generation source that provide help to enable IoT edge computing to process data [18]. Cloud can store the data according to the position, event and zones for future planning to control the massive crowd.
2.2. Internet of Things (IoT)
IoT lets people/anybody and things/devices connect anyone, anything, anytime, anywhere, for any service. Although it is flexible, complex and dynamic network infrastructure as given in [19]. In many fields such as healthcare, smart homes, smart cities, retail, traffic, security, and agriculture, IoT offers multiple solutions [20]. With the help of an IoT we can monitor the elements such as wind, crops, soil, atmosphere, lights and water over a big area [21]. For the growth of the IoT, there is a need of plentiful resources for the development of the intelligent devices and the WSNs. The core building blocks are the same for network communication in between devices to build an Internet of the Things setup [22]. With up to date development and advancement in the field of information and communication technologies, it also brought positive changes in the advancement and development of IoT. Through low-cost electronic devices and communication IoT paradigm improves human collaboration in the physical world [23], [24]. In the same way, it is also increasing the importance of WSNs to integrate and make connections with the Internet to develop different commercial and industrial applications [25]. In order to achieve different objectives, updated information is required efficiently during pilgrimage and Umrah. To achieve the above goal, IoT can play a vital role to get updated information as needed at a particular zone or level. Information received from IoT may be used by the management such as security management, and resource management (water, chairs, Quranic scripts etc…). So that necessary actions can be performed according to updated information on time in proactive way.
2.3. Clustering and WSN
There are some limitations in WSN such as energy limitation, coverage area, network lifetime, and bandwidth. These limitations can be overcome with the help of some clustering schemes to get efficient solution [26]. Amongst the other factors, clustering is one of the most important factors. Clustering can also play an important role to control the performance of a network [27]. Wearable devices provide help to sense and disseminate information, such as physical activities, blood pressure, blood sugar level, heart rate) [28]. To monitor diverse environmental situations such as humidity, temperature, sunlight, and pressure, a smart sensing platform based on NodeMCU-ESP8266 microcontroller board has developed and given in [29]. With the implantation of WSN data can be sensed, stored, disseminated and processed to estimate the capacity [30], [31]. As an industrial IoT is an important infrastructure, WSNs play a crucial role in it. In IoT applications, efficiency balanced verification scheme for WSNs becomes a big contest, due to the resource limitation feature of sensor [32].
A proactive approach and framework can play an important role to enable reliable and an efficient management for WSN. One of the examples is Web Services based on clouds and lightweight cross-layer design [25].
2.4. Sensor Topologies
The topologies can differ in complication from a single node connected to a collector node to fully meshed network covering a large area. Flat or hierarchical architecture are used to design sensor topologies. In flat (peer-to-peer) architecture, each node either can be a sink or sensor node that has the same communication and computational abilities in the network. In hierarchical architecture, the nodes link with their particular cluster head in close proximity. Normally, cluster heads own more storage capacity and processing power as compared to any ordinary sensor node. Commonly line, star or bus topologies are used by the sensor networks that are physically wired together [33].
In Figure 1, point-to-point, Bus and linear topologies are given. A hardwired connection between two points is called a permanent point-to-point topology. A switched connection is a type of point-to-point connection in which control can be transferred between end nodes.
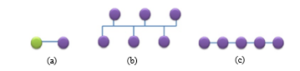
Figure 1: (a) Point-to-point, (b) Bus, and (c) Linear Network Topologies
In Bus topology, nodes are associated with a communication bus for communication. The advantages of the Bus topology are that it is simple and easy to install. But disadvantage is that the failure of central bus is the failure of the whole network, which is called a single point of failure. In Linear Topology, there is a two-way connection between the nodes. Only two terminating nodes has a single connection to their neighboring nodes at the end of the network, but all other nodes have link or connection to left and right nodes. In case of failure of a node, there is a disconnection from the network of any node connected to that node.
In Figure 2, ring, star and tree topologies are given. Network set up in a circular fashion is called ring topology. Each node in this configuration is connected to precisely two other nodes. Direction of flow of data is from the source to each node in clockwise or anticlockwise until it reaches to the intended recipient. In order to overcome this issue, a second communication ring is added by many networks that can transfer data in the opposite direction. In star topology, each node or device is connected to a single central device called hub or switch. Star topology has advantages such as easy to plan, implement, and add or remove the nodes. An intelligent node is needed as all data traffic flows through the central node. Entire network fails as a result of the failure of this node. In Tree topology, single “root node” is at the top of the hierarchy and other nodes are connected to the lower level in hierarchy in a tree manner structure. Many levels of nodes can be contained by a tree topology. This topology is extendable, and identification of the fault is easy and can be fixed easily because of simple structure. With the growth of the tree networks, it becomes more difficult to manage it.
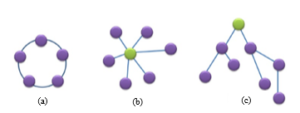 Figure 2: (a) Ring, (b) Star, and (c) Tree Network Topologies
In Figure 3, partially and fully mesh topologies are given. There are two arrangements of mesh topology: partially mesh and fully mesh. In partially mesh, some nodes are connected to more than one other node is called a partially connected mesh, while in fully mesh, every node is connected to every other node.
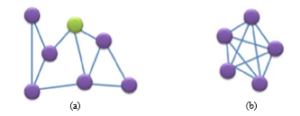 Figure 3: (a) Partially Connected and (b) Fully Connected Mesh Network Topologies
Cluster Tree topology consists of a single cluster or a multi-cluster network. Only one cluster-head (CH) is contained by a single cluster network. When all the nodes are connected to the cluster-head with single hop, the network topology becomes a star topology. More than one cluster-heads are contained by a multi-cluster network. An upper level sub-network is formed by all the cluster-heads. Nodes in different clusters communicate among themselves via their cluster heads but cannot directly talk to each other. Figure 4 illustrates the cluster tree topology, which has hierarchy architecture with the cluster-head network at the upper level and the clusters nodes at the bottom level [34]. The sink behaves as an entrance to the sensor nodes, gathering and updating the information. The sink plays a role as an interface among WSN, the external network and Internet, where the data are disseminated and processed. Sink can be single or multi sink depending upon the requirement of the application. The goal of the single sink formation is to minimize the forwarding time and route information in the direction of a unique sink. Multi sinks are utilized for applications where tasks are distributed to different sinks. Multi sinks are used where there are high density crowd, large coverage area, redundancy, high latency, and possible high energy consumption [35]. In our scenario cluster tree or hierarchical cluster structure is suitable to collect the data from zones and levels during different positions and events.
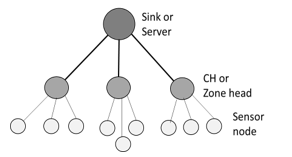
Figure 4: sensor cluster tree
During the events of Pilgrimage, Ramadan and Umrah the Holy city of Makkah (KSA) is crowded. Especially, to perform Umrah during the Ramadan all activities are around the Masjid Al-Haram, therefore it is need of the hour to organize, control and manage the crowded area smartly. The above objective can be achieved by proactive approach in smart way with the support of WSN, IoT, cloud computing and the management phases.
3. Present Capacity-Estimation Approaches
At present, capacity estimation is being done by management by taking view from the cameras or by the observation inside the Masjid Al-Haram. By cameras they discover the empty zone or level and update to the security officers to transfer the crowd to the empty or less crowded zone or level. They use the wireless system to give instructions to the security officers. By observation, the security officers check the capacity is available or not in an area where they are assigned. But they do not have auto capacity estimation approach so that they can measure how many pilgrims can be allowed in an empty space. They have just rough estimation of the available capacity. If the Zone or a level is reached to maximum capacity, the remaining crowd is diverted to the less crowded zone or level. If the Masjid Al-Haram is full then gates are covered with barrier and security officers do not permit pilgrims to get in, but they can make exit. No entry sign is turned on outside the gates. After that zones outside the Masjid Al-Haram are occupied. Sometimes zones and levels are overcrowded, and pilgrims face problem to perform the prayers or Tawaf. But currently, they do not have the smart estimation of the available capacity in a zone, level or in the whole Masjid Al-Haram. If there is smart capacity estimation with proactive approach, then pilgrims can be allowed according to the capacity available. Otherwise security stops the pilgrims at the gate and move to specified waiting area so that they do not overcrowd Masjid Al-Haram and do not cause any casualty.
4. Proposed Smart Capacity Estimation Framework and Proactive Approach
The Figure 5 represents the proposed smart capacity estimation proactive approach and framework. It provides help to estimate the capacity for zone and level to accurate the management. In order to ensure the smart capacity estimation in specific zone or level, the architecture uses WSN so that available capacity can be estimated for management automatically. The architecture provide help to understand the flow of data that is required to estimate the available capacity. It provides help to pilgrims to find out a specific zone or level where capacity is available. Figure 5 shows the overall picture of proposed framework and proactive approach for smart capacity estimation with the help of WSN, cloud storage and interaction among users by IoT for dynamic crowd management. It includes different phases: First phase involves smart capacity estimation according to time and preferable activity by pilgrims in a zone. Second phase involves smart capacity estimation according to time and their preferable activity by pilgrims at a level. Third phase involves smart capacity estimation according to time and their preferable activity by pilgrims at different levels, in order to calculate overall capacity occupied and available capacity in all zones or levels.
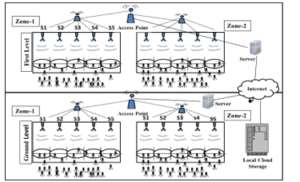
Figure 5: Proposed smart capacity estimation framework and proactive approach [1]
In the first phase, the calculation for the maximum capacity, capacity occupied by pilgrims and available capacity in the zone is done. In the second phase, head nodes or access point nodes fixed on the different zones at different levels will collect the data and forwarded to the server of different levels as update. In the third phase, data from each level from servers will be forwarded to the local cloud storage for further processing and management tasks. Detail of each proactive approach is given in subsection 4.1.
4.1. Proactive Approaches at Zone and Different Levels
Proactive approaches use to estimate the maximum, occupied and available (remaining) capacity with respect to zone, level and in a building.
The proactive approach for smart capacity estimation of zone is given as:
- The Figure 6 depicts the steps to estimate the capacity based on a zone.
- Sensor nodes are fixed on each entry and exit point for each zone that can collect data about number of the pilgrims getting in and out of the zone.
- This information is updated to the zone access point or head node and from zone access point, it is forwarded to the level’s server.
- The capacity occupied by pilgrims inside the zone can be calculated by number of pilgrims has entered minus number of the pilgrims exit.
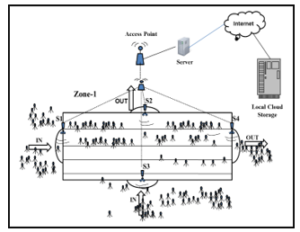
Figure 6: Smart capacity estimation of zone inside building [1]
Capacity occupied by pilgrims inside zone = number of pilgrims entered – number of the pilgrims exit
Z.IN=Entered to the zone
Z.OUT= Exit from the zone
![]()
- The available capacity of the zone can be calculated by the maximum capacity of the zone minus total number of pilgrims inside.
The remaining capacity = maximum capacity of zone – (total number of pilgrims inside the zone).
![]()
- Proactive approach to estimate capacity at Ground Level is depicted in Figure 5.
- On each zone, sensor nodes will collect the data for pilgrims getting in or out. Afterward, it adds up or subtracts the number of the pilgrims got in and out from the head node or access point.
- The number of pilgrims getting in or out from all zones will be added up or subtracted by head nodes and then updated by the ground level server.
- If a pilgrim moves to the first level from ground level, then it will be subtracted from the ground level server but added into the first level server and vice versa.
![]()
- From head node data can be forwarded to server to estimate the available capacity for ground level. If the ground level reaches to maximum capacity, then the ground level mentions no entry. Because ground level is full, it will be disturbance for the pilgrims if the pilgrims from outside entered into ground level and move to the first level. Therefore, security officers move the crowd to the first level from outside gate without entering into ground level and vice versa.

- Proactive approach to estimate capacity at First or at different levels is depicted in Figure 5:
- If the pilgrims move directly into the first level from outside gates, then there will be an addition to the ground level server and vice versa.
- If the pilgrims move into the First level via ground level, then it will be subtracted from the ground level but added into the first level and vice versa.
- From head node or access point data can be updated to the server to estimate the available capacity for first level. If the first level reaches to the maximum capacity, then at first level no entry appear at entrance. A message of maximum capacity is generated to the security officers by using IoT. The security officers move the crowd to second level from outside gate without entering into ground level or first level and vice versa.
- To avoid disturbance, pilgrims are allowed first to fill up top level then second and first level respectively. In this way first and second level pilgrims will not be disturbed.
- The data from each level forwarded to the local cloud storage to calculate the available capacity for the overall building. The data can be analyzed for different positions and events such as Ramadan, Pilgrimage, Jummah etc.
At present, most of prevailing wireless sensor devices are restricted because of memory, processing speed, efficiency and capabilities of communication. The above reasons are because of technology and economic limitations [36]. Low-power, low-cost, a multifunctional sensor device has been developed and designed by various industries for different applications, with high attention. Amongst the sensor devices one of the big issues in WSN is to classify and produce an organizational structure [37]. On behalf of clustering topologies, the processing of sensor devices can be improved which in turn improve the processing time. As a result, performance of capacity estimation will increase [38]. The collection of data will provide help to update information at zone, level, building and at crowded areas during Pilgrimage, Ramadan and Umrah for management.
The cloud storage, IoT and telecommunication play an important role in order to collect, assignment and process data locally and globally for smart capacity estimation [39]. To get results for different applications and different analysis, enormous amount of data can be sensed, stored and processed by the deployment of large number of sensor devices, cloud storage and IoT connections [40]. Detail of sensor topologies is given in section (2.4).
5. Use-Case for Smart Capacity Estimation
Data related to the pilgrims have been collected long time before by management and companies (travel agents) for pilgrimage, Umrah and visit. On the completion of e-visa process, management and companies receive information about pilgrim’s residence in different sector or region. The information includes route of travel, reservation (city, hotel) and number of days to stay in different places. Pilgrims can be allocated the zones and levels according to their point of entrance according from their sector or region. As in Masjid Al-Haram, pilgrims have different positions therefore; capacities vary according to the different positions such as standing, sitting, walking and prayer positions. Capacity also depends on the events. Hence, it is important to measure the capacities according to each position and event.
5.1. Positions and Capacity
Capacity of the area is also depending on the position of the pilgrims such as standing, sitting, walking (performing Tawaf and Saee) and prayer position as given in Figure 7 and 8.In case of standing position space required for a pilgrim is less than as compared to the other position therefore, in standing position the available capacity will be maximum but in case of sitting, the pilgrim require more space than the pilgrim standing, therefore, in sitting position maximum available capacity will be reduced. In case of walking, the pilgrim required more space than sitting and standing position therefore, the maximum available capacity will be reduced as compared to sitting and standing maximum capacities.
In case of prayer position, the pilgrim needs more space than the standing, sitting, and walking position as the prayer position are dynamic such as standing (Qeyyam), sitting (Tashahud) and Sajood. Roughly, if we consider the standing position as the standard measurement then space ratio between standing and sitting position is measured as [5:9]. In case of walking position, the space ratio in between standing, and walking position is measured as [10:13]. In case of prayer position, the space ratio in between standing, and prayer position is as [1:3]. By calculating the capacities according to the crowd position, the crowd maximum capacity can be set according to standing, sitting, walking and performing prayer. At the time of prayer, the capacity will be minimum as compared to standing, sitting and walking position but in case of standing the capacity will be maximum as compared to sitting, walking and prayer position.
We can divide the sector for standing, sitting, walking and prayer. If crowd has different positions such as standing, sitting, walking and prayer within one sector or zone then we can calculate the average capacity. In case of The Holy Masjid Al-Haram, pilgrims want to see Baitullah (Kaaba), they can be managed on first, second and on top level near the balcony wall so that they can see the Kaaba in standing position. Sitting position is required when pilgrims want to recite the Holy Quran or Dhikr of Allah (Mention of Allah). They can be managed behind the Mataf area. Walking position is required in the Mataf or circular area on first, second and at top level. Prayer position can be at any sector but before prayer we need to calculate the capacity available for prayer and crowd inside the Masjid Al-Haram.

Figure 7: Capacity for prayer and standing positions
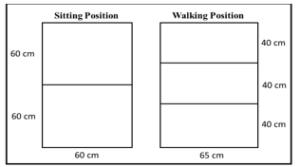
Figure 8: Capacity for sitting and walking positions
As we roughly calculated the space taken by the different position are given in Figures 7 and 8:
Standing = 40 x 50 = 2000 Sq CM
Sitting = 60 x 60 = 3600 Sq CM
Walking = 40 x 65 = 2600 Sq CM
Prayer = 120 x 50 = 6000 Sq CM
5.2. Stop and Wait
Calculate the average number of pilgrims entered in an area (Zone or sector) in unit time for example in one minute or in an hour. Average will provide help to calculate after how much time it is expected that the sector or zone will reach to its maximum limit. In this way we can control the crowd before it exceeds to its maximum limit. Usually it is observed that some time crowd exceeds the maximum limit and at prayer or Tawaf time pilgrims face a big problem which can lead to a stampede.
5.3. Move and Enter in the Zone
Rate of in and out to manage after maximum capacity, when zone and level reaches to its maximum capacity. Many pilgrims stay outside waiting for space availability. The space available for waiting pilgrims can be calculated by maximum capacity minus number of the pilgrims making the exit (going out). The space availability can be in a sector or zone or in whole area.
Table 1: Comparison between existing and proposed capacity estimation
| S.No. | Existing Capacity Estimation | Proposed Capacity Estimation |
| i. | Initial capacity estimation is roughly calculated on the basis of previous experience and best guesses. | Initial capacity estimation will be calculated on the basis of data collected from central storage system. |
| ii. | Each zone capacity is calculated by the security officers or by computerized camera’s system. | For each zone, automatically real time zone capacity will be estimated by zone sensors and sensor head. |
| iii. | Capacity available in a zone is controlled manually not automatically by security officers with the help of wireless system. | Capacity available in a zone will be calculated and automatically displayed. Zone security officer will manage the zone according to the available capacity. |
| iv. | There is no assurance about the exact maximum capacity estimation. Wrong estimation of maximum pilgrims’ capacity can overcrowd the zone or level. | Maximum capacity for ach zone or level is already set therefore; maximum capacity alert will be generated automatically for no entry without any delay. |
| v. | According to dynamic positions and events there is no proper capacity records for zone and level. | Security officers can get records from local cloud storage system for future planning for each zone and level according to positions and events. |
| vi. | Real time capacity available cannot be calculated therefore capacity available can only be roughly estimated. | Real time capacity available will provide help to allow exact number of pilgrims to enter into a specific zone or level. |
| vii. | Difficult to estimate capacity available during different positions, events during prayer time and Tawaf time as each activity has different capacities that is number of pilgrims. | Capacity available during different positions, events during prayer time and Tawaf time is automatically estimated because prayer time and Tawaf time maximum capacity threshold can be set automatically according to activity. |
| viii. | There is no automatic way to trace out the lost pilgrim because existing system only support to manual capacity estimation and for security purpose. | Pilgrim lost can be traced out on the bases of the sensor device location with help of IoT. |
| ix. | CCTV cameras implementation provide help to observe and control the act of misconduct but there is no automatic way to identify the pilgrim (mis-conductor). | If the act of misconduct is done, then pilgrim (mis-conductor) will be identified on the bases of information stored on sensor device and on the cloud storage with the help of IoT. |
| x. | There is no such application to provide schedule, when the capacity is available for a specific building, sector and region. | Application can be developed on the basis of IoT to provide the schedule for visit to Masjid Al-Haram according to building, sector and region. |
5.4. Evacuation or Exit from the Zone
In any case if the capacity exceeds to maximum limit in a zone or level, it can be managed in another zone or level. In worst case the pilgrims have to evacuate to the waiting place and put into high priority to get in when space will be available.
6. Comparison between Existing and Proposed Capacity Estimation
In the section 3, capacity estimation about existing system is described. It consists of manual capacity estimation, wireless system and computerized camera’s systems. The proposed capacity estimation is discussed in the section 4. The comparison and preliminary analysis between existing and proposed smart capacity estimation systems are given in Table 1.
7. Algorithm for Proposed Capacity Estimation
We have taken the simple scenario to design the algorithms at different zones, different levels and in the whole building.
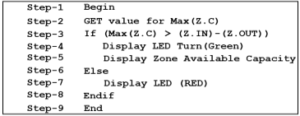
7.1. Algorithm for Zone Capacity Estimation
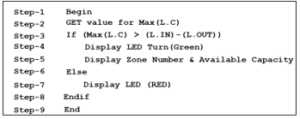
In zone capacity estimation, we simply check the available capacity in zone. If maximum zone capacity is greater than the number of pilgrims has entered in a zone minus number of pilgrims have exited from the zone. If the condition is true, then display the GREEN sign and also display the available capacity for pilgrims in waiting position. Otherwise display RED sign that zone is full and there is no entry.
Algorithm 1: Zone capacity estimation
7.2. Algorithm for different Level Capacity Estimation
In different levels capacity estimation, we simply check the available capacity in a level. If maximum level capacity is greater than the number of pilgrims has entered in a level minus number of pilgrims have exited from a level. If the condition is true, then display the GREEN sign for available capacity. Also display the zone number and level number where capacity is available for pilgrims in waiting position. Otherwise display RED sign that level is full and there is no entry.
Algorithm 2: Different level capacity estimation
Cluster verification algorithm [31], represents the scenario of verification of cluster members (CMs) in cluster form. It discusses the number of verified and unverified CMs in a cluster. But in capacity estimation algorithm, it verifies and count the number of the pilgrims getting in or out from zone, level or in a building. All CMs remain within the cluster head transmission range for verification. But in capacity estimation algorithm, the pilgrims in the range of entry and exit sensors are verify when they make entry or exit from zone or level. CMs can enter to different clusters but in capacity estimation, it is not allowed to enter other than allocated zone or level. Zone and level are allocated so that pilgrims enter from the gate that is near to their zone and level. In this way crowd will be distributed in different zones, as a result a single path and zone will not be crowded. In the cluster verification, the number of the CM verify are listed out but in capacity estimation, it tells the available capacity for a zone and as well level and building. Cluster verification represents the number of CMs supported by a cluster head but in capacity estimation, the number of the pilgrims can be managed according to the available space in a zone or level or building. In cluster verification more than one CM can be verified. But in capacity estimation, the verification and counting of the pilgrims is done at entrance and exit one by one. In cluster verification, cluster head generate the signals for verification and in response CMs generate signals for their identification. But in capacity estimation, pilgrims (sensor devices) generate signals (that is an event driven approach) for verification and in response zone sensors verify and count the number of pilgrims getting in or out from zone.
8. Simulation and Results
Contiki OS is a lightweight open source operating system for sensor network. It was designed by Adam Dunkels, at the Swedish Institute of Computer Sciences. C programming language is used in both Contiki OS and its programs. Contiki is flexibly portable OS and it has been ported to different platforms. Texas Instruments MSP-430 in addition to Atmel AT mega series of microcontrollers are the most often used platforms. Contiki employs event-driven programming model to deal with concurrence. It is Contiki’s main advantage that all processes share one stack, allowing savings of memory. In order to utilize this model Proto threads. Unconditional blocking wait is provided by Proto threads to save the state when it blocks. It jumps back to the next instruction on resumption of Proto thread. It also employs Rime stack that is a stack for sensor networks for lightweight communication. The main purpose of Rime stack is to support code reusing and simplify the implementation of sensor networks. Contiki is used in several systems, such as electric meters, alarm generating systems, remote control of house, radiation detection and streetlights control. Cooja is Java based Contiki network simulator with a graphical user interface (GUI). It is a trial system given by Contiki, and additionally empowers with original instrumentation before running it on the real target hardware. It integrates to simulate with the external tools to provide additional features to the large and small networks. Motes can be emulated, which is faster and allows simulation of larger networks, or at the hardware level. Two emulator software packages are contained by this tool: Avrora and MSPSim. Cooja can emulate multiple platforms like: TelosB/SkyMote, MicaZ mote, Zolertia Z1 mote, ESB, Wismote [41].
The Figure 9 shows full screen view of Contiki/Cooja simulator. Network simulator “Contiki/Cooja” is separated into small windows such as: Network Window, Notes Window, Simulation Control Window and Mote Output Window.
Network Window is employed to draw the WSN in random manner, linear, ellipse or manual positions. Notes Window is employed to write down the information or detail about the simulations and detail of its results. In order to start, stop, pause or reload the simulations, simulation control Window is used. The results for data packets have transmitted and received is provided by Mote Output Window. For our scenario, we use the Tmote Sky platform. Tmote Sky is one of the high data rate platforms work with low power consumption. It works well for many months to years without replacing the battery. Therefore, it is one of the most demanding wireless sensors. It is notable that options are best used in a selection manner, as the window can become disordered with too many selected options. The number for each mote is displayed by Mote IDs. Mote Output window can be used for analyzing and filtering results. On the simulated motes, LEDs are beneficial in order to observe the LED lights.
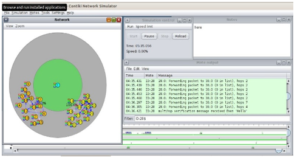
Figure 9: Full view of the Contiki/Cooja simulator
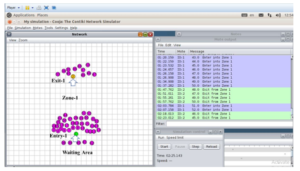
Figure 10: Single zone having maximum capacity 50
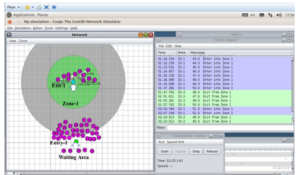
Figure 11: Single zone having maximum capacity 50 with coverage
We took the simple scenario to make understanding of the flow and function of each node as given in Figures 4 and 8. Head node function is to keep the record and status of CMs and forward record to the server for update. The status of the CM can be waiting to enter, enter and exit. Since the log file generated by the Contiki/Cooja simulation tool, we extracted the data for single and double zone in a level. For each zone we calculated the number of the pilgrims entered, exited, zone capacity occupied and available capacity for pilgrims. From this datum we can calculate the capacity for different positions and events. We also draw the table and graph for better understanding.
8.1. Single Zone Scenario
In single zone scenario, we consider one entry point and one exit point. We also set the maximum value for zone then we allow the specific number of the CMs to enter the zone and some of them allowed to exit from the zone. The simulation is shown in the Figures 10 to 18 and data is given in the Table 2. To make clarity of the figures, we consider the complete figure and then divided into its small parts (network, mote output and simulation control windows).
The simulation for maximum capacity 50 pilgrims is shown in the Figures from 10 to 14 and data is given in the Table 2.
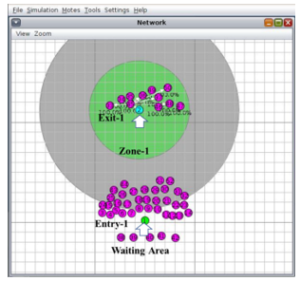
Figure 12: Network window from Figure 11
The Figures 10 and 11 represent the single zone having maximum capacity of 50 pilgrims. Figure 10 shows the capacity without coverage area while Figure 11 shows the capacity with coverage area in circular form.
The Figure 12 represents the network distribution of sensor nodes, entry point and exit point nodes in single zone having maximum capacity of 50 pilgrims. It also shows the number of nodes in waiting, occupy and exit position to calculate the available capacity.
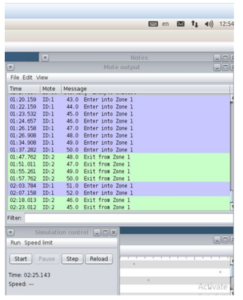
Figure 13: Mote output and simulation control windows from Figure 11
Figure 13 represents the most output with time, mote ID and its status enter or exit. The mote output is saved in the log file from where we can estimate the available capacity in a zone.
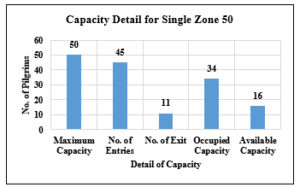
Figure 14: Capacity detail for single zone having maximum capacity 50
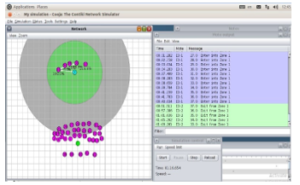
Figure 15: Single zone having maximum capacity 40 with coverage
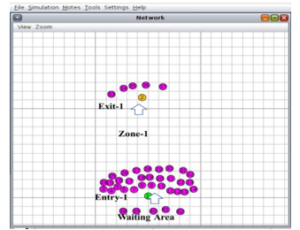
Figure 16: Network window from Figure 15
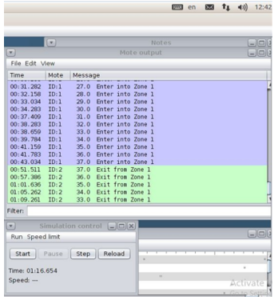
Figure 17: Mote output and simulation control windows from Figure 15
Figures from 10 to 14 considered that the maximum capacity for zone is 50 Pilgrims. Graph in Figure 14 shows that 45 of them have entered and 5 are in waiting position. 11 pilgrims have made the exit, occupied capacity in the zone is 34 and available capacity is 16.
The simulation for maximum capacity 40 is shown in the Figures from 15 to 18 and data is given in the Table 2. To make clarity of the figures, we consider the complete figure and then divided into its small parts (network, mote output and simulation control windows).
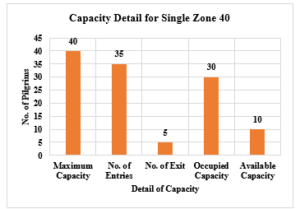
Figure 18: Capacity detail for single zone having maximum capacity 50
Figures from 15 to 18 show the maximum capacity for zone is 40 Pilgrims. Graph in Figure 18 shows that 35 out of 50 pilgrims have entered and 5 are in waiting position. 5 pilgrims have made the exit, occupied capacity in the zone is 30 and available capacity is 10.
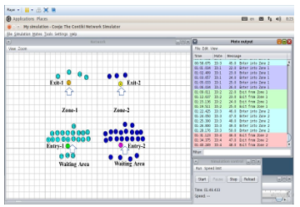
Figure 19: Each zone has maximum capacity 25 but total 50
8.2. Different Levels and Double Zone Scenarios
In different levels and double zone scenarios, we consider one entry point and one exit point in each zone and also consider that each level has double zone. We also set the maximum value for each zone and each level. We allowed the specific number of the nodes to enter in each zone and some of them allow to exit from each zone. The simulation is shown in the Figures 19-32 and data are given in the Table 2.
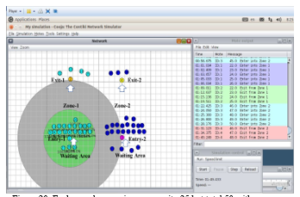
Figure 20: Each zone has maximum capacity 25 but total 50 with coverage
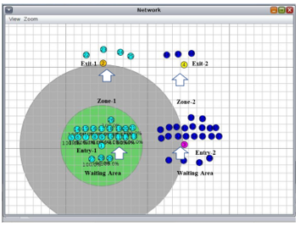
Figure 21: Network window from Figure 20
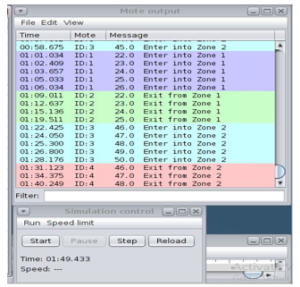
Figure 22: Mote output and simulation control windows from Figure 20
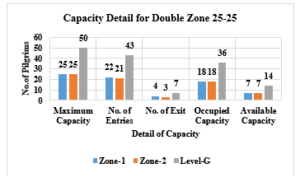
Figure 23: Capacity detail for double zones having maximum capacity 25 in each but Level-G has maximum capacity 50
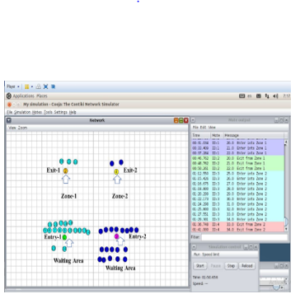
Figure 24: Each zone has maximum capacity 20 but total 40
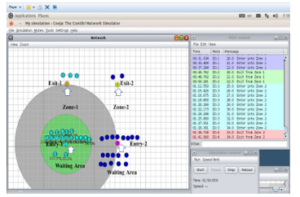
Figure 25: Each zone has maximum capacity 20 but total 40
In Figures 19 to 23, it is considered that the maximum capacity for zone-1 and zone-2 is 25. Zone-1 and zone-2 made the level-G and total capacity is 50 Pilgrims. In zone-1, 22 have entered and 3 are in waiting position. 4 pilgrims have made the exit, occupied capacity in the zone is 18 and available capacity is 7. In zone-2, 21 have entered and 4 are in waiting position. 3 pilgrims have made the exit, occupied capacity in the zone is 18 and available capacity is 7. From the log file or zone-1 and zone-2, we calculated the capacities for Level-G. Level-G has maximum capacity 50 pilgrims. 43 have entered and 7 are in waiting position. 7 pilgrims have made the exit, occupied capacity in the zone is 36 and available capacity is 14.
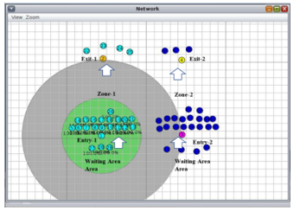
Figure 26: Network window from Figure 25
In Figures 24 to 28, it is considered that the maximum capacity for zone-1 and zone-2 is 20 pilgrims. Zone-1 and zone-2 made the level-1 and total capacity in level-1 is 50 Pilgrims. In zone-1, 18 have entered and 2 are in waiting position. 3 pilgrims have made the exit, occupied capacity in the zone is 15 and available capacity is 5. In zone-2, 10 have entered and 10 are in waiting position. 2 pilgrims have made the exit, occupied capacity in the zone is 8 and available capacity is 12. From the log file or zone-1 and zone-2, we calculated the capacities for Level-1. Level-1 has maximum capacity 40 pilgrims. 28 have entered and 12 are in waiting position. 5 pilgrims have made the exit, occupied capacity in the zone is 23 and available capacity is 17.
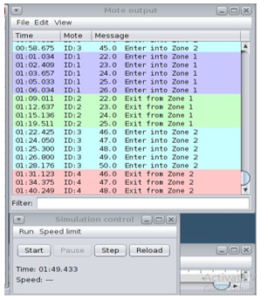
Figure 27: Mote output and simulation control windows from Figure 25
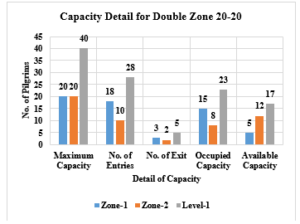
Figure 28: Capacity detail for double zones having maximum capacity 20 in each but Level-1 has maximum capacity 40
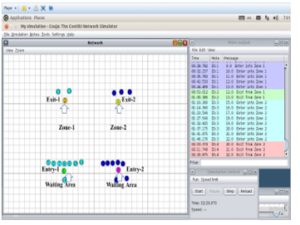
Figure 29: Each zone has maximum capacity 10 but total 20
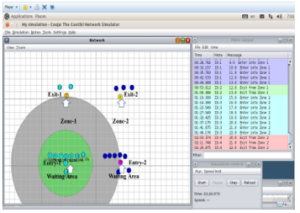
Figure 30: Each zone has maximum capacity 10 but total 20 with coverage
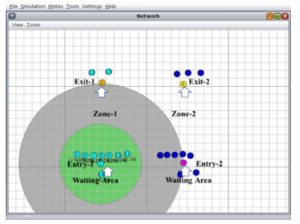
Figure 31: Network window from Figure 30
In Figures 29 to 32, it is considered that the maximum capacity for zone-1 and zone-2 is 10 pilgrims. Zone-1 and zone-2 made the level-2 and total capacity in level-2 is 20 Pilgrims. In zone-1, 9 have entered and 1is in waiting position. 2 pilgrims have made the exit, occupied capacity in the zone is 7 and available capacity is 3. In zone-2, 8 have entered and 2 are in waiting position. 3 pilgrims have made the exit, occupied capacity in the zone is 5 and available capacity is 5. From the log file or zone-1 and zone-2, we calculated the capacities for Level-2. Level-2 has maximum capacity 20 pilgrims. 17 have entered and 3 are in waiting position. 5 pilgrims have made the exit, occupied capacity in the zone is 12 and available capacity is 8.
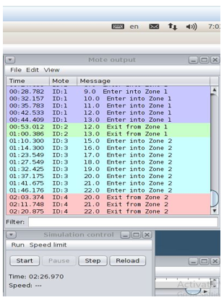
Figure 32: Mote output and simulation control windows from Figure 30
Table 2: Zones and Levels and capacities
| Zone/Level | Maximum Capacity | No. of Entries | No. of Exit | Occupied Capacity | Available Capacity |
| Single Zone | 50 | 45 | 11 | 34 | 16 |
| 40 | 35 | 5 | 30 | 10 | |
| Level/Double Zone | |||||
| Zone-1 | 25 | 22 | 4 | 18 | 7 |
| Zone-2 | 25 | 21 | 3 | 18 | 7 |
| Level-G | 50 | 43 | 7 | 36 | 14 |
| Zone-1 | 20 | 18 | 3 | 15 | 5 |
| Zone-2 | 20 | 10 | 2 | 8 | 12 |
| Level-1 | 40 | 28 | 5 | 23 | 17 |
| Zone-1 | 10 | 9 | 2 | 7 | 3 |
| Zone-2 | 10 | 8 | 3 | 5 | 5 |
| Level-2 | 20 | 17 | 5 | 12 | 8 |
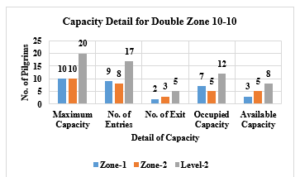
Figure 33: Capacity detail for double zones having maximum capacity 10 in each but Level-2 has maximum capacity 20
9. Discussion
The present analysis deals with capacity estimation for pilgrims at crowded place. The prime focus is on the allotment of zone and level number. This is performed according to moving status and events, single or multi sink, entry and exit point.
The concern of discussion is the allotment of zone and level number to pilgrims. According to discussion allotment of zone and level number to pilgrims should be specific (fixed) or flexible for dynamic position and events accordingly. Specific zone and level number according to dynamic positions and events is preferred because it is noticed if allotment is flexible then some zone and level number are more crowded than available capacity while others remain empty or less occupied. Furthermore, prayer position requires more area than standing and sitting position comparatively as given in section (5.1). As compared to routine days, pilgrimage, Ramadan and Jummah needs more area. The above mention reasons lead to non-uniform distribution of crowd. What is more, pilgrims having flexible zone and level move in different directions. It can result in congestions (bottleneck) that can lead to stampede. But in particular case, pilgrims are allotted the specific tracks to approach their zone and level number, that is why, chances of bottleneck and stampede are lessened or minimized. In flexible case, pilgrims are unable to move flexibly from overcrowded to less crowded zone or level (where capacity is available). This is because they have right to enter any zone and level number. But in particular case, pilgrims are allotted by the zone and level number. They can only move into allotted zone and level number. As allotment is performed considering maximum capacity of zone or level (a proactive approach), the zone or level does not get overcrowded. Place can be occupied within the zone on the basis of first come and first serve.
Entry point and exit point is the second point of discussion. In case of flexible, the pilgrims can enter and exit from any one of the points. Again, some entry points become more crowded than the other and cause bottleneck and there are chances of stampede. Moreover, pilgrims’ attempt of entry and making exit from same location also causes bottleneck and stampede. But in specific case, each zone and level have particular point of entry and exit. In this way, chances of problem of bottleneck and stampeded can be overcome. Furthermore, pilgrims can conveniently access the transport of their residential area.
Third point of discussion is that there should be a single or multiple sink for WSN system. Massive crowd, scalability, latency, reliability, and network lifetime are the numerous challenges that may be created by the design of WSNs. The question whether sink should be single or multi sink is dependent upon its application. In the case of single sink and massive crowd, single sink has to control all traffic. The streaming of data traffic will be in one direction which causes congestion. There are probabilities that single sink is ineffective to control massive amount of data which causes the drop of data. This drop of data will cause the high latency rate. However, there are separate solutions to control the massive crowd and data in case the multi sinks are used. In the case of multi sink, data flow will be in multiple directions rather in one direction. Probability of congestion can be minimized in this way. In order to avoid the congestion and to distribute the task among sinks different type of data traffic or task can be allotted to different sinks. If the data is dropped on one path, it can be received on the alternative path. In this way latency rate can be minimized. When data is received from different paths and sinks, it will provide the data redundancy. Single sink solution is not appropriate in case of long-distance communication because transferring data to long distance with the support of sensor nodes means consumption of energy to a lot degree. This consumption of energy will lead the sensor node die early and hence it will shorten the network life span. But in case of multi sink, the sensor nodes will get the shortest path as multi sink will divide the path and will consume less energy by increasing the network life span. Increasing of lifetime of network and receiving of data from multiple courses increase the reliability of the network. In our case, as data is massive, crowd is large, dynamic, and on large area therefore WSN required the multi sinks solution.
10. Conclusion and Future Directions
This paper provides an overview of a dynamic positions and events, proactive approach with framework and its implications towards smart capacity estimation using WSN and cloud computing in the IoT paradigm.
We discussed the framework and proactive approach in the context of dynamic position and events for smart capacity estimation. We examined how smart capacity estimation automate and minimizes time to manage available capacity in a zone or level by using framework and proactive. Explanation is done by use-case of masjid Al-Haram for smart capacity estimation for crowd management. We also compared the existing capacity estimation and smart capacity estimation systems. We also defined the algorithms with respect to Zone and Level. We also ran different simulation scenarios and also discussed the results. In future we will calculate the capacity according to the different position. The dynamic capacity can be calculated on the basis of time frame and capacity can be maximized and minimized according to time frame. In future algorithms can be defined how to maintain social distancing, how to calculate the capacity with social distancing and find the empty space with direction? Algorithms devised how to define the exit plan to move out without facing the congested path. Smart capacity estimation with Sensor and without sensor. Without sensor, capacity of pilgrims can be counted by putting the manual counter. If proposed proactive approach and framework for smart capacity estimation is commercially applied, it can provide help in different application developments, such as: 1. Capacity available in a zone or at a level can be calculated precisely. 2. To estimate the occupied and remaining capacity in a building or in an area. 3. Alert generation before the zone or level reached to its maximum threshold. 4. Positions and Events based capacity estimation. 5. Capacity estimation on the basis of social distancing. 6. Calculation of the social distance. 7. Drinking water estimation to supply the water in different zones and levels. 8. On the basis of wheelchairs’ requests, wheelchairs supply plan according to demand in different zones and levels. 9. Estimation of the Holy Quran scripts according to different languages. 10. If water, chairs or the Holy Quran scripts are not enough in a zone or level then generate the alert to workers for supply. 11. Sharing of zone capacity data with different zone security officers to manage the crowd capacity. 12. In case of emergency, provide path for evacuation from affected zone or level to outside.
- N.A. Nawaz, H.R. Malik, A.J. Alshaor, “A framework for smart capacity estimation at crowded area using WSN,” in Proceedings – 2019 International Arab Conference on Information Technology, ACIT 2019, 159–164, 2019, doi:10.1109/ACIT47987.2019.8991037.
- H. Paloheimo, M. Lettenmeier, H. Waris, “Transport reduction by crowdsourced deliveries – a library case in Finland,” Journal of Cleaner Production, 132(2016), 240–251, 2016, doi:10.1016/j.jclepro.2015.04.103.
- W. Xi, J. Zhao, X.Y. Li, K. Zhao, S. Tang, X. Liu, Z. Jiang, “Electronic frog eye: Counting crowd using WiFi,” in Proceedings – IEEE INFOCOM, 361–369, 2014, doi:10.1109/INFOCOM.2014.6847958.
- C.C. Loy, K. Chen, S. Gong, T. Xiang, Crowd Counting and Profiling: Methodology and Evaluation, 347–382, 2013, doi:10.1007/978-1-4614-8483-7_14.
- B. Guo, Z. Wang, Z. Yu, Y. Wang, N.Y. Yen, R. Huang, X. Zhou, “Mobile Crowd Sensing and Computing: The review of an emerging human-powered sensing paradigm,” ACM Computing Surveys, 48(1), 1–31, 2015, doi:10.1145/2794400.
- S. Hashish, M. Ahmed, “Efficient wireless sensor network rings overlay for crowd management in Arafat area of Makkah,” in 2015 IEEE International Conference on Signal Processing, Informatics, Communication and Energy Systems, SPICES 2015, 1–6, 2015, doi:10.1109/SPICES.2015.7091437.
- H. Elazhary, “Cloud-based Context-aware Mobile Applications and Framework for Hajj and Umrah Management,” International Journal of Computer Trends and Technology, 47(2), 106–115, 2017, doi:10.14445/22312803/ijctt-v47p115.
- F. Tao, J. Panneerselvam, T. Holding, L. Liu, “A cloud-based sustainable business model for effective ICT provision in higher education,” in Proceedings – 9th IEEE International Symposium on Service-Oriented System Engineering, IEEE SOSE 2015, 222–228, 2015, doi:10.1109/SOSE.2015.9.
- T. Gamage, D. Anderson, D. Bakken, K. Birman, A. Bose, C. Hauser, K. Maheshwari, R. Van Renesse, Mission-critical cloud computing for critical infrastructures, 1–16, 2017, doi:10.1201/b16908.
- M. Chen, Y. Ma, Y. Li, D. Wu, Y. Zhang, C.H. Youn, “Wearable 2.0: Enabling Human-Cloud Integration in Next Generation Healthcare Systems,” IEEE Communications Magazine, 55(1), 54–61, 2017, doi:10.1109/MCOM.2017.1600410CM.
- K. Nowicka, “Competitiveness of Polish enterprises in relation to the potential of cloud computing,” Kwartalnik Nauk o Przedsiębiorstwie, 42(1), 85–99, 2017, doi:10.5604/01.3001.0010.0158.
- N.A. Nawaz, A. Waqas, Z.M. Yusof, A. Shah, “A framework for smart estimation of demand-supply for crowdsource management using WSN,” in ACM International Conference Proceeding Series, 1–5, 2017, doi:10.1145/3018896.3025140.
- Y. Mao, C. You, J. Zhang, K. Huang, K.B. Letaief, “A Survey on Mobile Edge Computing: The Communication Perspective,” IEEE Communications Surveys and Tutorials, 19(4), 2322–2358, 2017, doi:10.1109/COMST.2017.2745201.
- S.H.H. Madni, M.S.A. Latiff, Y. Coulibaly, S.M. Abdulhamid, “Resource scheduling for infrastructure as a service (IaaS) in cloud computing: Challenges and opportunities,” Journal of Network and Computer Applications, 68(2016), 173–200, 2016, doi:10.1016/j.jnca.2016.04.016.
- S. Goyal, “Public vs Private vs Hybrid vs Community – Cloud Computing: A Critical Review,” International Journal of Computer Network and Information Security, 6(3), 20–29, 2014, doi:10.5815/ijcnis.2014.03.03.
- C. Stergiou, K.E. Psannis, B.G. Kim, B. Gupta, “Secure integration of IoT and Cloud Computing,” Future Generation Computer Systems, 78(2018), 964–975, 2018, doi:10.1016/j.future.2016.11.031.
- N. Pavón-Pulido, J.A. López-Riquelme, R. Torres, R. Morais, J.A. Pastor, “New trends in precision agriculture: a novel cloud-based system for enabling data storage and agricultural task planning and automation,” Precision Agriculture, 18(16), 1038–1068, 2017, doi:10.1007/s11119-017-9532-7.
- M.A. Zamora-Izquierdo, J. Santa, J.A. Martínez, V. Martínez, A.F. Skarmeta, “Smart farming IoT platform based on edge and cloud computing,” Biosystems Engineering, 177(2019), 4–17, 2019, doi:10.1016/j.biosystemseng.2018.10.014.
- E.A. Shammar, A.T. Zahary, “The Internet of Things (IoT): a survey of techniques, operating systems, and trends,” Library Hi Tech, 38(1), 5–66, 2019, doi:10.1108/LHT-12-2018-0200.
- J. Qiu, Z. Tian, C. Du, Q. Zuo, S. Su, B. Fang, “A survey on access control in the age of internet of things,” IEEE Internet of Things Journal, 7(6), 4682–4696, 2020, doi:10.1109/JIOT.2020.2969326.
- R. Zheng, T. Zhang, Z. Liu, H. Wang, “An EIoT system designed for ecological and environmental management of the Xianghe Segment of China’s Grand Canal,” International Journal of Sustainable Development and World Ecology, 23(4), 372–380, 2016, doi:10.1080/13504509.2015.1124470.
- X. Li, D. Li, J. Wan, A. V. Vasilakos, C.F. Lai, S. Wang, “A review of industrial wireless networks in the context of Industry 4.0,” Wireless Networks, 23(1), 23–41, 2017, doi:10.1007/s11276-015-1133-7.
- M. Torres-Ruiz, J.H. Juárez-Hipólito, M.D. Lytras, M. Moreno-Ibarra, “Environmental noise sensing approach based on volunteered geographic information and spatio-temporal analysis with machine learning,” in Lecture Notes in Computer Science (including subseries Lecture Notes in Artificial Intelligence and Lecture Notes in Bioinformatics), 95–110, 2016, doi:10.1007/978-3-319-42089-9_7.
- J.H.J. Hipólito, M.A.M. Ibarra, M. Torres-Ruiz, G. Guzmán, R. Quintero, Innovation on user-generated content for environmental noise monitoring and analysis in the context of smart cities, 490–519, 2018, doi:10.4018/978-1-5225-7033-2.ch021.
- A. Kumar, M. Zhao, K.J. Wong, Y.L. Guan, P.H.J. Chong, “A comprehensive study of IoT and WSN MAC protocols: Research issues, challenges and opportunities,” IEEE Access, 6(2018), 76228–76262, 2018, doi:10.1109/ACCESS.2018.2883391.
- K. Zkik, G. Orhanou, S. El Hajji, “A new secure framework in WSNs using ECC: Medical application,” in Proceedings of 2017 International Conference on Engineering and Technology, ICET 2017, 1–7, 2018, doi:10.1109/ICEngTechnol.2017.8308144.
- T. hoon Kim, C. Ramos, S. Mohammed, Smart City and IoT, Future Generation Computer Systems, 159–162, 2017, doi:10.1016/j.future.2017.03.034.
- F. Xiao, Q. Miao, X. Xie, L. Sun, R. Wang, “Indoor Anti-Collision Alarm System Based on Wearable Internet of Things for Smart Healthcare,” IEEE Communications Magazine, 56(4), 53–59, 2018, doi:10.1109/MCOM.2018.1700706.
- M. Al-Kuwari, A. Ramadan, Y. Ismael, L. Al-Sughair, A. Gastli, M. Benammar, “Smart-home automation using IoT-based sensing and monitoring platform,” in Proceedings – 2018 IEEE 12th International Conference on Compatibility, Power Electronics and Power Engineering, CPE-POWERENG 2018, 1–6, 2018, doi:10.1109/CPE.2018.8372548.
- W. He, G. Yan, L. Da Xu, “Developing vehicular data cloud services in the IoT environment,” IEEE Transactions on Industrial Informatics, 10(2), 1587–1595, 2014, doi:10.1109/TII.2014.2299233.
- N.A. Nawaz, A. Waqas, Z.M. Yusof, A.W. Mahesar, A. Shah, “WSN based sensing model for smart crowd movement with identification: An extended study,” Journal of Theoretical and Applied Information Technology, 95(5), 975–988, 2017.
- X. Li, J. Niu, S. Kumari, F. Wu, A.K. Sangaiah, K.K.R. Choo, “A three-factor anonymous authentication scheme for wireless sensor networks in internet of things environments,” Journal of Network and Computer Applications, 103(2018), 194–204, 2018, doi:10.1016/j.jnca.2017.07.001.
- M.J. McGrath, C.N. Scanaill, M.J. McGrath, C.N. Scanaill, Sensor Network Topologies and Design Considerations, 79–95, 2013, doi:10.1007/978-1-4302-6014-1_4.
- D.L. Guidoni, F.S.H. Souza, J. Ueyama, L.A. Villas, “RouT: A routing protocol based on topologies for heterogeneous wireless sensor networks,” IEEE Latin America Transactions, 12(4), 812–817, 2014, doi:10.1109/TLA.2014.6868887.
- H.R. Faragardi, H. Fotouhi, T. Nolte, R. Rahmani, “A Cost Efficient Design of a Multi-sink Multi-controller WSN in a Smart Factory,” in Proceedings – 2017 IEEE 19th Intl Conference on High Performance Computing and Communications, HPCC 2017, 594–602, 2018, doi:10.1109/HPCC-SmartCity-DSS.2017.77.
- E. Fadel, V.C. Gungor, L. Nassef, N. Akkari, M.G. Abbas Malik, S. Almasri, I.F. Akyildiz, “A survey on wireless sensor networks for smart grid,” Computer Communications, 71(2015), 22–33, 2015, doi:10.1016/j.comcom.2015.09.006.
- H. Toral-Cruz, F. Hidoussi, D.E. Boubiche, R. Barbosa, M. Voznak, K.I. Lakhtaria, A survey on wireless sensor networks, 171–210, 2015, doi:10.4018/978-1-4666-8687-8.ch006.
- R. Zhu, Y. Qin, J. Wang, “Energy-aware distributed intelligent data gathering algorithm in wireless sensor networks,” International Journal of Distributed Sensor Networks, 7(1), 235724, 2011, doi:10.1155/2011/235724.
- A. Waheed Khan, A.H. Abdullah, M.H. Anisi, J. Iqbal Bangash, “A comprehensive study of data collection schemes using mobile sinks in wireless sensor networks,” Sensors (Switzerland), 4(2), 2510–2548, 2014, doi:10.3390/s140202510.
- I.A.T. Hashem, I. Yaqoob, N.B. Anuar, S. Mokhtar, A. Gani, S. Ullah Khan, “The rise of ‘big data’ on cloud computing: Review and open research issues,” Information Systems, 47(2015), 98–115, 2015, doi:10.1016/j.is.2014.07.006.
- E.N. Sharad, I.K. Aulakh, “Evaluation and implementation of cluster head selection in WSN using Contiki/Cooja simulator,” Journal of Statistics and Management Systems, 23(2), 407–418, 2020, doi:10.1080/09720510.2020.1736324.