Comparison of Gaze Points Among Viewing Conditions (Resolution, Display Size, Viewer Position) During Video Viewing
 , Yusuke Nosaka, Reiko Koyama, Riko Nakagawa, Takuya Sarugaku, Mitsuho Yamada
Adv. Sci. Technol. Eng. Syst. J. 5(6), 391–397 (2020);
 DOI: 10.25046/aj050646
Ultra-high resolution broadcasting such as 4K and 8K are becoming more popular for at-home use. The position of the viewer’s mean gaze point when they are looking at a larger display depends on the video clip, viewing position, and viewing distance. The International Telecommunication Union provided the document BT-2022; as the standard viewing conditions for the subjective evaluations of flat-panel TV displays. However, it is rare that a television is viewed at home under standard viewing conditions. In most homes, a TV of any size is watched from the viewer’s desired position according to the layout size of the room hosting the TV. No study has been conducted to determine how the movement of a viewer’s line of sight changes when a display with different resolution is viewed from a position different from the standard viewing condition. If the gaze position when viewing TV differs due to the difference in resolution, the size of the display, and the difference in observation position, it affects the method of TV production. This would also affect consumers considering the resolution, installation location, and viewing location of a TV. Here, we clarified that the mean gaze position and its standard deviation are almost the same viewing conditions (i.e., resolution, display size, and viewing position) are changed, even when the same contents are viewed. Our findings demonstrate that consumers could buy a display of their preferred resolution and size according to their room layout.
1. Introduction
In Japan, high-definition broadcasting with a resolution of 2K has become widespread, and the public use of ultra-high-definition 4K and 8K broadcasting began on December 1, 2018. In the International Telecommunication Union (ITU-R) document ‘BT-2022’ (‘General viewing conditions for subjective assessment of quality of SDTV and HDTV television pictures on flat panel displays’), the standard viewing distance for a television’s display is defined as the maximum distance at which a person with a visual acuity of 1.0 can see the pixel structure [1]. Since the current HDTV broadcasting has approx. 2 million pixels at 1920×1080, the standard viewing distance when watching HDTV images is 3H (H; Display height). In contrast, 4K broadcasting has ~ 8 million pixels at 3840×2160, and that of 8K broadcasting has ~ 33 million pixels at 7680×4320.
It was reported that when the resolution becomes higher, the pixel structure cannot be seen even when one is approaching it, and thus it is possible to view from a closer distance and enjoy a wide-angle image [2]. The ITU-R stipulates that a viewer should watch from the center of the front of the screen even when approaching the screen, but at each home, the viewing position differ depending on the room layout, the number of viewers, the size of the TV purchased, and more. The display is frequently viewed from sites that are not at the center of the screen. According to a survey of TV viewing positions, the positions spread horizontally ±60° and vertically ±30°, and 37% of viewers look at the display from the right side of the TV, only 3% from the center, and 60% from the left side [3]. When watching a movie on a large screen, the impression of the movie varies greatly depending on the position of the viewer’s seating, such as the center of the screen, the left and right edges of the front seats, and the rearmost seats. However, no research has examined how the position of the content where a viewer views on a TV display changes depending on the position of the viewer’s seating. If the content is viewed differently depending on the seating position, the producers of televised content must consider the effects of the viewing position when producing the content. Consumers seeking a TV to purchase also need to consider where to put the TV and furniture.
A study of the differences in the viewing of contents depending on the TV’s resolution compared NTSC; analog color system with (525 scanning lines) and high-definition (1,125 scanning lines) [4]. In the low-resolution NTSC, the viewer’s gaze points are distributed in the center of the screen because multiple cameras are switched in order to provide the camera shot that the content’s director wants to show in the center. In high-definition, the entire screen is displayed, and the viewers’ gaze points are spread over the entire screen. Several research groups have verified the differences in viewing distance by using parameters such as screen size, display brightness, resolution, and video content [5-8]. In those studies, the contents were viewed from the center position of the display, and the viewing position was not changed in the horizontal or vertical direction. In addition, an NTSC or phase alternating line (PAL) system was used (not higher-definition 4K), and the results cannot always be applied to a 4K or 8K display. In the present study, using 4K high-definition images that have never been used, we examined the differences in viewers’ lines of sight when they were watching television from a distance that is not the standard viewing distance and from various positions (right, center or left). Viewing 4K or 8K ultra-high-definition TV with large-screen images from a wide field of view at a short distance has become established in for home use. As a result, viewers are more likely to see at various viewing positions, not limited to the center of the screen, as seen in movie theaters, but there is no study that examined the effect of viewing position on viewing behavior from eye movements. Therefore, our present findings will provide meaningful data for both viewers and video producers to know whether or not the observation position affects the gaze position.
The purpose of our research is to objectively evaluate the psychological effects of changes in display resolution, size, and viewing position on viewing behavior from eye movements. For that purpose, two kinds of experiments were conducted.
In Experiment 1, we analyzed the influence of the display resolution on the viewing positions of individuals watching three video clips on the display. We showed the subjects a video clip whose resolution was 4K (3840×2160), 2K (1920×1080) or 1K (960×540) at the viewing distance of 0.75H. In Experiment 2, we analyzed the influence of the size of the screen on the viewing position. We showed the subjects a video clip whose screen size was 1/1, 1/2 or 1/4 at 0.75 H as the viewing distance [9].
2. Experimental Method
2.1. Experimental equipment
When viewing a 4K image at the viewing distance of 1.5H, the field of view is 60°. The range that a human being can see by using only saccades, which is a high-speed eye movement, is up to 15° [10]. Head movements are used together with eye movements to exceed the 15° range. It was reported that head movements contributed twice as much as the eye movements when moving the line of sight to fixate at one point [11]. It is also known that in the ratio of head movement to the line of sight, the head share becomes 60%-80% when the line of sight moves outside a 30° range [12, 13]. We thus surmised that in this experiment, it was necessary to detect changes in the line of sight that included the addition of the subjects’ head movements to their eye movements. We used the line-of-sight measuring device developed in our laboratory [14]. The accuracy of the horizontal direction was approx. 1.5° to -1.7° at ±30° corresponding to the visual angle of the display edge at 1.5H. The accuracy of the perpendicular direction was approx. 2.6° to -1.4° at ±18°, corresponding to the visual angle of the display edge at 1.5H [4]. We measured eye movements (EMR-8B; Nac Image Technology, Tokyo) and head movements (3DM-GX4; Microstrain, Williston, VT, USA). Data were recorded at 60 Hz. In the experiment, the subjects looked at the display in a free posture without being fixed on the head-chin rest of the experimental set-up.
2.2. Viewing conditions
The viewing distance of the display was fixed at 1.5H, and the subject was allowed to view the display from three positions: the center (display center), the right (1/4 to the right from the display center), and the left (1/4 to the left from the display center) as shown in Figure 1. The standard viewing distance for image-quality evaluations is not 1.5H when the image resolution is 2K or 1K, or when the screen size is 1/2 or 1/4: however, in a most households, the room layout is prioritized, and the viewing distance often does not change even if the screen resolution or size changes. We therefore fixed the viewing distance. Since the subjects’ head movements were measured simultaneously with their eye movements, the subject’s head movements were not restricted and the subject was instructed to watch the TV in a natural posture. The subjects watch videos with three types of resolution, three screen sizes, and three viewing positions, but each subject was prevented from seeing the same image more than once. This experiment was conducted according to BT-2022 and followed the Ethical Provisions of Tokai University’s guidelines for “Research using humans.”
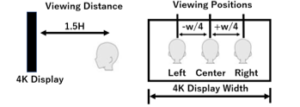
Figure 1: Viewing conditions.
2.3. Laboratory environment
The video clips were presented to a 4K projector (VPL-VW 500ES; Sony, Tokyo) using a personal computer (PC) as the signal source. The height of the screen was 147 cm, the width of the screen was 262 cm, and the screen brightness was 0.04 cd/m2 at the minimum and 104 cd/m2 at the maximum. The illuminance in the room was 69.7 Lux. The layout of the laboratory, the procedure of the experiment, and the selection of subjects were based on BT-2022.
2.4. Changes in gaze position due to the difference in resolution (Experiment 1)
The details of the video clips used in Experiment 1 are shown in Table 1 and in Figures 2-4 (scenes used for video clips 1-3). The 4K video clips consisted mainly of natural scenes (mountains, flowers, seas) and were downloaded from a free video clips material website [15]. The 4K video clips were recorded in the 60p/XAVCS format, which is also used for broadcasting, and have low compression. Each video clip length was 40 sec. The series of 4K video clips was edited to a length of approx. 4 min with the use of nonlinear editing software (VegasPro13; Sony). The 2K and 1K video clips were down-converted from 4K video clips using the same nonlinear editing software. A still video showing the fixation point in the center was inserted before and after each video clip presented to the subject, so that it could be recognized even if the calibration of the eye movement was misaligned. The subjects were 25 college students (10 males and 15 females) in their twenties, seven of whom had the visual acuity score of >1.0: the other 18 had the visual acuity score of 0.7 (including corrected vision). We analyzed the data of 21 of the 25 subjects (seven males, and 14 females) because four subjects had a large number of measurement errors during the experiment. No subject viewed the same image more than once. Each subject was randomly determined which image to view at which resolution and viewing position.
Table 1: Video clips used in Experiment 1
| Video clip | Time | Resolution |
| Video clip 1:
River, ship or bridge |
4 min 14 sec | 4K, 2K and 1K |
| Video clip 2:
Cherry blossoms or Mt. Fuji |
4 min 2 sec | 4K, 2K and 1K |
| Video clip 3:
Town or animal |
4 min 9 sec | 4K, 2K and 1K |
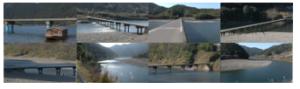
Figure 2: Scenes used for video clip 1.

Figure 3: Scenes used for video clip 2.
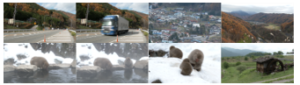
Figure 4: Scenes used for video clip 3.
2.5. Changes in gaze position due to the difference in screen size (Experiment2)
The details of the video clips used in Experiment 2 are shown in Table 2 and Figures 5-7 (scenes used for video clips 1-3). The video clips were edited as in Experiment 1, and 1/4-size and 1/2-size video clips were generated by reducing the number of pixels from 4K video clips using the nonlinear editing software. The subjects were 24 college students (nine males and 15 females) in their twenties, eight of whom had a visual acuity score of >1.0: the other 16 had a visual acuity score of 0.7 (including corrected vision).
Nineteen of the 24 subjects also participated in Experiment 1. There were no measurement errors in the data of all 24 subjects, and all were used for analysis. No subject viewed the same image more than once. Each subject was randomly determined which image to view at which screen size and viewing position.
Table 2: Table 2. Video clips used in Experiment 2
| Video clip | Time | Screen size |
| Video clip 1:
Flowers |
4 min 7 sec | 1/4, 1/2, 1/1 size of 4K |
| Video clip 2:
Okinawa |
4 min 2 sec | 1/4, 1/2, 1/1 size of 4K |
| Video clip 3:
Yokohama |
3 min 14 sec | 1/4, 1/2, 1/1 size of 4K |

Figure 5: Scenes used for video clip 1.

Figure 6: Scenes used for video clip 2.

Figure 7: Scenes used for video clip 3.
3. Results
The distribution of the gaze points of each subject was analyzed while the subject viewed the video clips. We used 10 deg/s as the threshold speed for extracting the gaze point from the gaze movement [16]. The horizontal and vertical components of gaze were calculated by the following formulas.
Horizontal components of Gaze = Horizontal components of Eye movement + Horizontal components of Head rotation
Vertical components of Gaze = Vertical components of Eye movement + Vertical components of Head rotation
The mean gaze position and its standard deviation (std. dev.) during viewing have often been used to compare the gaze behaviors of individual watching video clips [4]. We thus calculated the mean gaze position and its std. dev. from the remaining 4 minutes of data excluding the 1 minute immediately after the presentation of the video clips, at which point the data were not stable.
The mean gaze point position and the std. dev. of the mean gaze point distribution showed the same tendencies in all three video clips, and we therefore analyzed the data of the three video clips together. We performed a two-way analysis of variance (ANOVA) to analyze the results. The level of significance was set at 10%.
3.1. Results of Experiment 1: Change in gaze position due to the difference in display resolution (Experiment 1)
During the measurement of a person’s gaze, there may be many blinks, or the eye movement sensor may shift, causing an error in eye movement. Of the 21 subjects test in Experiment 1, the seven subjects who had almost no measurement error during the measurements for all the 1K, 2K, and 4K video clips were used for the analysis in order to perform statistical analysis with all the accurate data, because, it is extremely difficult to perform all experiments completely without measurement errors due to the nature of eye movement measurement. Figure 8 shows the averages and standard deviations of the mean gaze point positions of these seven subjects. In the figure, the center of the screen is 0°, and the angles displayed on the horizontal and vertical axes represent the viewing angles used by the subject. Figure 9 shows the mean gaze positions obtained by summarizing the results of the three viewing positions for each resolution.
The mean gaze position at the left and right viewing positions was around the center of the screen, and the average gaze position at the central viewing position was slightly left of the center of the screen regardless of the resolution, as shown in Figure 8. In the summary of the results of the three viewing positions, the mean gaze position is located at the center of the screen regardless of the differences in resolution, as shown in Figure 9. These results suggest that there was a slight difference in the mean gaze position depending on the viewing position, but it was not due to the difference in display’s resolution.
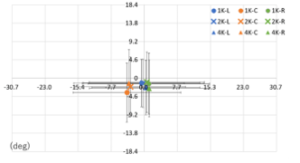
Figure 8: Averages of the mean gaze position and std. dev. (resolution and viewing position)
The results of the two-way ANOVA for mean gaze position with resolution and viewing position as variables are illustrated in Figure 10. No significant differences were observed for resolution, but a multiple comparison analysis revealed a significant difference in viewing position in the right-central and left-central positions. No significant differences were detected in the std. dev. of mean gaze position as shown in Figure 11; however, there was a slight but significant difference in viewing positions at the 10% level of significance.
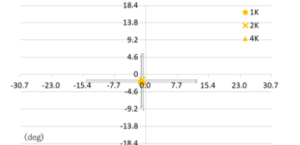
Figure 9: Averages of the mean gaze position and std. dev. (resolution).
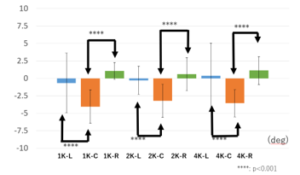
Figure 10: Results of the two-way ANOVA for mean gaze position (resolution).
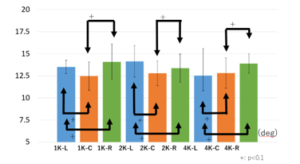
Figure 11: Results of the two-way ANOVA for the std. dev. of mean gaze position (resolution).
3.2. Results of Experiment 2: Change in gaze position due to the difference in screen size (Experiment 2)
In Experiment 2, of the 24 subjects, eight who had almost no measurement error during the measurements for all of the 1K, 2K, and 4K video clips were used for the analysis to perform the same accurate statistical analysis as in Experiment 1. The average mean gaze position of these eight subjects who viewed 1/4-, 1/2- and 1/1-size video clips at each viewing position is shown in Figure 12. Figure 13 provides the mean gaze positions obtained by summarizing the results of the three viewing positions for each resolution. In this experiment, since only the screen size was changed without changing the viewing distance, the angle of viewing the screen expected from the subjects would be 1/4 and 1/2 for the 1/4 and 1/2 sizes, respectively. Therefore, to examine whether each subject gazed at the same place in the display and had the same gaze range, we normalized these graphs to the 4K 1/1 size.
The results for a 1/4-size image (Fig. 12) indicated that the subjects viewed the area to the right of the center screen from the left and central viewing positions, and they viewed the screen center from the right viewing position. The results for a 1/2-size image (Fig. 12) revealed that the subjects viewed the area to the right of the center screen from the right and central viewing positions, and they viewed the lower right of the screen from the left viewing position. The results for a 1/1-size image (Fig. 12) demonstrated that the subjects viewed the area to the right of the center screen from the right and central viewing positions, and they viewed the screen center from the left viewing position. The results shown in Figure 12 suggest that the mean gaze position depending on the viewing position tended to change slightly when the size of the screen becomes small. According to Figure 13, the average of the results for all subjects and all viewing position regardless of the screen size shows that the mean gaze position falls in the area to the right of the center screen.
The results of the two-way ANOVA for mean gaze position are illustrated in Figure 14, and those of the two-way ANOVA for the standard deviation of the mean gaze position are shown in Figure 15. No significant differences in the size of the screen or in viewing position were revealed by the two-way ANOVA. Although the mean gaze position tended to change slightly depending on the viewing position when the screen size and viewing position changed, the mean gaze position and the standard deviation of the mean gaze position did not show significant differences.
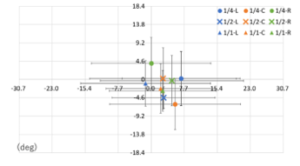
Figure 12: Averages of the mean gaze position and std. dev. (screen size and viewing position).
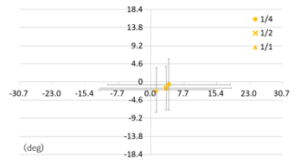
Figure 13: Averages of the mean gaze position and std. dev. (screen size).
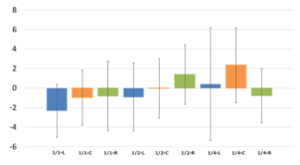
Figure 14: Results of the two-way ANOVA for mean gaze position (screen size).
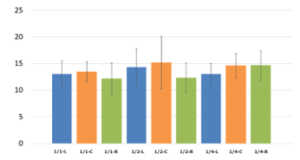
Figure 15: Results of the two-way ANOVA for the std. dev. of the mean gaze position (screen size).
4. Discussion
There were no significant differences in the mean gaze position or the standard deviation of the average gaze position due to differences in resolution, even when the viewing position was changed. Similarly, even when the viewing position was changed, no significant differences were found in the average gaze position or the standard deviation of the mean gaze position due to differences in screen size.
The tendency for the initial gaze position to fall at the center of the image when looking at a still image is called center bias. Photographer bias and viewing strategies have been suggested to be major factors in center bias [7]. Photographer bias is the practice of placing an object or the actor in whom the photographer is most interested near the center of the screen. With respect to viewing strategies, people usually turn their eyes to the center of the image, having learned through frequent experience with photographer bias that objects that attract attention are generally arranged around the center of the screen. We believe that our present results in which the subjects watched the screen center regardless of differences in resolution and the size of the screen demonstrate a tendency similar to center bias; that is, while center bias is defined as a tendency to look to the center of a still image, our subjects looked to the center of video clips, rather than still images.
5. Conclusion
Broadcasting in 4K and 8K ultra-high-definition video has started, and viewers can enjoy high-definition, wide-angle video near the display. The conditions for subjectively evaluating a display are strictly defined by the ITU-R. Subjective evaluations of displays by broadcasters and manufacturers are performed under these conditions. However, in the home where the display is actually located, the display is viewed at a free position according to the size of the TV, the layout of the room, and structure of the household. For example, when watching a movie in a large-screen movie theater, the viewers experience a different sense of presence and emotion after viewing from the seats at the left and right ends of the front row, the seats at the center of the movie theater, and the seats at the rear. Television broadcasting is also expected to be viewed from various positions in the home by viewing a high-definition, wide-field display. If the impression produced by the image differs depending on the viewing position, it is necessary for the consumers as well as the image producers and the display manufacturers to take this into consideration.
However, the evaluations of displays are performed according to the ITU-R and are rarely performed under the different conditions. Our present experiments show that the mean gaze position during viewing depends on the video clips, the viewing position, and the viewing distance, with the size and resolution of the display fixed and the viewing position as a parameter [17]. This research was conducted with a constant display size and resolution, but in reality, displays with various resolutions and sizes are found in various homes, and it has been necessary to investigate the effects of resolution and size. Therefore, in Experiment 1, we used the resolution and the viewing position as parameters, and in Experiment 2, the screen size and the viewing position were used as parameters, and the mean gaze position and its standard deviation were analyzed. In analyses of the gaze behavior of still images such as photographs, the average gaze position and the variance of gaze points are examined by heat maps and other methods, and there is a photographer bias that places the part that the photographer wants to show to the viewer in the center [18]. It is thus known that there is a center bias in which viewers empirically tend to see the center of the photograph [19].
In addition, regarding evaluations of the viewing of TV images, the mean gaze position and its standard deviation are often used to compare gaze behaviors while subjects watch video clips [4, 17], and we thus applied the mean gaze position and its standard deviation to the analysis of viewing behavior when the resolution, screen size, and viewing position were changed. When 4K-resolution content is viewed from 1.5H, the field of view seen from the eye is 60°. It was reported that the range of visual information that can be captured only by eye movements in daily activities is at most 15° [10]. We therefore, measured the line of sight (head movement + eye movement) with the subjects in a free posture without fixing the head in the device that we developed that can measure head movement and eye movement at the same time [14].
In Experiment 1, the resolution was changed to 1K, 2K, and 4K, and the mean gaze position and its standard deviation were obtained by changing the viewing position using the same-size display. The difference in the mean gaze position was seen by the difference in the viewing position. Notably, the mean gaze position was different between the central viewing position and the left and right viewing positions. There was a slight change in the standard deviation of the mean gaze position due to the difference in the viewing position. However, the changes in the mean gaze position and its standard deviation were slight.
In Experiment 2, the display size was changed to 1/4, 1/2, and 1/1, and the mean gaze position and its standard deviation were obtained by changing the viewing position using the same resolution. The mean gaze position and its standard deviation did not change even when the screen size was changed.
With the introduction of 4K and 8K broadcasting, broadcasting media and video contents have diversified. However, in each home, displays with various resolutions and sizes are being viewed at any viewing position. Our present results demonstrated that when the same content was viewed at different resolutions, screen sizes, and viewing positions, there was almost no change in the mean gaze position, which is one of the viewing behaviors. This means that video producers can engage in program production without needing to being aware of the resolution of the display to be viewed, the screen size, or the viewing position. In addition, consumers can purchase a display according to the size and layout of the room and their preferences, and watch their television from any position.
- Recommendation BT.2022 https://www.itu.int/rec/R-REC-BT.2022/en
- Y. Shishikui, “Super Hi-Vision R\&D,” NHK STRL R\&D, 137, 4-9, January, 2013.
- S. Kubota, A. Shimada, S. Okada, Y. Nakamura, E. Kido, “Television Viewing Conditions at Home,” The Journal of The Institute of Image Information and Television Engineers, 60(4), 597-603, 2006, doi: 10.3169/mta.7.112.
- M. Yamada, T. Fukuda, “Quantitative Evaluation of Eye Movements as Judged by Sight-Line Displacements,” SMPTE Journal, 95(12), 1230-1241 1986, doi: 10.5594/J04053.
- N. Narita, M. Kanazawa, F. Okano, “Optimum Screen Size and Viewing Distance for Viewing Ultra High-Definition and Wide-Screen Images,” The Journal of The Institute of Image Information and Television Engineers, 55(5), 773-780, May, 2001, doi: 10.3169/itej.55.773.
- M. Arbito, “Studies of the Infkuence of Display Size and Picture Brightness on the Preferred Viewing Distance for HDTV Program,” SMPTE J., 103(8), 517-522, August, 1994, doi: 10.5594/J06461.
- A.M. Lund, “The Influence of Video Image Size and Resolution on Viewing-Distance Preferences,” SMPTE J., 120(5), 406-415, May, 1993, doi: 10.5594/J15915.
- S. Kubota, K. Kishimoto, S. Goshi, S. Imai, Y. Igarashi, T. Matsumoto, H. Haga, T. Nakatsue, Y. Mano, Y. Kobayashi, “Preferred Viewing Distance for High Definition Television LCDs,” The Journal of The Institute of Image Information and Television Engineers, 65(8), 1215-1220, August, 2011, doi: 10.3169/itej.65.1215.
- R. Koyama, R. Nakagawa, M. Suganuma, S. Mochiduki, M. Yamada, “The Effect of Viewing Position by Changing Display Resolution and Display Size,” IMQA 2018, 103-109, September, 2018.
- A.T. Bahill, D. Adler, L. Stark, “Most naturally occurring human saccades have magnitudes of 15 deg or less,” Invest. Ophthalmol., 14(6), 468-469, 1975.
- B. Biguer, C. Prablance, M. Jeannerod, “The contribution of coordinated eye and head movements in hand pointing accuracy,” Experimental Brain Research, 55(3), 462-469, 1984, doi: 10.1007/BF00235277.
- M.A. Gresty, “Coordination of head and eye movements to fixate continuous and intermittent targets,” Vision Research, 14(6), 395-403, 1974, doi: 10.1016/0042-6989(74)90238-7.
- G.R. Barns, “Vestibulo-ocular function during co-ordinated head and eye movements to acquire visual targets,” The Journal of Physiology, 287, 121-147, 1979, doi: 10.1113/jphysiol.1979.sp012650.
- H. Takahira, K. Kikuchi, M. Yamada, “A System for Measuring Gaze Movement and Hand Movement Simultaneously for Hand-Held Devices,” The Institute of Electronics, Information and Communication Engineers Trans. Commun., E98-B(1), 51-61, January, 2015, doi: 10.1587/transcom.E98.B.51.
- “Royalty Free 4K HD Footage (XAVC S format).”, http://footage3.openspc2.org/HDTV/ footage/4K/60p/XAVCS/., May 10, 2018.
- R. Fukuda, M. Sakuma, E. Nakamura, T. Fukuda, “An Experimental Consideration on the Definition of a Fixation Point,” The Japanese Journal of Ergonomics, 32(4), 197-204, 1996, doi: 10.5100/jje.32.197.
- H. Takahira, S. Mochiduki, M. Yamada, “Analysis of Gaze Movement When Changing Viewing Distance and Viewing Position,” The IEICE Transactions on Information and Systems (Japanese Edition), J99-D(3), 293-306, March, 2016, doi: 10.14923/transinfj.2015PDP0005.
- P. H. Tseng, R. Carmi, I. G. M. Cameron, D. P. Munoz, L. Itti, “Quantifying Center Bias of Observers in Free Viewing of Dynamic Natural Xcenes,” Journal of Vision, 9(7-(4)), 1-16, 2009, doi: 10.1167/9.7.4.
- D. J. Parkhurst, E. Nieber, “Scene content selected by active vision,” Spatial Vision, 16(2), 125-154, 2003, doi: 10.1163/15685680360511645.
No related articles were found.