
The Contribution of Wind Energy Capacity on Generation Systems Adequacy Reliability using Differential Evolution Optimization Algorithm
Volume 5, Issue 6, Page No 331-340, 2020
Author’s Name: Athraa Ali Kadhem1,a), Noor Izzri Abdul Wahab1, Ahmed Abdalla2
View Affiliations
1Department of Electrical and Electronic Engineering, University Putra Malaysia, Selangor 43400, Malaysia
2Faculty of Electronics Information Engineering, Huaiyin Institute of Technology, Huai’an 223003, China
a)Author to whom correspondence should be addressed. E-mail: athraaonoz2007@yahoo.com
Adv. Sci. Technol. Eng. Syst. J. 5(6), 331-340 (2020); ![]() DOI: 10.25046/aj050640
DOI: 10.25046/aj050640
Keywords: Optimization Algorithms, Intelligent Search, Adequacy Systems

Export Citations
Currently, increasing penetration of the Wind Energy Conversion System (WECs) in Power generation systems has influenced the supply of electrical power reliability for the consumer in comparison with other traditional sources. In this paper, the performance and efficiency of a new optimization approach referred to as the “Differential Evolution Optimization Algorithm” (DEOA) to measure the reliability of power adequacy systems (RPAs). The proposed intelligent algorithm which relies on the Population-based Intelligent Search (PBIs) technique is viewed as a feasible alternative for the Monte Carlo simulation (MCS) method in the assessment of the non-chronological system. The benefit of utilizing this algorithm is apparent in the manner it expedites the calculation and achieves greater precision with less calculation effort. Additionally, there is a deeper understanding of the effect of the increasing levels of wind energy on generation adequacy from the WECs sources to satisfy future power electricity demands. In addition, the effectiveness of the suggested algorithm in assessing the RPAs was compared to the analytical and MCS method.
Received: 07 May 2020, Accepted: 30 October 2020, Published Online: 20 November 2020
1. Introduction
The inconsistent nature of wind energy presents challenges to the planners and operation personnel of power plants. Therefore, it is now crucially important to assess the extent that power impacts the dependability and sufficiency of the power being generated by existing plants. In assessing the penetration of the wind power from the WECs based on the nature of the wind can be complicated as it involves a number of critical issues that have to be taken into account when designing the WECs, such as the speed and power of the wind. To design a method for estimating wind production necessitates a massive amount of historical data of wind velocity so that the stochastic nature of the wind at a particular location can be accurately simulated. Another possible option could be to use a dependable stochastic simulation technique for the generation of the time series artificial of the wind speed.
Analyzing how adequate the PS is possible through the identification and evaluation of failure states, which are situations when customer demand for power cannot be met by the power system, hence, making it necessary to practice load shedding to ensure the maintenance of the system integrity. Due to the fact that there are numerous potential failure situations [1], [2], it may not be practicable to directly count and estimate it all even in cases of medium-size power systems.
Currently, RE sources usually combined with the conventional electrical grid for generating less polluting energy; as for example WTGs [3]. As a result, the estimation of the reliability index for unconcentrated resources such as wind energy is complicated [4]. As such, new tools need to be used to assess PS with the wide presence of wind energy sources [5].
Evaluating the dependability of PGS is typically performed by simulation or analysis approaches. The majority of authors in [6] focused on assessing the dependability of PGS in wind farms’ basis of analytic approaches. The MCS method offers an accurate estimate of the dependability indices. Therefore, the MCS would be beneficial for such a purpose, but it requires considerable computational work which is time-consuming and should be avoided if convergence efficiency is critical [7]. This research offers a replacement for the MCS and PBIs method [8],[9]. This optional approach method is used to identify a num ber of possible failure situations to facilitate the adequacy indices of the system.
Numerous PBIs approaches are possible for intelligent research, epitome for these algorithms like the BPSO, ISSPs, OGA, EC, BPSO, and BCA [10]–[13]. Although some research has been done on the dependability of the generating systems, there is still a need for approaches that are more appropriate and which offer greater computational flexibility and are more realistic in representing the desired PGS adequacy [14]–[17].
Models are needed for the simulation of the stochastic characteristic of PGS behavior, which is not a new issue for population-based intelligent research approaches. However, it has emerged as an important issue when wind sources and the PS are combined and taken into account. This paper suggested a novel algorithm known as “DEOA” to lower the time amount cost of the computation to simulation pattern in the non-SMCS and other Optimization Algorithms by enhancing the checking efficiency in a given area state-space employing a PBIs approach. DEOA is based on the meta- heuristics searching employed in simulating the generating system’s operation and taking into account the not expecting failure of current systems and the instability of “WECs” energy. DEOA exhibited benefits in the form of higher computational speed, utilizing a relatively uncomplicated structure, providing ease-of-use, and was shown to be highly robust. Besides, the numerically simulated solution was compared with the MCS-related Work. It also explains the impacts of wind energy capacity from the WECs on power systems to attain at the level of the incremental peak load capability.
| Nomenclature | |
| WECs | Wind Energy Conversion System |
| RPAs | Reliability of Power Adequacy Systems |
| PBIs | Population-Based Intelligent Search |
| DEOA | Differential Evolution Optimization Algorithm |
| MCS | Monte Carlo simulation |
| SMCS | Sequential Monte Carlo Simulation |
| PS | Power System |
| RE | Renewable Energy |
| WTGs | Wind Turbine Generators |
| PGS | Power Generation Systems |
| ISSP | Intelligent State Space Pruning |
| OGA | Optimization Genetic Algorithm |
| EC | Evolutionary Computation |
| PSO | Particle Swarm Optimization |
| BCA | Bee Colony Algorithm |
| LOLE | Loss of Load Expectation |
| LOEE | Loss of Energy Expectation |
| LOLF | Loss of Load Frequency |
| LDC | Load Duration Curve |
| RI | Reliability Indices |
| LH | load levels |
| PNS | Power Not Supplied |
| LOLP | Loss of Load Probability |
| WDM | Weibull distribution model |
| WPG | Wind Power Generation |
| BPSO | Binary Particle Swarm Optimizations |
| MSGA | Modified Simple Genetic Algorithm |
| RTS | Reliability Test System |
2. Assistant Theoretical Materials
2.1. Assessment of Conventional Generation Systems Adequacy
Analyzing the reliability of electrical energy systems is important to determine PGS adequacy and for possible future increase in the system capacity. This is to ensure adequate availability of power to satisfy consumer requirements for particular installed system capacity. As a result, the could be utilized as an element of the quantitative conditions in a power generation system in planning for the system’s risk paradigm. In this study, the essential evaluated were utilized in facilitating the approximation of the PS dependability level of their “Loss of Load Frequency (LOLF)”, “Loss of Energy Expectation (LOEE)”, and “Loss of Load Expectation (LOLE)”.
Load designs system are normally non-sequential or sequential paradigms that can be used with various Optimization Algorithms approaches. The sequential Load Duration Curve scheme (” LDC”) can, for epitome, can create values of load demand hourly states, the implication being that around “8736 Hours” separate states can be logged per annum [18]. The annual LDC approach for IEEE-RTS-79 – 96 is presented in Figure 1.
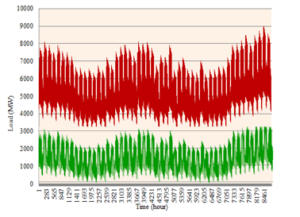
Figure 1: Annual LDC model for the RTS
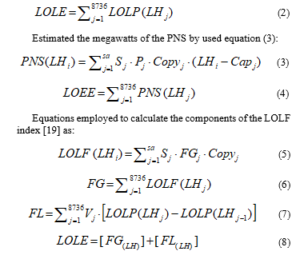
To attain elevated levels of RPAs and the PGS valuation, the best design of RI has an important role in designing and developing a successful generation system [19]. Estimates of the LOLE, LOEE, and LOLF are made based on the attained capacity states’ collections and load characteristics. In this study, denoted the discrete states for the load levels (LH) at a time (t). The “Loss of Load Probability” (LOLP) is estimated as equation (1):
![]()
where:
sa = total number of state arrays, and
Sj = status of the system state.
In a failure state, the status value will=1; while in a successful state, the status will=0, this refers to the status of the load demand satisfaction [20]. equation (2) displayed the values of the LOLE annually:
2.2. Wind Speed Paradigm
Simulating of wind speed/velocity to study WECs performance and dependability was done and reported by [21]. The sequential WECs simulation model involves the generation of hourly wind speed data over a given perio and specified site. The main challenge in maintaining the reliability of PGS is the fluctuation nature of wind power. It is therefore necessary to develop an appropriate wind velocity model before proceeding to analyze the system reliability.
The majority of research recently done dependent on the Weibull distribution model (WDM) to signify the hourly fluctuations in the annual mean wind velocity. The level of wind turbine generated power at a given wind site depends on the mean and standard variation of the wind velocity. Based on the assumption that the WDM is able to change particular variables such as the shape (b) and the scale (a), it is normally used for simulating wind speed fluctuations. Thus, the inverse transform function for the WDM in [22] in equation (9) can be employed to simulate the wind speed s.
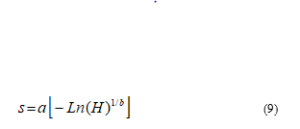
where; a and b = two parameters for the WDM;
H = random variable;
s = wind speed.
By applying the wind speed that generated by using the equation (9) to the wind turbine units output model, the turbine units power output is as shown in equation (10).
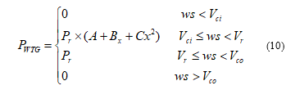
where
ws = wind speed (m/s),
Vci = WTG cut-in speed (m/s),
Vco = WTG cut-out speed (m/s),
Vr = WTG rated speed (m/s),
Pr = WTG rated power output (MW).
The constants A, Bx, and Cx have previously been calculated by [22].
3. Methodology
Two programs based on the simulation method have been developed using MATLAB. The first simulation program was developed to simulate the variations of wind speed using WDM, which was utilized for an estimation of the parameters “a” and “b”, that were deuced form wind speed data. Consequently, during the simulation process, the two parameters (a, b) will generate wind speed variations at any time. Additionally, the program can estimate a wind power result from the wind turbine. Figure 2 shows models for wind speed generation and output power simulation. The second simulation program is based on the DEOA technique to evaluate the dependability of the PGS and, wind power penetration consideration is incorporated in the generating capacity adequacy evaluation. According to the steps taken as stated in reference [22], the RI was calculated utilizing DEOA algorithm as shown in Figure 3.
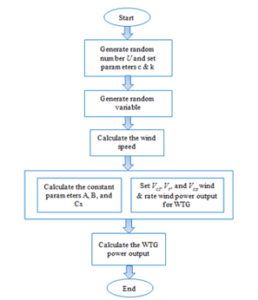
Figure 2: Diagram of speed and wind power for the turbine unit
4. Outcomes Analysis
4.1. Simulation Outcomes of Speed & Power Wind
This study explains the possibility to generate wind energy at different levels which parallel the probability of wind speed fluctuation, therefore, the wind power model can generate wind energy with different abilities states as instant at hourly. One of the features of the wind speed is that the turbine output power is determined subsequently when the hourly wind speed is obtained. The simulation of the profiles of the speed of the wind was employed to simulate ability states from the simulated generation of wind output power.
There is a need to examine the power output from the wind farm, to obtain a better picture of the selected site so that the WDM parameter, a, is set as the mean wind speed and b=2, is the usual wind characteristic [23]. The particular WTG characteristics employed here are the 4, 25, and 19 m/s (cut-in-speed, cut-out-speed, and rate speed) and at a rated power of 2 MW [22]. Figure 4 shows the forecast for hourly wind speed over a year, and also indicates the simulation wind power output for WTG (with 85 WTG) with a power rate of 2 MW for a similar period.
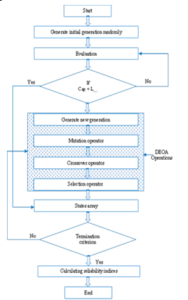
Figure 3: Diagram of reliability indices assessment using DEGA
4.2. Cases Running the Algorithm
This study develops and tests a method for evaluating the reliability of PGS using WECs with two dissimilar test systems (“IEEE-RTS-79” & “IEEE-RTS-96”), to validate how the DEOA performs to assess the dependability and sufficiency of the PGS. Meanwhile, it tests the efficiency of the proposed algorithm to evaluate multiple penetration-levels of wind energy.
The test systems “IEEE-RTS-79 and RTS -96” have 32 and 96 generating units respectively, with the capability to generate power ranging approximately from (12- 400 MW), with a total power supply of 3405 and 10215 MW respectively, at approximately (2850 MW) and (9000 MW) peak load [24], [25]. Figure 5 showing the diagram of the single area of the system RTS-79, and Figure 6 showing the outline of the RTS-96 of three-areas interconnected through merging three single areas from the RTS-79 system.
Run I: Valuation of Algorithm Performance for the “RTS-79” System
The designs of the variable control values for the proposed DEOA algorithm was documented as displayed in Table 1 [26], during applied at the “Test System- 79 & 96”
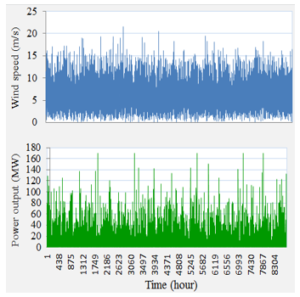
Figure 4: Wind forecasting and simulation of the wind MW generation for one year
The DEOA algorithm was applied for 100 iterations run consecutively in matching conditions as previously stated, to verify the robustness and confidence of this algorithm. The results of the various implementations are presented in Table 2. The results achieved from the DEOA were compared with those of [27]. Figures 7 and 8 show that following runs of 100 iterations, the values were wavering in the region of the real value. Repetitions of the runs of the experiment applying the algorithm displayed that this algorithm was highly accurate when determining the RI.
Table 1: The control values for the proposed algorithm
| Parameter |
DEOA (RTS-79) |
DEOA (RTS-96) |
| Population size | 60 | 100 |
| Generation limit | 100 | 150 |
| Crossover probability | 0.6 | 0.6 |
| System Capacity (MW) | 3405 | 10215 |
| Mutation probability High | 0. 1 | 0.6 |
| Mutation probability Low | 0.6 | 0.05 |
| Load max | 2850 MW | 9000 MW |
| Threshold probability | 1e-15 | 1e-20 |
| Stopping Repetitions | 100 | 150 |
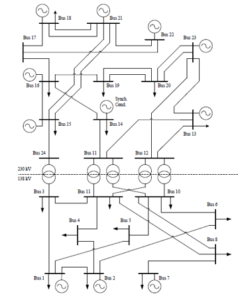
Figure 5: Diagram of single area for the system RTS-79
Table 2: The DEOA algorithm compare with analytical method through runs of the algorithm (100) times
| Method | Reliability Indices | Error (%) | |
| LOLE (hour/year) | LOEE (MWh/year) | ||
|
(Accepted value) Analytical method [30] |
9.39418 | 9.3670 | 0.28 |
|
(Experimental value) DEOA method |
1176.00 | 1120.00 | 4.76 |
The consequences outcomes of the DEOA algorithm were compared with those of other optimization genetic algorithms earlier mentioned in [28], [29], as shown in Table 3. Comparisons of these outcomes were made. The absolute values utilized for these comparisons were from a single turn one mploying “MSGA”, & “DEOA”.
The computation effort of the proposed method was also assessed and a comparison was made with those of “MSGA”, “MCS”, and “DEOA” as shown in Table 4. On the other hand, comparison of the simulated proposed method with MCS was halted when the coefficient of variation level was approximately 5% [29]. This comparison was performed with absolute values obtained from a single turn on of the DEGA and MSGA. Evaluating the computation time of the DEOA, as presented in Table 4 was shorter compared to other methods. Hence, the suggested DEOA exhibits benefits such as enhanced computation speed, by employing a simple structure.
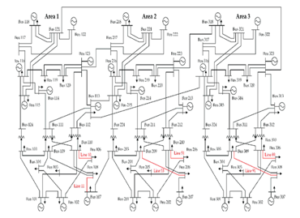
Figure 6: Diagram of three-areas interconnected for the system RTS-96
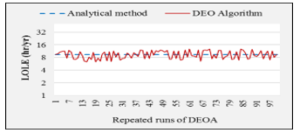
Figure 7: Calculation of estimated LOLE with 100 repeated runs for the RTS-79 System
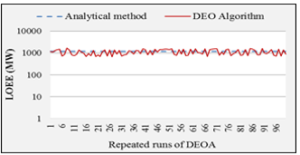
Figure 8: Calculation of estimated LOEE with 100 repeated runs for the system ‘RTS-79’
Table 3: Compare the DEOA algorithm RI results for RTS-79 with accepted value
| Reliability Indices | Experimental value | ||
| MCS [26] | MSGA [28] | DEOA | |
| LOLE (hour/year) | 9.371 | 9.324 | 9.370 |
| Error (%) | 0.244 | 0.745 | 0.255 |
| LOEE (MWh/year) | 1197 | 1163 | 1178 |
| Error (%) | -1.785 | 1.105 | -0.170 |
| LOLF (occ/year) | 1.9190 | 2.0030 | 2.300 |
| Error (%) | 0.00 | 4.37 | 19.85 |
Table 4: Comparison of the runs time between MSGA, DEOA, and MCS methods
| Techniques | Experimental value | ||
| MCS | MSGA | DEOA | |
| Runs= 200 | Runs= 750 | Runs= 100 | |
| LOLE (hour/year) | 9.541 | 9.324 | 9.37 |
| Time (sec) | 372 | 177 | 4 |
Run II: Valuation of Algorithm Performance for the “RTS-96”
In this run, the control parameters values had been setting beforehand as shown in Table 1. The tuning for the failures data for Generating stations was in line with previous data provided by [30]. The result of the DEOA was compared to those of Optimization algorithms declared by [31], as shown in Table 5.
In this paper, the percentage of error was considered, where the percentage error for individual values of the proposed DEOA algorithm was compared with individual values of the other techniques, as displayed in Tables 2, 3, and 5. On the other hand, the error percentage shows the effectiveness of the proposed DEOA algorithm in presenting separate values, large positive values of the error indicate a considerable deviation in the predicted value from the real one.
Table 5: Results of the RI for the system RTS-96 utilizing the DEOA method
| Techniques | Reliability Indices | |||
| LOLE (hour/year) | Error (%) | LOEE (MWh/year) | Error (%) | |
| Analytical method | 0.1380 | – | 24.26 | – |
| MCS Algorithm | 0.1400 | -1.44 | 23.97 | 1.195 |
| DEOA Algorithm | 0.140 | -1.44 | 26.21 | -8.037 |
Run III: Valuation of Performance SMCS with WPG for “RTS-79” System
In this study, the SMCS method was employed to recompute the RI (for RTS-79 System) for comparison with the DEOA algorithm. From the simulation, Figure 9 shows what the system is capable of based on the conventional and the unconventional units. Figure 10 however presents a whole PGS and what it is capacity of, based on the simulation of the process overlaid together with the sequential load model and Figure 11 shows the LOLE, LOEE, and LOLF for 200 selected SMCS sampling years.
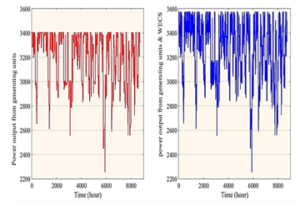
Figure 9: Available capacities obtained from conventional and unconventional units
Some intersections observable in Figure 10, which means that the available electrical power generation from the PGS insufficient for meeting the required load.
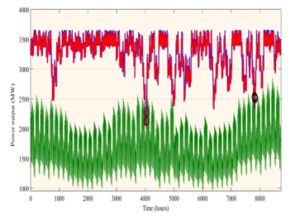
Figure 10: Simulation process shows the available capacities of the system, superimposition with the load paradigm
Run IV: Valuation of Reliability Indices for DEOA with WPG for “RTS-79” System
For peak demand load (2850MW) and 170 MW combined with wind energy, the RI the for “RTS-79” derived was from the Optimization Algorithm and the new proposed DEOA approach as shown in Table 6. The MCS might be utilized for choosing failure states for the systems. However, due to its reliance on proportionate sampling, its effectiveness in the detection of failure states could be diminished. According to the results indicated in Table 6, the SMCS method could lead to extremely poor convergence time. Additionally, the DEOA provides the most efficient computation as well as easy usage in comparison with other algorithms.
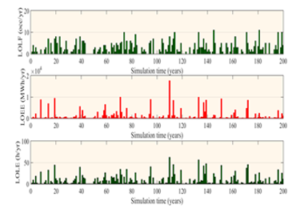
Figure 11: The reliability indices LOLE, LOEE, and LOLF for 200 samplings
Table 7 presents the outcomes of five models previously discussed [32] in comparison with those of DEOA. These techniques, computed the RI employing the MCS approach with variable wind Speed models (the actual wind speed recording data, Markov method, ARMA distribution model, Weibull distribution model, and Normal distribution). It was obvious that the outcomes derived from the use of the DEOA algorithm had values which were about the same as those obtained from using real wind speed data in the MCS approach.
Table 6: Comparison of the runs time between DEOA, BPSO, and SMCS Method
| Proposed Methods | LOLE (hour/year) | LOEE (MWh/year) | Time (Sec) |
| SMCS Algorithm | 7.550 | 941.070 | 64.641 |
| BPSO Algorithm | 7.430 | 823.780 | 8.979 |
| DEOA Algorithm | 7.450 | 1318.340 | 4.00 |
Table 7: Comparison between suggested methods in literature and proposed DEOA method
| Techniques | LOLE (hour/year) | LOEE (MWh/year) |
| MCS technique with Actual wind data | 7.450 | 908.70 |
| MCS technique with Markov model | 7.470 | 918.10 |
| MCS technique with ARMA method | 7.120 | 884.90 |
| MCS technique with Weibull model | 7.780 | 976.70 |
| MCS technique with Normal model | 6.950 | 858.50 |
| Proposed DEOA with Actual wind data | 7.450 | 1318.34 |
In real PGSs the LOLE index is used more often for the generation of adequacy analysis to determine sufficiency. On the other hand, the LOEE indicator is used for complex generating/transmitting of the adequacy analysis [33]. This means that outcomes presented in the tables are for assessing the PGS’s dependability and sufficiency, which took into account the level of precision of LOLE from the suggested DEOA approach with shorter computation time in comparison with other approaches.
The proposal of an intelligent algorithm to assess the PGS is shown as a feasible replacement for the Non-SMCS in the evaluation of the non-sequential systems. Thus, this algorithm lowered the computation time needed to calculate the Non-MCS approach, which is efficient but does not take into account time-based phenomena, including the frequent computation interruptions of the LOLF and the duration indicatots (LOLD). This means that outcomes in tables that assess the LOLF indicate poor precision from the suggested PBIs approaches with shorter computation time in comparison with other approaches.
Run V: Valuation of Reliability Indices with Wind Power Penetration for the “RTS-79” System Using DEOA
In this section, the DEO algorithm is applied to examine the effects of wind power capabilities generated from WTGs on power systems to attain dependability indicators at a similar level to additional peak load capacity. The Weibull distribution approach was employed to simulate hourly repeating wind speed. Figure 12 shows the the simulation results of the forecast forecast for hourly wind speed and wind power output for several installed WTG units with a power rate of 2 MW for a year. The number of additional wind turbines that have been attached to a PGS is commensurate with the proportions of the wind power incorporation. Where the rate of penetration of wind energy ranges from 5% – 30% generates the output of wind energy ranges from 170 – 1020 MW from number WTG units (from 85 – 510).
This paper also examines the choice an appropriate penetration level of wind energy to attain a level similar to that of traditional PGSs. The DEO algorithm was used to analyze the RTS-79 system cases with changes in the number of WTG units, and changes in the penetration level of wind energy.
The effect of the wind energy penetration rate as a result of the number of available WTG units was tested on the values of reliability indicators for generation systems. Table 8 shows the different wind energy penetration levels (%), the number of WTG units and the output power of the WTG units, as well as the values of reliability indicators LOLE, LOEE.
Table 8: The wind power penetration beside on reliability indexes and percentage of installed capacity
|
Wind Pen. Rate %
|
No. of WTG | Product Power (MW) | LOLE | LOEE |
| 5% | 85 | 170 | 7.45 | 1318 |
| 10% | 170 | 340 | 6.38 | 1364 |
| 15% | 255 | 510 | 5.44 | 1214 |
| 20% | 340 | 680 | 4.78 | 1256 |
| 25% | 425 | 850 | 3.93 | 1079 |
| 30% | 510 | 1020 | 3.60 | 1035 |
It is seen that the values of LOLE and LOEE are decreased for the RTS-79 system with additional WTG units. Figures 13 and 14 show LOLE and LOEE indicayors and the role of some of the WTG units added to RTS-79, where each WTG unit has a rated capacity of 2 MW.
Besides, it is noted that the LOLE value is lowered considerably in the event the wind energy penetration rate ranges from 5% to 20%; after which the rate of decline is relatively insignificant, implying that increasing the wind energy penetration to higher rates will have less effect in reducing the values of reliability indicators.
5. Conclusions
Both MCS and PBIs approaches have been used to assess the reliability of generating system combined with wind energy.
This paper presented a comprehensive performance clarification of the suggested technique for assessing the electric power systems dependability, such as; DEOA. The suggested intelligent algorithm which depends on the PBIs approach is viewed as a feasible alternative for the MCS in the assessment of non- sequential systems.
Furthermore, this study introduced the novel DEOA algorithm with WDM to assess the dependability of the PGSs combined with WTGs. It was shown that with the application of the proposed approach, it was likely that there would be simulation of the wind speed at a given hour for assessing the dependability of the power generation system. The main improvements achieved in this study are as presented below:
- Using the DEOA as an alternative to MCS for guided intelligent searches.
- The repeated runs of the experiment with the algorithm displayed the algorithm’s elevated precision level when determining the RI.
- Incorporating WTGs into the power generating system, to revise the dependability evaluation process to adapt to this change.
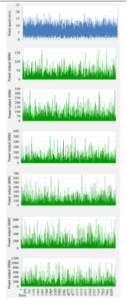
Figure 12: Wind forecasting and simulation of the generated wind energy for a year
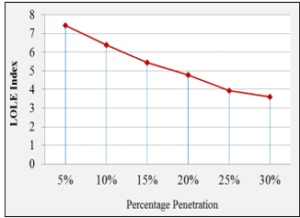
Figure 13: Shows the number of WTG units added to RTS-79 as a function for an estimate of the LOLE indices
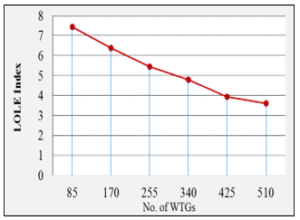
Figure 14: Shows the number of WTG units added to RTS-79 as a function for an estimate of the LOEE indices
On the other hand, RTS test system was used to make a comparison of the achievement of the DEOA with the conventional MCS to indicate the effectiveness of the proposed algorithm.
Besides, selecting an appropriate penetration level of wind power and determining its effect on the PGS and the essential element of investigating the potential of the wind energy source as a replacement for sustainable energy generation. Also, increasing the penetration rates of wind energy to higher rates will have less effect on reducing the values of RI.
- R. A. González-Fernández, A. M. Leite Da Silva, L. C. Resende, and M. T. Schilling, “Composite systems reliability evaluation based on Monte Carlo simulation and cross-entropy methods,” IEEE Transactions on Power Systems,28(4), 4598–4606, 2013, doi: 10.1109/TPWRS.2013.2267154.
- A. M. L. Da Silva, R. A. Gonzalez-Fernandez, S. A. Flavio, and L. A. F. Manso, “Composite reliability evaluation with renewable sources based on quasi-sequential Monte Carlo and cross entropy methods,” International Conference on Probabilistic Methods Applied to Power Systems (PMAPS), 1-6. 2014, doi: 10.1109/PMAPS.2014.6960618.
- M. H. Moradi and M. Abedini, “A combination of genetic algorithm and particle swarm optimization for optimal DG location and sizing in distribution systems,” Electrical Power & Energy Systems, 34(1), 66-74, 2012. doi: 10.1016/j.ijepes.2011.08.023.
- Y. Zhang, A. A. Chowdhury, and D. O. Koval, “Probabilistic wind energy modeling in electric generation system reliability assessment,” IREP-Bulk Power System Dynamics and Control-VII Conference, 1–8, 2010, doi: 10.1109/TIA.2011.2127435.
- R. Karki, D. Dhungana, and R. Billinton, “An Appropriate Wind Model for Wind Integrated Power Systems Reliability Evaluation Considering Wind Speed Correlations,” Appled Scinces, 3, 107–121, 2013. doi: 10.3390/app3010107.
- S. H. Karaki, B. A. Salim, and R. B. Chedid, “Probabilistic model of a two-site wind energy conversion system,” IEEE Transactions on Energy Conversion, 17(4), 530–536, 2002. doi: 10.1109/TEC.2002.805215.
- H.J. Jayatheertha, “Evaluation of Composite Electric System Performance Indices Using Sequential Monte Carlo Simulation,” International Journal of Advanced Engineering Research and Studies, 21(2), 1–4, 2012.
- L. Wang, C. Singh, and K. C. Tan, “Reliability evaluation of power-generating systems including time-dependent sources based on binary particle swarm optimization,” in 2007 IEEE Congress on Evolutionary Computation (CEC), 3346–3352, 2007. doi: 10.1109/CEC.2007.4424904.
- L. Wang and C. Singh, “Population-based intelligent search in reliability evaluation of generation systems with wind power penetration,” IEEE Transaction on Power System, 23(3), 1336–1345, 2008. doi: 10.1109/TPWRS.2008.922642.
- M. Benidris and J. Mitra, “Use of intelligent search methods in performing sensitivity analysis of power system reliability indices,” The PES General Meeting, Conference & Exposition, National Harbor, MD, 2014, doi: 10.1109/PESGM.2014.6939915.
- R.C. Green II, L. Wang, and M. Alam, “Intelligent State Space Pruning with Local Search for Power System Reliability Evaluatio,” in 2012 IEEE PES Innovative Smart Grid Technologies Europe (ISGT), 1-8, 2012.
- S.J. Huang and X. Z. Liu, “Application of artificial bee colony-based optimization for fault section estimation in power systems,” Electrical Power & Energy Systems, 44(1), 210–218, 2012. doi: 10.1016/j.ijepes.2012.07.012.
- R.C. Green, Z. Wang, L. Wang, M. Alam, and C. Singh, “Evaluation of loss of load probability for power systems using intelligent search based state space pruning,” in 2010 IEEE the Probabilistic Method Applied to Power Systems (PMAPS), 319–324, 2010, doi: 10.1109/PMAPS.2010.5528892.
- A. Ali Kadhem, N. I. Abdul Wahab, I. Aris, J. Jasni, and A. N. Abdalla, “Computational techniques for assessing the reliability and sustainability of electrical power systems: A review,” Renewable and Sustainable Energy Reviews, 80, 1175–1186, 2017. doi: 10.1016/j.rser.2017.05.276.
- A. Almutairi, M. H. Ahmed, and M. M. A. Salama, “Probabilistic generating capacity adequacy evaluation: Research roadmap,” Electric Power Systems Research, 129, 83–93, 2015. doi: 10.1016/j.epsr.2015.07.013.
- J. Lin, L. Cheng, Y. Chang, K. Zhang, B. Shu, and G. Liu, “Reliability based power systems planning and operation with wind power integration: A review to models, algorithms and applications,” Renewable and Sustainable Energy Reviews, 31, 921–934, 2014. doi: 10.1016/j.rser.2013.12.034.
- D. Saxena, S. N. Singh, and K. S. Verma, “Application of computational intelligence in emerging power systems,” International Journal Engineering Science Technology, 2(3), 1–7, 2010. doi: 10.4314/ijest.v2i3.59166.
- A.A. Kadhem, N. I. Abdul Wahab, and A. N. Abdalla, “Wind energy generation assessment at specific sites in a Peninsula in Malaysia based on reliability indices,” Processes, 7(7), 1-23, 2019. doi: 10.3390/pr7070399.
- R.A. Bakkiyaraj and N. Kumarappan, “Optimal reliability planning for a composite electric power system based on Monte Carlo simulation using particle swarm optimization,” Electrical Power & Energy Systems, 47(1), 109–116, 2013. doi: 10.1016/j.ijepes.2012.10.055.
- Ž. B. Rejc and M. Čepin,“Estimating the additional operating reserve in power systems with installed renewable energy sources,” Electrical Power & Energy Systems, 62, 654–664, 2014. doi: 10.1016/j.ijepes.2014.05.019.
- M. Mosadeghy, T. K. Saha, R. Yan, and S. Bartlett, “Reliability evaluation of wind farms considering generation and transmission systems,” the IEEE PES General Meeting Conference & Exposition, 1-5, 2014, doi: 10.1109/PESGM.2014.6939156.
- A.A. Kadhem, N. I. Abdul Wahab, I. Aris, J. Jasni, A. N. Abdalla, and Y. Matsukawa, “Reliability assessment of generating systems with wind power penetration via BPSO,” International Journal on Advanced Science, Engineering and Information Technology, 7(4), 1248–1254, 2017. doi: 10.18517/ijaseit.7.4.2311.
- A. K. Azad, M. G. Rasul, M. M. Alam, S. M. Ameer Uddin, and S. K. Mondal, “Analysis of wind energy conversion system using Weibull distribution,” International Conference on Mechanical Engineering (ICME), 90, 725–732, 2014, doi: 10.1016/j.proeng.2014.11.803.
- A. A. Kadhem, N. I. Abdul Wahab, I. Aris, J. Jasni, and A. N. Abdalla, “Reliability assessment of power generation systems using intelligent search based on disparity theory,” Energies, 10(3), 1-13, 2017. doi: 10.3390/en10030343.
- C. Grigg and P. Wong, “The IEEE reliability test system -1996 a report prepared by the reliability test system task force of the application of probability methods subcommittee,” IEEE Transactiona on Power Systems, 14(3), 1010–1020, 1999. doi: 10.1109/59.780914.
- A. A. Kadhem, N. Izzri Abdul Wahab, and A. N. AbdAlla, “Differential evolution optimization algorithm based on generation systems reliability assessment integrated with wind energy,” 5th International Conference on Power Generation Systems and Renewable Enegy Technologies (PGSRET), 1-6, 2019, doi: 10.1109/PGSRET.2019.8882705.
- C. Singh and V. Gubbala, “An alternative approach to rounding off generation models in power system reliability evaluation,” Electric Power Systems Research, 7796(95), 37–44. 1996.
- N. Samaan and C. Singh, “Adequacy assessment of power system generation using a modified simple genetic algorithm,” IEEE Transactions on Power Systems, 17(4), 974–981, 2002. doi: 10.1109/TPWRS.2002.804994.
- R. Billinton and W. Li, Reliability Assessment of Electric Power Systems Using Monte Carlo Methods. Plenum Press, New York, 1994.
- R. N. Allan, R. Billinton, and N.M.K. Abdel-Gawad “The IEEE Reliability Test System—Extensions to and Evaluation of the Generating System,” IEEE Transactions on Power Systems, PWRS(4), 1–7. 1986.
- V. Miranda, L. de Magalhaes Carvalho, M. A. da Rosa, A. M. L. da Silva, and C. Singh, “Improving power system reliability calculation efficiency with EPSO variants,” IEEE Transactions on Power Systems, 24(4), 1772–1779, 2009. doi: 10.1109/TPWRS.2009.2030397.
- S. Soleymani, M. E. Mosayebian, S. Mohammadi, and D. G. Gomes, “A combination method for modeling wind power plants in power systems reliability evaluation,” Computer and Electrical Engineering, 41, 28–39, 2015. doi: 10.1016/j.compeleceng.2014.12.005.
- P. Henneaux, F. X. Bouchez, and L. Rese, “Confidence intervals for adequacy assessment using Monte Carlo sequential simulation,” in 2016 IEEE International Energy Conference, 1-6, 2016, doi: 10.1109/ENERGYCON.2016.7514142.