Pre-University Students’ Learning Styles and Attitude towards Mathematics Achievements

Adv. Sci. Technol. Eng. Syst. J. 5(6), 269–273 (2020);
 DOI: 10.25046/aj050632
Learning styles studies have been discussed widely in academic field. It can be considered as a factor that contributes to the achievement of the students in their learning because everyone has a unique learning style when learning. In this paper, we aimed to examine the association of learning styles and attitude towards academic achievement. By identifying the student’s learning styles preference, it will offer benefits to the student and instructor by improving learning achievement. Sample data were collected among 328 pre-university science and engineering students using cross-sectional survey. Attitudes Towards Mathematics Inventory (ATMI) and Index of Learning Style© (ILS) were used as the instruments to collect data from the respondents. Data were analysed using Stata statistical tool to examine the result. Result showed that there was no association of learning styles and attitude towards academic achievement in this study.
1. Introduction
Mathematics is one of the subjects in Sijil Pelajaran Malaysia (SPM), a high school national examination taken by secondary school students in Malaysia, as it is one of the subject requirements to continue study in pre-university program. However, the percentage of students who passed with distinction and credit in this subject has not improved from 2017 to 2019. Students who passed with distinction were 31.5% in 2017, 31.2% in 2018 and 31.2% in 2019 while those who passed with credit were 25.2%, 24.9% and 24.1% for 2017, 2018 and 2019 respectively [1, 2]. It is quite worrisome to see these statistics as mathematics does not only exist as individual subject, but it is also used as a tool in other subjects such as physics, chemistry, accountancy and economics to name a few. There are many aspects needed to be studied and improved in order to overcome this problem and the aspects of the students’ learning styles and attitudes toward mathematics are among the aspects worth looked into.
In [3], the author mention that the learning style theory was originated from psychology research domain. However, this theory appears to have wide acceptance in many educational researches in exploring the issue of student achievement through learning style. There are several disciplines that have applied this theory in their studies such as nursing, engineering, mathematics [4-6] and online learning mode course [7].
In literatures, some studies on learning styles and academic achievement have been discussed extensively. For example, studies in [8], the studies found that there was no significant difference between learning style and academic achievement among Polytechnic undergraduate business students in Malaysia. The study concluded that by promoting student self-awareness and learning strategies, it will affect their learning style. In [9], the author studied the relationship of learning styles and academic achievement in mathematics among Grade 8 students. The study concluded that learning style is significantly related to academic achievement.
Based on the literature, there is a lack of study that discussed on pre-university students’ learning style and attitude towards mathematic achievements. Moreover, the mixed results found in literature have motivated this study to be conducted. In addition, this study is an extension of the original research [10] that examined pre-university student’s attitude towards mathematics achievement. Despite the fact that pre-university students from science program have always gained better achievement compared to students from engineering program, the original research showed that mathematical capability of the students was not influenced by the program they enrol in a local public university. Thus, the result showed that there was no significant findings on the attributes associated to academic achievement [10].
Therefore, it is significant to broaden this study on learning styles and attitudes towards mathematics achievement for pre-university students. The objectives of the studies are:
- To study the student’s preference learning style towards mathematics.
- To study the differences of student attitudes towards mathematics.
- To measure the association of learning style and attitudes towards mathematics achievement.
In the next section, it discusses the related work on learning style. It is followed by research methodology while the final section is result and conclusion.
2. Related Works
What makes individual learning style distinct? Individual learning style is driven by some attributes such as characteristics and behaviour of the learner. According to literature, learning style has three basic elements which are cognitive, motivational and physiological. These elements indicate how the learner perceive, respond, and cooperate with the learning environment [11]. Every student has different level of cognitive, motivation and psychology responsive to the learning atmosphere [12]. Moreover, learning styles give an impact to the academic performance [13].
In an analysis done in [14], result showed there was a positive relationship between students’ learning styles and the attitude towards mathematics. Many researches agreed that the effect of learning styles and positive attitude contributed to better achievement in mathematics. In [15], the author suggested that learning environment designed according to learning styles may increase students’ success while the researcher in [16] said that individual learning style correlated the highest with mathematics performance. Likewise, studies conducted in [17], the author stated that positive attitudes towards mathematics and science are also associated with higher achievement in each subject.
There are several types of learning model discussed in literature on learning style which includes Kolb’s Learning Style instrument (LSI), Learning Style Questionnaire (LSQ), Canfield Learning Style Inventory (CLSI), Cognitive Styles Analysis (CSA), Index of Learning Survey (ILS) and VARK (Visual, Aural, Reading or Write and Kinaesthetic) model [18].
Table 1: ILS dimension
| Domains | Description |
| Sensing vs. Intuiting | Sensing – concrete and practical learner. Prefer facts, sound, sight, data, and physical sensation. |
| Intuiting – abstract and theoretical learner. Prefer concept, theories, and insights. | |
| Visual vs. Verbal
|
Visual – learn from what they have seen. |
| Verbal – learning through the words whether from spoken or written. | |
| Active vs.
Reflective |
Active – learn by performing practical activity and collaboration with others. |
| Reflective – learn through thinking or pondering and working alone. | |
| Sequential vs. Global | Sequential – linear thinking process. Prefer to do things step by step. |
| Global – holistic thinking process. Prefer to study the whole picture to understand entire subject. |
The most common models used in literatures are VARK model and ILS model [5-6],[19]. Different models of learning style have their own strengths and weaknesses. VARK model examines on sensory modality that includes visual, aural, read/write and kinaesthetic of learning styles. This model is used to identify learner preferred learning mode in which the learner may have multimodal learning styles [19]. Another model used among many researchers is Richard M. Felder and Linda K. Silverman’s Learning and Teaching Styles based on its instrument of Index of Learning Styles (ILS). Initially, the model consists of five dimensions of Felder and Silverman’s Learning Styles; Sensory-Intuitive, Visual-Auditory, Inductive-Deductive, Active-Reflective and Sequential-Global [12] but it has been updated to four dimensions which are Sensing-Intuiting, Visual-Verbal, Active-Reflective and Sequential-Global. In ILS model, information was perceived and processed by four domains [20, 21].
Furthermore, literature on learning style preferences among engineering student showed that students prefer active, sensing and visual learning styles in their problem-based learning (PBL) curriculum course [22]. Moreover, other studies also found that engineering students favoured sensing, visual, active and sequential learning styles [6]. In another perspective, learning styles preferences may differ between genders in which females have reflective, sensing, visual and sequential learning styles while males prefer active, sensing, visual and sequential [23]. In 2015, the author found that there was a significant relationship between learning styles and educational achievement such as in mathematical field [7]. In addition, there is a positive significant relationship between students learning style who used Active-Reflective and Visual-Verbal learning style and their score means.
ILS is more reliable, valid, and suitable for identifying learning styles [20]. It is a well-established tool and widely used to assess learner’s learning styles. Moreover, various studies have been done on learning style using ILS [23]. Thus, this study adapted ILS model to fulfil the objectives of the study. Instruments used in this study are Attitudes Towards Mathematics Inventory (ATMI) and Index of Learning Style© (ILS). How does ATMI measure the attitude of the learner in mathematics? In ATMI instrument, it consists of four attributes; i) Self-confidence: learner’s confidence and self-concept in comprehend mathematics; ii) Value: belief of usefulness, relevance and worth; iii) Enjoyment: learner has fun working with mathematics; and iv) Motivation: learner’s interest and desire to study in mathematics [24].
3. Methodology
This study used cross-sectional survey among students attending pre-university studies in a local university and all students were invited to participate in this survey. A total of 328 students participated in this survey, giving the response rate of 13%.
A set of questionnaire consisted a range of information including socio-demographic as well as questions measuring their attitudes towards mathematics using Attitudes Towards Mathematics Inventory (ATMI) [25] and Index of Learning Style© (ILS) [26] was distributed among the participants. There were four self-reported domains focused in ATMI which included to measure self-confidence, value, enjoyment and motivation. ATMI consisted of 40 items on 5-point Likert scale ranging from strongly disagree to strongly agree. Its Cronbach’s alpha indicated good reliability (a= 0.97). To find the result on the attitude of the student, each domain score was summed up. The higher scores showed positive attitudes towards mathematics.
The ILS consisted of 44-items which were divided into four subscales (active/reflective, sensing/intuitive, visual/verbal, and sequential/global). The Cronbach’s alpha for ILS was considered good with 0.74 [21]. The scores in ILS were computed by taking the difference on the number of items selected for each of the two styles in a scale. The total scoring was between -11 to 11. The scoring was categorised as strong (+/- 11-9), moderate (+/–5) and mild (+/-3-1) preferences.
Data analysis was done using Stata statistical software [27]. Prior to analysis, data were cleaned and verified for any errors, outliers or missing values. Continuous data were reported as means and standard deviations while categorical data were reported as frequencies and percentages. Normality test was conducted using Shapiro-Wilk’s test. Bartlett’s test for equal variances was conducted prior to mean comparisons between groups. P-value of more than 0.05 from Bartlertt’s test confirmed the assumption of equality of variance. Bivariate analysis between continuous variables was run using t-test, while ANOVA was used for more than 2 comparison groups. Pairwise correlation was measured using Pearson correlation. The association between mathematics attitude and learning style on mathematics achievement was measured by linear regression. All statistical tests were conducted at 5% significant level.
4. Results
4.1. Participants
Table 2 shows a total of 328 pre-university students who participated in this study. It reflected the same participants who were used in both studies. The respondents were about 53% female and 47% male students. About 60% of the participants were from science program and 40% of the participants were from engineering program. There was a statistically significant difference between program and gender (Chi-square=49.233, p-value <0.001). More than half of the respondents reported that they attended boarding school previously (57%). More than 70% from both male and female students scored A+ in mathematics during their Higher School Certificate (HSC) exam. However, result showed that there was no statistically significant association between school type and gender (Chi-square=0.658, p-value=0.417).
Table 2: Distribution of participants in the survey
| All (N) | Male
(n) |
Female
(n) |
Chi-square test | p-value | |
| Program | |||||
| Science | 195 | 61 | 134 | 49.233 | <0.001 |
| Engineering | 133 | 94 | 39 | ||
| Type of school | |||||
| Boarding school | 187 | 92 | 95 | 0.658 | 0.417 |
| Non-boarding school | 141 | 63 | 78 | ||
| HSC Mathematics | |||||
| A+ | 235 | 115 | 120 | 0.939 | 0.333 |
| A | 93 | 40 | 53 |
4.2. Finding from the original research
Result in Table 3 was taken from the original research which was presented in ICEED, 2019. The original research was more focused on the students’ attitude towards mathematics final exam achievement for pre-university students. ANOVA test was conducted and the result showed there was no statistical difference between attitude and mathematics achievement (F=074, p-value = 0.658) of the students [10].
Table 3: Attitude and mathematics achievement
| Attitude | Sum of squares | Df | Mean square | F | Sig. |
| Between groups | 606.636 | 8 | 75.829 | 0.74 | 0.658 |
| Within groups | 32784.668 | 319 | 102.773 | ||
| Total | 33391.304 | 327 |
4.3. Learning styles preferences
Figure 1 shows the distribution of domain in learning style preferences. Female students were found to score more than 50% in most of the domains. Those who attended boarding school scored higher in all domains compared to non-boarding school attendees. Students who got A+ in their HSC mathematics exam were found to dominate all domains (more than 65%) while those who got between B+ and A for their HSC Additional Mathematics exam were found to score between 20% and 35% in all domains. Majority of the students from science program were found to prefer reflective (65%), sensing (67%), visual (60%) and global (62%) learning styles.

Figure 1: Percentages of Learning Style Preferences (Domain)
Figure 2 shows the distribution of domain in learning style preferences for science and engineering students. Majority of the students from science program were found to prefer reflective (65%), sensing (67%), visual (61%) and global (62%) learning styles.
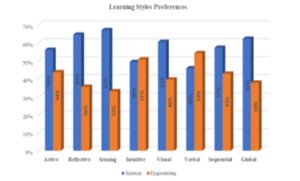
Figure 2: Learning Style Preferences (Domain) by program
4.4. Learning Style Preferences (Domain) during pre-university studies
Students who did very well (grade A) for both pre-university mathematics examinations during their studies had preference in all domains of learning styles. For semester 1 paper, 50.6% of those who scored A grade preferred sequential learning style while for semester 2 paper, students who scored A preferred both verbal (70.8%) and sequential (70%) learning style, respectively. In comparison, students who scored B grades (B- to B+) were found to prefer global learning style for both semester 1 and semester 2 papers as shown in Figure 3.
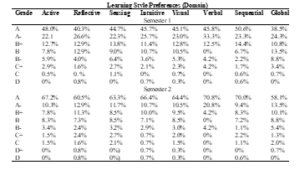
Figure 3: Learning Style Preferences (Domain) in pre-university program
4.5. Students’ attitude towards mathematics
The summary from ATMI survey that measured the students’ attitude towards mathematics is presented in Table 4. The results indicate that male students have more positive attitudes compared to female students. Students from both types of school showed interest or positive attitudes towards mathematics. Those who did very well in both mathematics papers during HSC examinations have much higher positive attitudes compared to others. The same was true for those who were from engineering program. There were variations of attitude scores found across grades in mathematics subjects during pre-university studies. For semester 2 paper, students who scored B- and below were found to have higher positive attitudes’ scores compared to the others. However, for semester 1 paper, their attitudes towards mathematics seemed to be equally distributed across all grades.
Table 4: Score on ATMI by gender, school type, HSC Mathematics and HSC Additional Mathematics
| Characteristics | N | Mean | SD |
| Gender | |||
| Male | 155 | 137.941 | 10.237 |
| Female | 173 | 136.584 | 9.971 |
| School | |||
| Boarding | 187 | 137.064 | 10.093 |
| Non-boarding | 141 | 137.410 | 10.153 |
| HSC Mathematics | |||
| A+ | 235 | 137.745 | 10.334 |
| A | 93 | 135.914 | 9.429 |
| HSC Additional Mathematics | |||
| A+ | 13 | 140.538 | 9.812 |
| A | 101 | 139.129 | 8.975 |
| A- | 97 | 137.505 | 10.586 |
| B+ | 70 | 135.514 | 9.970 |
| B | 46 | 134.283 | 10.946 |
| B- | 1 | 130.0 | 0 |
| Program | |||
| Science | 195 | 136.533 | 10.470 |
| Engineering | 133 | 138.241 | 9.492 |
| Pre-university Mathematics Semester 1 grade | |||
| A | 148 | 138.412 | 9.926 |
| A- | 78 | 136.667 | 9.979 |
| B+ | 42 | 134.048 | 12.791 |
| B | 32 | 137.375 | 8.454 |
| B- | 17 | 136.353 | 9.006 |
| C+ | 8 | 138.500 | 6.655 |
| C | 2 | 139.500 | 2.121 |
| D | 1 | 134.000 | 0 |
| Pre-university Mathematics Semester 2 grade | |||
| A | 212 | 137.439 | 10.209 |
| A- | 37 | 136.567 | 9.907 |
| B+ | 30 | 136.867 | 10.274 |
| B | 26 | 134.154 | 10.376 |
| B- | 10 | 141.000 | 9.333 |
| C+ | 6 | 138.667 | 10.875 |
| C | 5 | 140.400 | 5.771 |
| D+ | 1 | 148.000 | 0 |
| D | 1 | 134.000 | 0 |
4.6. Association between learning style and attitudes towards mathematics achievement
Multiple linear analysis was conducted to measure the association between learning style and attitudes towards mathematics on the mathematic score while controlling for the effect of gender, type of school and HSC grade in mathematics. A significant regression model was observed (F(5,322)=7.44, Prob>F= <0.001 and Adjusted R2=0.089). In this model, we found that learning style and attitude were not statistically associated with mathematics scores (Blearning style=0.446, p=0.054 and Battitude=0.019, p=0.708, respectively) as presented in Table 5.
Table 5: Association between learning style and attitudes towards mathematics on the mathematics score in pre-university (semester 2 paper)
| Predictors | B | t | p-value |
| Learning style scores | 0.446 | 1.93 | 0.054 |
| Attitude scores | 0.019 | 0.37 | 0.708 |
| Female | 4.047 | 3.75 | <0.001 |
| Non-boarding school | 3.682 | 3.39 | 0.001 |
| HSC Mathematics, (A+) | 3.221 | 2.690 | <0.001 |
F (5,322)=7.44, Prob>F= <0.001 and Adjusted R2=0.089
5. Conclusion
This study showed that preference learning style was dominated by the female students from science program who had attended boarding school. Those students who got A+ in HSC mathematics dominated more than 65%. These students’ preference learning styles were reflective, sensing, visual and global learning styles. Meanwhile, the result showed that when the students were in pre-university studies, those who scored grade A during semester 1 preferred sequential learning style while students in semester 2 who scored A preferred verbal and sequential learning styles. Thus, it shows that there is no specific learning style that the students prefer to use because it depends on the environment of the studies. In terms of the student’s attitude, we can conclude that there was a variation of attitude score found across grades in mathematics subject during pre-university studies. Those who had positive attitude scored a good grade in mathematics both in HSC and pre-university studies. Besides that, we have studied the factors that contributed towards academic achievement. The result showed no association was found between learning style and attitudes towards mathematics based on the mathematics scores. Thus, this study can help the instructors to plan their teaching through student’s learning style to improve student achievement in mathematics. In addition, this study was conducted on pre-university students from science and engineering background which only focused on mathematics academic achievement. Therefore, this research can be expanded by investigating pre-university learning style for all subjects taken by the students and their academic achievement.
Conflict of Interest
The authors declare no conflict of interest.
Acknowledgment
The authors would like to thank Institute of Research Management and Innovation, Universiti Teknologi MARA for the financial support in this research under the grant 600- IRMI/Dana KCM 5/3/LESTARI (227/2017).
- Lembaga Peperiksaan Malaysia, “Pengumuman Analisis Keputusan Sijil Pelajaran Malaysia (SPM) Tahun 2018,” 15, 2020.
- Lembaga Peperiksaan Malaysia, “Laporan Analisis Keputusan Sijil Pelajaran Malaysia (SPM) Tahun 2019,” 17, 2020.
- F. Shahzad, S.A. Saif-ur-Rehman, “Learning Styles: History, Conceptualization and Continuum,” Social Sciences Review (SSR), 2(2), 15–31, 2014.
- N. Ojeh, N. Sobers-Grannum, U. Gaur, A. Udupa, M.A.A. Majumder, “Learning style preferences: A study of pre-clinical medical students in Barbados.,” Journal of Advances in Medical Education & Professionalism, 5(4), 185–194, 2017.
- C.K. Lee, M.S. Sidhu, “Engineering students learning preferences in UNITEN: Comparative study and patterns of learning styles,” Educational Technology and Society, 18(3), 266–281, 2015.
- M. Rezaeinejad, A. Azizifar, H. Gowhary, “The Study of Learning Styles and its Relationship with Educational Achievement Among Iranian High School Students,” Procedia – Social and Behavioral Sciences, 199, 218–224, 2015, doi:10.1016/j.sbspro.2015.07.509.
- M.M. El-Bishouty, A. Aldraiweesh, U. Alturki, R. Tortorella, J. Yang, T.W. Chang, S. Graf, Kinshuk, “Use of Felder and Silverman learning style model for online course design,” Educational Technology Research and Development, 67(1), 161–177, 2019, doi:10.1007/s11423-018-9634-6.
- H. Awang, N. Abd Samad, N.S. Mohd Faiz, R. Roddin, J.D. Kankia, “Relationship between the Learning Styles Preferences and Academic Achievement,” IOP Conference Series: Materials Science and Engineering, 226(1), 2017, doi:10.1088/1757-899X/226/1/012193.
- A.-M.L. Villajuan, “Relationship between Learning Styles & Academic Achievement in Mathematics of Grade 8 Students,” International Journal of English Literature and Social Sciences, 4(4), 1052–1055, 2019, doi:10.22161/ijels.4419.
- N. Abdullah, N. Anuar, N.F. Zolkipli, R.H. Shaharudin, S.N.S. Hod, “Assessing Pre-University Students’ Attitude Towards Mathematics,” Proceedings of the 2019 IEEE 11th International Conference on Engineering Education, ICEED 2019, 251–254, 2019, doi:10.1109/ICEED47294.2019.8994930.
- J. Keefe, “Assessment of Learning Style Variables: The NASSP Task Force Model, ” Theory Into Practice, 24(2), 138-144, 1985.
- R. Felder, L. Silverman, “Learning and Teaching Styles in Engineering Education.,” Engineering Education, 78(7), 674–81, 1988.
- M. İlçin, N. Tomruk, S.S. Yeşilyaprak, D. Karadibak, S. Savcı, “The relationship between learning styles and academic performance in Turkish physiotherapy students,” Physiotherapy, 102, e84–e85, 2016, doi:10.1016/j.physio.2016.10.084.
- N. Sirmaci, “The relationship between the attitudes towards mathematics and learning styles,” Procedia – Social and Behavioral Sciences, 9, 644–648, 2010, doi:10.1016/j.sbspro.2010.12.211.
- A. Ozerem, B. Akkoyunlu, “Öğrenme Stillerine Gore Tasarlanan Öğrenme Ortamları Ve Matematik Başarısına Etkisi,” Egitim Arastirmalari – Eurasian Journal of Educational Research, 15(61), 61–80, 2015, doi:10.14689/ejer.2015.61.4.
- A. Bosman, S. Schulze, “Learning style preferences and mathematics achievement of secondary school learners,” South African Journal of Education, 38(1), 1–8, 2018, doi:10.15700/saje.v38n1a1440.
- N. Berger, E. Mackenzie, K. Holmes, “Positive attiitudes towards mathematics and science are mutually beneficial for student achievement: a latent profile analysis of TIMSS 2015,” The Australian Educational Reseacher, 47, 409-444, 2020. doi: 10.1007/s13384-020-00379-8
- G. Balasubramaniam, I. K, “A Study of Learning Style Preferences among First Year Undergraduate Medical Students Using VARK Model,” Education in Medicine Journal, 8(4), 15–21, 2016, doi:10.5959/eimj.v8i4.440.
- H.R. Mozaffari, M. Janatolmakan, R. Sharifi, F. Ghandinejad, B. Andayeshgar, A. Khatony, “The Relationship Between the VARK Learning Styles and Academic Achievement in Dental Students,” Advances in Medical Education and Practice, 11, 15–19, 2020, doi:10.2147/amep.s235002.
- K. Middleton, E. Ricks, P. Wright, S. Grant, “Examining the Relationship Between Learning Style Preferences and Attitudes Toward Mathematics Among Students in Higher Education,” Institute of Learning Styles Journal, 1(January), 1–15, 2013.
- S.R. Viola, S. Graf, Kinshuk, T. Leo, “Analysis of felder-silverman index of learning styles by a data-driven statistical approach,” ISM 2006 – 8th IEEE International Symposium on Multimedia, 959–964, 2006, doi:10.1109/ISM.2006.30.
- A. Kolmos, J.E. Holgaard, “Learning styles of science and engineering students in problem and project based education,” Proceedings of 36th European Society for Engineering Education, SEFI Conference on Quality Assessment, Employability and Innovation, 2008.
- C. SENELER, H. PETRIE, “Adaptation Of The Felder-Soloman Index Of Learning Styles (ILS) Into Turkish And An Assessment Of Its Measurement Quality,” Dokuz Eylül Üniversitesi Sosyal Bilimler Enstitüsü Dergisi, (December), 711–736, 2018, doi:10.16953/deusosbil.332763.
- M. Tapia, G.E. Marsh, An Instrument to Measure Mathematics Attitudes, Academic Exchange Quarterly, 8(2), 16–22, 2004.
- M. Tapia, “Attitudes toward Mathematics Inventory Redux,” Academic Exchange Quarterly, 9(3), 272, 2005.
- T.A. Litzinger, S.H. Lee, J.C. Wise, R.M. Felder, “A psychometric study of the index of learning styles©,” Journal of Engineering Education, 96(4), 309–319, 2007, doi:10.1002/j.2168-9830.2007.tb00941.x.
- StataCorp 2013. Stata Statistical Software: Release 13., 2013.