
Vehicle Rollover Detection in Tripped and Untripped Rollovers using Recurrent Neural Networks
Volume 5, Issue 6, Page No 228-238, 2020
Author’s Name: Kailerk Treetipsounthorn1, Thanisorn Sriudomporn2, Gridsada Phanomchoeng2,3,a), Christian Dengler4, Setha Panngum1, Sunhapos Chantranuwathana2,5, Ali Zemouche6,7
View Affiliations
1Department of Computer Engineering, Chulalongkorn University, Bangkok, 10330, Thailand
2Department of Mechanical Engineering, Chulalongkorn University, Bangkok, 10330, Thailand
3Applied Medical Virology Research Unit, Chulalongkorn University Bangkok 10300, Thailand
4Chair of Automatic Control, Technical University of Munich, Munich, Germany
5Smart Mobility Research Unit, Chulalongkorn University, Bangkok 10300, Thailand
6University of Lorraine, CRAN UMR CNRS 7039, Cosnes et Romain, 54400, France
7EPI Inria DISCO, Laboratoire des Signaux et Systèmes, CNRS-CentraleSupélec, Gif-sur-Yvette, 91192, France
a)Author to whom correspondence should be addressed. E-mail: gridsada.phanomchoeng@gmail.com
Adv. Sci. Technol. Eng. Syst. J. 5(6), 228-238 (2020); ![]() DOI: 10.25046/aj050627
DOI: 10.25046/aj050627
Keywords: Rollover Index, Tripped Rollover, Untripped Rollover, Recurrent Neural Network, Feedforward Neural Network, Tanh, LSTM, GRU

Export Citations
Comparing to other types of vehicle accidents, fatality rate of tipped rollover accidents shows significant number. Thus, tripped rollover prevention systems are important in order to keep driver safe. In other hands, different rollover indices are defined to handle the risk. The variable unknown parameters of each index, for instance, current load of the vehicle or center of gravity, are considered as a difficulty. In this work, the recurrent neural networks, which are designed to work on sequential data in order to provide data estimation without additional estimation algorithm, are investigated in purpose to estimate the tripped and untripped rollover index. The vehicle simulation software with industrial standard CarSim is applied to validate the result. The Tanh recurrent neural network is stated in the result to be the most accurate tripped rollover index estimator for the uncertain parameters, for example, sprung mass and the height of the center of gravity. The suitable input features for tripped and untripped rollover index and neural network structure are verified. To prevent and provide warning of rollover, an advance future prediction can also be designed for the future tripped and untripped rollover prediction.
Received: 01 September 2020, Accepted: 01 November 2020, Published Online: 10 November 2020
1. Introduction
This work is an extension based originally on the groundwork presented in the 9th IEEE International Conference on Robotics, Automation and Mechatronics (CIS-RAM 2019) [1]. This paper will focus on development of recurrent neural networks for tripped rollover while Ref. [1] focus on only untripped rollover. The number of rollover accidents has grown continuously according to the change in vehicles’ size, which are both weight and dimension, over the last 10 years. The majority type of fatality on the road is pointed to rollover accidents. In 2010, 9.1 million cars, which includes passenger cars, SUVs, pickups and vans, crashed and 2.1% of those crashes were caused by rollovers collected by National Highway Traffic Safety Administration’s records (http://www.safercar.gov). From those 2.1% of crashes, there were over 7,600 deaths which was up to 35% of total deaths from vehicle accidents [2]. In addition, 20% of vehicle-crash deaths in Europe are from the rollover [3]. In Germany, 2-5% and 90% of vehicle accidents and deaths from the accidents are caused by vehicle rollover accidents in 2005 respectively [4].
The vehicle rollover accidents are categorized as tripped and untripped rollovers. A rollover accident that have contacted with an external obstacle, such as a pothole or guardrail, is called a tripped rollover. Untripped rollovers are defined the other way round. It happens because of the effect of high lateral acceleration on a dangerous turn, i.e. sharp turn, and it is unrelated to external input [5-6]. Tripped rollovers tend to happen more frequently than untripped rollovers with 95% and 5% of total rollovers according to the statistic provided by NHTSA [2]. From the significant number of deaths from rollovers compared to the total number of high-way traffic deaths, vehicle safety must be improved to prevent the vehicle from rollover accidents.
Hence, several automotive manufacturers, e.g., Ford and Volvo have advanced with active rollover prevention systems which aim to prevent untripped rollover accidents [7]. Analysts and researchers likewise take interest largely in differential braking systems e.g. Anti-lock Braking Systems (ABS), Electronic Braking Systems (EBS) and Electronic Stability Programs (ESP) [3, 7-13]. The baking systems perform vehicle’s yaw rate and speed reduction by adjusting each wheel’s sequence of brake patterns. Also steer-by-wire technology [13-17] e.g. active front steering (AFS), active rear steering (ARS), or four-wheel steering (4WS) are to be used in case of the balancing of performances among yaw stability, violence, and rollover prevention and an active suspension system [18-20] can be used to avoid rollover when the wheels lifted off the road. Then, an active roll bar stabilization system [20-22] uses an active stabilizer for active torque distribution between front and rear axles of the vehicle. This can reduce the roll motion. In addition, active torque management [23] has the capability to prevent rollover accidents. Many control techniques are developed to enhance these systems.
Precise detection of vehicle rollover is mandatory in order for these active rollover prevention systems to fully function. To the present, there are multiple impending vehicle rollover detections developed with computational rollover index. The rollover indices are developed by various approaches. For example, Static Stability Factor (SSF) was developed to measure the rollover resistance of a given vehicle design configuration [24]; ref. [25] introduced rollover indices that consider kinetic energy, then Rollover Prevention Energy Reserve (RPER) is started off to look into rollover risks by taking energy function as the main account [7]; ref. [26] introduced a dimensionless rollover index that takes roll dynamics into consideration by utilizing phase plane analysis; zero-moment point also is developed to predict the possibility of rollover [9]; lateral Load Transfer Ratio (LTR) is popularly discussed in numerous studies [5, 7, 14-18]; to name a few. It is seen that a lot of rollover indicators are developed based on LTR such as Multiple Rollover Indices (MRIs) for trailer vehicles and Predictive Lateral Transfer Ration (PLTR) [9]. Lateral Load Transfer Ration is actually one of the approaches that take several factors into account, for example, roll angle, roll center and height of center of gravity of a vehicle. Many techniques have been established to estimate these factors. For example, extended Kalman filter technique or nonlinear observer/estimator has been built up to improve the accuracy of the lateral Load Transfer Ratio. Other than that, ref. [27] introduced an algorithm that utilizes the time-to-rollover (TTR) metrics to assess the time until rollover as a warning option. With this approach, an advance real-time prediction of rollover risk can be provided. Moreover, this technique can be used with several other rollover indices simultaneously. Despite a number of rollover detection techniques developed until now, only untripped rollovers are detected.
Ref. [5, 6, 28] has introduced a new rollover index which incorporates external road inputs as a factor to detect not only the untripped but also tripped rollover conditions. The external obstacle road inputs are estimated based on a vehicle dynamic model and nonlinear observer. The simulation and experimental results are presented using a 1/8th scaled vehicle.
Since the indicator to detect rollover risk is very important for improving the rollover prevention systems and rollover warning system [29-31], it is necessary to develop the rollover indicator for detecting both tripped and untripped rollovers. It is shown that the traditional rollover index is not effective enough to identify tripped rollovers and there are only few focused on tripped rollovers that are published. In addition, most accurate rollover indicators relay on dynamic models which require known parameters such as vehicle mass or height of center of gravity of a vehicle. Therefore, here proposed is a neural network indicator developed to identify tripped and untripped rollovers. Neural networks known for adaptable and nonlinear information processing capability perform fittingly in the areas of predication, expert system, and mode identification [32-37]. By taking the approach to be introduced afterward into account, the estimation algorithms to estimate unknown parameters such as roll angle, height of center of gravity of a vehicle, or vehicle mass are not required. These parameters may be changed all the time due to the number of passengers and load. Also, the technique can be applied in many situations. This research is the extended technique in [1, 38] which is focused on untripped rollover to detect tripped rollover.
This research has the following outline: Section 2 will introduce the vehicle rollover and the rollover index for detecting tripped and untripped rollovers. Next, the recurrent neural network technique for detecting tripped and untripped rollover is presented in Section 3, and the methodology to apply the recurrent neural network to the rollover problem is presented in Section 4. The process of evaluation of the suitable neural network, the suitable input features, the suitable neural network structure and the future tripped rollover prediction are included in this section. Then, Section 5 will present the tripped rollover results. Finally, Section 6 will discuss the conclusion to the findings.
2. Vehicle Rollover Index
Traditional rollover index posts as most popular technique to detect vehicle rollover among many techniques [5-7, 14-18, 28-33] used nowadays.
2.1. Traditional Rollover Index
In order to detect lift-off condition of the wheels [6, 7], the rollover index is used as a real-time indicator. Lateral Load Transfer Ratio (LTR) is known as another name of the index. The standard rollover index is designed for predicting incidents that are caused with the lift-off conditions of the wheels for untripped accidents. A number of researches use the basic model to derive their rollover indices. A scaled lateral acceleration, a function of roll angle [12], or a function of lateral acceleration and roll angle [9, 18] is considered as a base argument for these rollover indices.
The rollover index by the conventional definition is portrayed by
![]()
where is right normal tire force and is left normal tire force. ( or is the value when a rollover incident is defined. equals to and is when the vehicle travels straight forward. If , then and this will cause the lift-off occurrence of the left wheel. If , then and this will cause the lift-off occurrence of the right wheel.
Based on the one-degree-of-freedom model, the summation and difference of tire forces and can be calculated. An implementable rollover index processed with the one-degree-of-freedom model is demonstrated by [1, 6]
![]()
where is Sprung mass, , is unsprung mass, is lateral acceleration, is Center of gravity (C.G.) height from roll center, is acceleration due to gravity, is track width, and is roll angle.
Lacking influence of the vertical road input and other external inputs limit the rollover index in (2) with only the untripped rollover detection. Lateral acceleration and roll angle influence this rollover index. However, the roll angle, which is complicated to measure, is removed in some published paper’s rollover index calculation.
2.2. Rollover Index for Tripped and Untripped Rollover
The influence of road inputs and other external forces are considered in rollover index both for tripped and untripped rollovers in order to indicate the tripped rollovers caused by external input tripping. Figure 1. shows a vehicle rollover model where the influence of right road inputs, , left road input, , and an unknown lateral force input, , at an arbitrary height, , from the roll center are presented. It also demonstrates the normal tires forces, and .
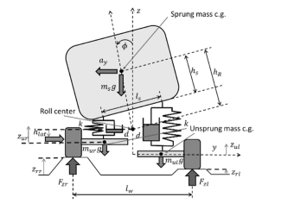
Figure 1: Tripped and Untripped Rollover Model
The four-degree-of-freedom vehicle model provides the derivation of the rollover index in the case of tripped rollover and the derivation is presented in [6]. Equation (3) shows the rollover index for tripped and untripped rollover which is shown in [6].
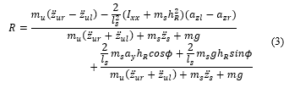
where is right unsprung mass acceleration, is left unsprung mass acceleration, is sprung mass acceleration, is length between the left and right suspensions, is roll moment of inertia, is right vertical accelerometer measurement, is left vertical accelerometer measurement, and .
The second term of (3), the function of lateral acceleration and roll angle, is similar to (2) when comparing the traditional rollover index in (2) and rollover index for tripped and untripped rollovers in (3). To be more clarify, the second term of (3) is the traditional rollover index for detecting untripped rollover, and the first term of (3) is the additional term used for detecting tripped rollover.
There are some difficulties in implementing the (3) to determine tripped rollover due to the parameters and variables that are unable to identify, e.g. the location of roll center, center of gravity (C.G.) height or roll angle. The estimations of these unknowns are required to complete the estimation algorithms. Furthermore, the difference of dynamics between an actual vehicle and the four-degree-of-freedom model might lead to errors. The recurrent neural network is implemented to detect tripped and untripped rollovers in order to optimize the estimation. After training the data, the traditional estimation algorithm to estimate parameters and detect rollover are not required in the model anymore.
3. Recurrent Neural Networks (RNNs)
Recurrent neural network is a popular special type of neural networks. In this paper, sequential data will be sensor data over a period while in other cases it can be, for example frames in video, or words in a text. When a new input is introduced to the sequence, a hidden state vector, , which is an added memory of the recurrent neural network, is updated. To avoid features losses while training neural networks, the crucial data of the previous sequence is maintained in this hidden state. The recurrent neural network has the ability to work with various lengths of sequence data in addition to the benefit in compression of past information.
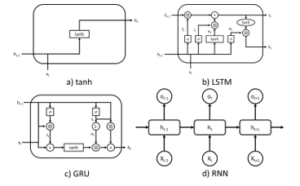
Figure 2: The Structural of Recurrent neural network a) tanh architecture b) LSTM architecture c) GRU architecture d) RNN Connection
There are four types of neural networks used to evaluate and create the neural network models for detecting tripped and untripped rollover. The four types of neural networks are 1) feedforward neural network (FNN), 2) Tanh neural network, 3) long short-term memory (LSTM) neural network [39], and 4) gates recurrent unit (GRU) neural network [40]. The detail of implementing these neural networks can be found in [39-46] and the short introduction of them is shown in [1]. The structural of recurrent neural network is shown on Figure 2.
4. Methodology
The data which is not normally determined in a vehicle such as the wheel’s forces exerted on the ground by the vehicle wheels is mandatory to compute the precise rollover index in (1). Moreover, Ref. [6, 28] determine the tripped and untripped rollover index based on half vehicle model (4 Degree of Freedom). The variables, which are used, are right unsprung mass vertical acceleration, , left unsprung mass vertical acceleration, , right vertical accelerometer measurement, , left vertical accelerometer measurement, , lateral acceleration, sprung mass acceleration, , roll angle, , roll rate, , and right suspension compression, ( ). They also assume that the parameters such as sprung mass, , unsprung mass, , C.G. height from roll center, are constant and not changed.
To detect tripped rollover with various conditions, the good measurement inputs are needed to verify for recurrent neural networks. Also, a feedforward neural network is compared with recurrent neural networks in this case to validate the advantages of employing recurrent neural networks rather than a static neural network. The feedforward neural network uses the same inputs as the recurrent neural networks for processing the data and a comparable number of parameters. Moreover, the structure of neural networks is verified for determining the suitable one.
There is a reconstruction of the relationship between the inputs and the rollover index from a dataset processed in a simulation constraint. The next part is presented with the details on the dataset used for training, also the structure of the neural networks and the training setup will be described
4.1. Dataset generation for tripped and untripped rollover
The software CarSim, a standard industry vehicle simulation software, is used to process all the data concerned. In a first step, 22,000 simulations with non-selectively sampled height of the center of gravity and sprung mass of the car are simulated with a variety of tripped rollover scenarios. The height of the center of gravity is uniformly studied between 0.6 and 1.2 meters, based on [47] as a background which also take an estimate of additional loads into account. The sprung mass is uniformly generated between 2100 to 3000 kg, a mass comparable to loaded SUVs. Next, a trajectory of the scenarios is generated based on Fig 2. The trajectory consists of the 50 meters of straight path and the circular arc path of the random radius in the range from 50 to 200 meters based on highway data of Bangkok, Thailand. Samples 80 to 180 km/h uniform distribution will determine the target velocity of the vehicle. Then, the CarSim is going to control the real velocity over the trajectory in a feedback loop to remain adjacent to the speed that is set goal. Also, the steering angle of the vehicle is close-loop controlled to follow the trajectory.
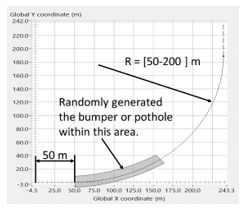
Figure 3: CarSim Trajectory Setup
To create tripped rollover scenarios, the bumper and pothole are randomly generated along the circular arc path of the trajectory as shown in Figure 3. The shape of the bumper and pothole is randomly created from the sine function with the amplitude between -0.15 to 0.15 m and the frequency between 0.625 to 1.25 Hz. Only one bumper or pothole is created for each trajectory. Also, it is created only half lane of the trajectory to make only half side of the vehicle strike the bumper or pothole. For the left turn trajectory, if the bumper is generated, the bumper is created on the left side of the vehicle and if the pothole is generated, the pothole is created on the right side of the vehicle. Then, for the right turn trajectory, if the bumper is generated, the bumper is created on the right side of the vehicle and if the pothole is generated, the pothole is created on the left side of the vehicle. These increase the chance for tripped rollover.
The normal forces on the left and right wheel, , , are provided by a simulation, so each estimation is able to process to determine its rollover index. The rear wheel vertical forces are used to identify the rollover index. However, the front wheels, employing the said methodology together with a small variation from elastic deformations in the wheels and wheel suspensions, can also specify the rollover index as well. The rollover index computed with (1) is the neural networks’ training target, calculated according to (1). From there, when two wheels are lifted off road, the sequences stop. That is because the rollover index is defined only for the case of at least one wheel lifting the ground. And it will contribute to a sequence range of length between 0.325 to 19.925 seconds. In every simulation case, there will be a collection of data of the vehicle variables at the sample rate of 40 Hz. However, each simulation dataset also possesses insignificant and irrelevant information of the subject vehicle or those that are unable to be scaled in an actual subject. So, the unnecessary data are needed to be discarded. Then, for the 22,000 files of h5 files (1.64 GB), they are splitted into 3 groups. There are a training set of 16,000 files, a validation set of 4000 files, and a test set of 2,000 files. The training set is used for training. Other than that, it is mandatory for the validation set to detect possible overfitting of the model while the test set is used to evaluate the error of the neural networks.
4.2. Training of the recurrent neural networks for tripped rollover
There are three major factors of neural networks for detecting tripped and untripped rollover needed to be verified. The first factor is which neural network should be suitable, the second factor is which inputs should be good for neural networks, and the last one is which structure of the neural networks should be implemented. To verify these three factors, three training sets are simulated. Then, future tripped and untripped rollover prediction also is verified with simulation.
4.2.1 Training for determining a suitable neural network type
For this task, four types of neural networks will be compared and given information. Table 1 is presented with the detail of the neural networks which are constructed to take into account approximately the same quantity of parameters. About 5,000 parameters are to be taken to comparison between each neural network. In Table 1, “ neurons” shows the number of neurons in each layer in the horizontal axis, and also takes into account the input layer (n inputs) and output layer (1 output). The recurrent neural networks, the second entry in “ neurons” represents the number of hidden states. “ params” specifies the number of parameters in the neural network. In this column, the added number will be those of all elements in its weight matrices and bias vectors.
Firstly, a feedforward neural network (FNN) will be introduced. FNN is made up of three hidden layers using the activation function and a linear output layer as shown within [1]. Secondly introduced is a neural network (Tanh) which is a recurrent neural network, that employs a recurrent layer. And followed the recurrent layer aforementioned are a hidden layer and an output layer. Thirdly, LSTM neural network which utilizes a long short-term memory layer, again followed by a layer and linear output layer. And for the fourth one, GRU neural network that adopts a static Tanh layer and a linear output layer, works with the gated recurrent unit. Then, the neural networks training diagram is shown on Figure 4.
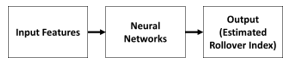
Figure 4: The Neural Networks Training Diagram
Table 1: Summary of The Neural Networks’ Structure
| NN Type | neurons | param |
| FNN | n 48 48 42 1 | 48n+4501 |
| Tanh | n 46 46 1 | 46n+4417 |
| LSTM | n 30 16 1 | 120n+4353 |
| GRU | n 32 32 1 | 96n+4353 |
Table 2: Input Variables for Neural Networks
| Symbolic | Descriptions |
|
Vertical speed of each wheel: Left front, , Left rear, , Right front, , Right rear, , ( ) |
|
|
Longitude acceleration, , Lateral acceleration, , Vertical acceleration, , ( ) |
|
| Roll Acceleration of sprung mass body ( ) | |
|
Roll rate, , Pitch rate, , Yaw rate, , ( ) |
|
| Vertical acceleration of sprung mass C.G. (g) | |
| Longitude speed ( ) | |
| Steer angle from driver (deg) | |
|
Compression of spring each wheel: Left front, , Left rear, , Right front, , Right rear, ( ) |
Table 3: Input Combination Training for Determining a Suitable Neural Network Type
| No. | Input Features | n | FNN | Tanh | LSTM | GRU |
| 1 | 8 | 4885 | 4785 | 5313 | 5121 | |
| 2 | 6 | 4789 | 4693 | 5073 | 4929 | |
| 3 | 8 | 4885 | 4785 | 5313 | 5121 | |
| 4 | 9 | 4933 | 4831 | 5433 | 5217 | |
| 5 | 11 | 5029 | 4923 | 5673 | 5409 | |
| 6 | 9 | 4933 | 4831 | 5433 | 5217 | |
| 7 | 12 | 5077 | 4969 | 5793 | 5505 |
For the inputs to the neural networks, it is still unclear to select them to predict the tripped rollover. Thus, to initially investigate this task, the inputs are selected based on (3) [6] and the full vehicle suspension model. In addition, the selected inputs can be measured by sensors [6, 28]. The list of the inputs is shown on Table 2. The input combinations are also evaluated in this case. The input combinations for training in this section is shown on Table 3.
Next, the neural networks are trained over 3000 epochs using backpropagation through time. When the process is completed, since the result beyond that came out slower on the validation and training loss. The mean squared error is used as the loss function:
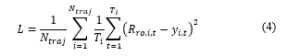
with the rollover index as calculated using the cases data in trajectory at time step and the scalar output of one of the neural networks for the same trajectory and time step.
The leading software that is used for computing the neural networks is the Knet module [49] by the Julia programming language. The program runs on the notebook, Acer Nitro, with CPU i7-7700HQ (2.8 GHz), 8 GB Ram, GeForce GTX1050, and Window 10 (64 bits). In the meantime, Training is done on a consumer level GPU is used to perform the network training for about 1 hour per model by using average quantity of parameters. This altogether resulted in more than 240 hours of training time. The Ram usage during the training is approximately 6 to 7 GB. And there also implemented the Adam optimizer along with the suggested settings in [50]. Then, the gradient was computed on mini-batches of 2,048 sequences.
4.2.2 Training for determining suitable inputs for the neural network
Since the performance of the neural network is required and the sensor cost is needed to be minimized, the inputs to the neural network need to be optimized. The extra inputs, suspension compressions as using in [28] for each wheel, are included to the list for evaluation. Then, the input combinations are evaluated to determine the suitable inputs for predicting rollover. The input reduction is also included in this test for reducing number of using sensors. The lists of the inputs are shown in Section 5.2 Table 5.
Next, only the best neural network type from the section 4.2.1 are trained. The training process and the loss function are implemented similar to the section 4.2.1.
4.2.3 Training for determining suitable neural network structure
In this task, the neural network improvement is investigated. Eight different structures of the best neural network from the section 4.2.1 are compared. The neural network structure is modified by increasing number of the layers and the neurons. Also, the optimized inputs from the section 4.2.2 are used in this task. Then the neural network structures are also summarized in Table 6. Next, the training process and the loss function are implemented similar to the section 4.2.1.
4.2.4 Training for future tripped and untripped rollover prediction
The future tripped and untripped rollover perdition uses the vehicle parameter measurement to prediction rollover index of a vehicle in the future time based on the training model. It can provide an extra time to prevent or warn the danger of the rollover.
In this case, the output of each data set is shifted by time while the input is reduced to identify with to the length of the output. The shifted time varies from 0.1 second up to 1 second. Then, the best model from Section 4.2.3 are used and, the training process and the loss function are implemented similar to the section 4.2.1
5. Results
The training as descript in Section 4 are applied to the data set. The final losses on the train, validation and test datasets are presented in this section.
5.1. The suitable neural network type
The test losses in different neural networks on the different input features are shown on Table 4. Also, the example of loss on the train dataset and validation dataset over the epochs are presented in Figures 5a and 5b, subsequently. The training and validation losses of all different neural networks and all input features shows that the overfitting does not occur for all cases because the validation loss decreases as the training loss decreases and the losses from validation dataset are small as the losses from training dataset. Also, the underfitting did not occur for all cases because the neural network models can detect the rollover index as shown in Figures 6 and 7.
Table 4: Remaining Loss of Different Neural Networks on Test Data Set
| No. | Input Features | n | Average RMS error of 2000 Data Set | |||
| FNN | Tanh | LSTM | GRU | |||
| 1 | 8 | 15.9 | 10.5 | 11.3 | 27.2 | |
| 2 | 6 | 228 | 33.3 | 96.3 | 156 | |
| 3 | 8 | 17.7 | 13.2 | 14.4 | 28.9 | |
| 4 | 9 | 12.5 | 10.3 | 11.1 | 17.4 | |
| 5 | 11 | 9.82 | 7.91 | 9.98 | 22.8 | |
| 6 | 9 | 17.1 | 22.7 | 13.3 | 43.0 | |
| 7 | 12 | 9.09 | 7.54 | 9.47 | 21.5 | |
Note: the highlighted cell of the table represents the smallest value of the table.
- Training Loss of No. 7 Table 4
- Validation of No. 7 Table 4
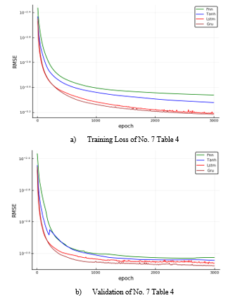
Figure 5: The Example of Training and Validation Loss
By comparing four types of the neural networks on Table 4, GRU recurrent neural network and FNN seems have the large test losses for all different input features. Since the tripped rollover happen in the very short time So, there is few tripped data occurred. This makes GRU which has a too long-term memory cannot learn the model well. Also, FNN contributes to a large outstanding error because the formula only processes the valuation with the current input .
- Comparison of Rollover Index and Rollover Index from Neural Networks
- Comparison of Rollover Index Error

Figure 6: The Example of Rollover Index in the Case of ( , , )
- Comparison of Rollover Index in the Bumper Case
- Comparison of Rollover Index Error in the Bumper Case
- Comparison of Rollover Index in the Pothole Case
- Comparison of Rollover Index Error in the Pothole Case
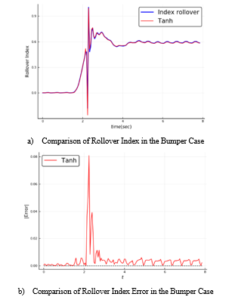
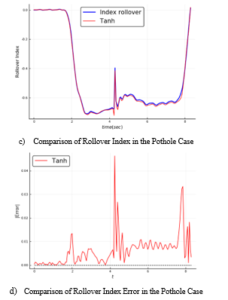
Figure 7: The Example of Rollover Index in the Bumper Case ( , , ) and Pothole Case ( , , )
However, Tanh recurrent neural network has the lowest final loss on test loss excepted for No. 6 Table 4 with the input features, because it has not too long term memory. While the test loss from LSTM recurrent neural network is larger than it from Tanh recurrent neural network except for No. 6 Table 4.
For an empirical comparison, the rollover index (black solid line in Figure 6a) according to (1) and the neural network estimation are shown in Figure 6a for the selected section of the test trajectory. The vehicle takes a cornering at about 2 seconds and during cornering it strikes a bumper at about 6 seconds. This caused a rear wheel to leave the road while its counterpart stayed intact on the ground. The estimated rollover index for the LSTM, Tanh, and FNN are similar and barely distinguishable, whereas the estimation of GRU shows a clear offset and a large error at around 6 seconds. The absolute value of the estimation error is presented subsequently in Figure 6b. As shown, the highest values in the estimation error for the rollover index is seen following the subject vehicle returns from rollover condition back to its normal condition that all of the wheels are on the ground at around 6.1 seconds in the trajectory. However, situational peaks are more prominent, while those of GRU are even more grand.
Figure 7 shows the rollover index and rollover index error of the Tanh recurrent neural network of different vehicle parameters on the bumper and pothole trajectories. The Tanh recurrent neural network can predict the rollover index even though the vehicle parameters are changed because the neural network can handle the vehicle parameter changing. It can learn and adapt the parameters inside the neural network and then predict the rollover index.
Figure 5a shows the case that the vehicle with the parameters, , , , takes a cornering at about 1.8 seconds and during cornering it strikes a bumper at about 2.4 seconds. The maximum error of the estimation happens at about 2.4 seconds. Next, Figure 5b shows the case that the vehicle with the parameters, , , , takes a cornering at about 1.8 seconds and during cornering it strikes a pothole at about 4.4 seconds. Then, the maximum error of the estimation happens at about 4.4 seconds.
In summary, the suitable neural network for tripped rollover is Tanh recurrent neural network since it has ability to retain information of the past and handle the vehicle parameter changing. Also, the lowest test loss happens when using Tanh recurrent neural network with No. 7 Table 4. with the input features, .
5.2. The suitable input features for the neural network
Since the error of the Tanh neural network is needed to be improved, the suspension compressions for each wheel, longitude speed, and steering angle are added and evaluated. The test losses of these cases are shown in Table 5. The results show that the suspension compressions for each wheel, longitude speed, and steering angle are significant input features for the neural network. They can reduce the test losses up to . Also, once the the suspension compressions for each wheel, longitude speed, and steering angle have been included in the input features, the input, , seems not effect to the test losses.
In case that the number of suspension compressions is reduced to be only front or rear side, the test losses is increased as shown in No. 3 and 4 Table 5. No. 3 Table 5. has higher the test losses because the actual rollover index is determined from the rear wheel vertical forces.
In summary, the suitable input features for tripped rollover for Tanh neural network is which are agree with [28]. The example of rollover index in this case is shown in Figure 8.
Table 5: Remaining Loss of the Tanh Neural Network on Different Input Feature on Test Data Set
| No. | Input Features | n | param | Average RMS error of 2000 Data Set |
| 1 | 17 | 5,199 | 4.61 | |
| 2 | 18 | 5,245 | 4.82 | |
| 3 | 13 | 5,061 | 7.41 | |
| 4 | 13 | 5,061 | 6.58 |
*
Note: the highlighted cell of the table represents the smallest value of the table.
5.3. The suitable neural network structure
The error of the Tanh neural network is still needed to be improved. The different types of neural network as shown in Table 6. are evaluated with 3 set of input features, case No. 1, 3, and 4 from Section 5.2.
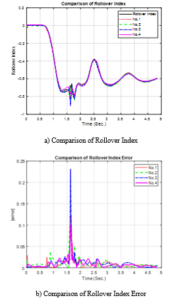
Figure 8: Example of Rollover Index ( , , )
The results show that the neural networks in the case no. 7 Table 6 with the input #1 have the lowest test losses of . In addition, the neural networks in the case no. 5 Table 6 with the input #3 has the test losses of and the neural networks in the case No. 8 Table 6 with the input #2 has the test losses of .
In summary, for the lowest test losses, the suitable Tanh neural network structure is the case No. 7 Table 6 which is (n 46 46 50 30 1). Moreover, for the low test losses and low number of input features, the suitable Tanh neural network structure is the case No. 5 Table 6. The test losses in this case is different from the test loss from the best one only .
Table 6: Remaining Loss of Different Tanh Neural Network Structure on Test Data Set
| No. | Neural Networks’ Structure | Average RMS error of 2000 Data Set | |||
| param | Inputs #1 | Inputs #2 | Inputs #3 | ||
| n=17 | n=13 | n=13 | |||
| 1 | n 12 12 1 | 12n+337 | 7.87 | 12.30 | 9.18 |
| 2 | n 24 20 1 | 24n+1145 | 5.76 | 9.91 | 7.11 |
| 3 | n 46 46 1 | 46n+4417 | 4.61 | 7.41 | 6.58 |
| 4 | n 46 46 30 1 | 46n+5811 | 5.54 | 7.90 | 7.35 |
| 5 | n 46 46 30 30 1 | 46n+6741 | 4.34 | 10.30 | 4.33 |
| 6 | n 46 46 30 50 1 | 46n+7381 | 4.43 | 7.32 | 6.14 |
| 7 | n 46 46 50 30 1 | 46n+8281 | 3.66 | 7.83 | 5.71 |
| 8 | n 46 46 50 50 1 | 46n+9321 | 4.14 | 7.30 | 5.43 |
* Inputs #1:
Inputs #2:
Inputs #3:
Note: the highlighted cell of the table represents the smallest value of the table.
5.4. Future tripped and untrippped rollover prediction
By using the Tanh neural network in No. 7 Table 6, the error of the models shown in Table 7. Also, the example of the rollover index perdition is shown on Figure 9. The results show that once the shift time increases, the error increases. The difference between shift time 0.0 and 0.1 second is approximately . The error seems large. However, if consider the future tripped rollover prediction plot on Figure 9a, the plot shows that they seem correctly predict the trend of rollover index up to 0.5 seconds in future. The prediction lines look like the actual rollover index but it is shelfed by the time.
In summary, this predict is very useful and can provide an extra time prediction for rollover prevention and warning system.
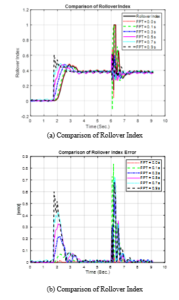
Figure 9. The Example of the Rollover Index in the Case of ( , , )
Altogether, the results exhibit that the Tanh recurrent neural network is able to predict the tripped rollover index with a larger preciseness than others once it is considered with the undetermined parameters, for instance, the height of the center of gravity and sprung mass. So, once processing the training data, it is necessary to take the said undetermined values into consideration. The suitable input features for tripped rollover index should be with Tanh neural network structure of (n 17 46 46 50 30 1). Moreover, the future tripped rollover prediction can provide an extra time prediction for rollover prevention and warning system.
Table 7: Remaining Loss of the Tanh Neural Network on Test Data Set
| Future Perdition Time (Sec) | Average RMS error of 2000 Data Set |
| 0.0 | 3.66 |
| 0.1 | 29.2 |
| 0.2 | 35.6 |
| 0.3 | 43.4 |
| 0.4 | 55.5 |
| 0.5 | 83.4 |
| 0.6 | 133.4 |
| 0.7 | 214.1 |
| 0.8 | 328.2 |
| 0.9 | 464.5 |
| 1.0 | 616.6 |
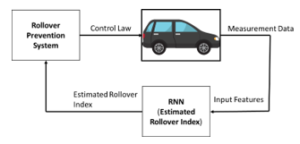
Figure 10: Application Diagram of The Neural Network
The application of the developed neural network is shown on Figure 10. The measurement data from a vehicle is sent to the recurrent neural network which can compute the estimated rollover index within 0.03 ms. Then, the estimated rollover index is sent to rollover prevention/warning system to calculation the control law to make the vehicle action and reduce the roll risk.
6. Conclusions
An essential factor of the carrying out the rollover preventive systems and warning ones is the assessment of the rollover risk. The rollover risk pointer or the rollover index is estimated by employing the feedforward neural network together with three other recurrent neural networks. It is seen that when in occurrence of any uncertain parameters, for instance, undetermined height of the center of gravity of the subject, the Tanh recurrent neural network shows higher performance juxtaposed with others. Calculations of the loss on a test set and an empirical evaluation on test trajectories support in verifying the estimation quality. The outcomes of the test are encouraging for further research, and the performance assessment of the recurrent neural networks in an actual vehicle would be an interesting subject of further research.
The sensory inputs that are chosen play a crucial part in the estimation of the rollover index. The results show that the suitable input features for tripped rollover index should be which are agree with the previous research. Also, the suitable Tanh neural network structure of is (n 46 46 50 30 1). Moreover, the future tripped rollover prediction can correctly predict the trend of rollover index up to 0.5 seconds in future. This will be useful for rollover prevention and warning system.
Acknowledgment
This research was funded by Ratchadaphiseksomphot Endowment Fund Chulalongkorn University, grant number: CU_GI_62_05_21_01.
- C. Dengler, K. Treetipsounthorn, S. Chantranuwathana, G. Phanomchoeng, B. Lohmann, and S. Panngum, “Vehicle rollover detection using recurrent neural networks,” in The 9th IEEE International Conference on Robotics, Automation and Mechatronics (CIS-RAM 2019), Bangkok, Thailand, Nov. 2019.
- US Department of Transportation, Type of Rollovers, National Highway Traffic Safety Administration (NHTSA), Washington, DC, August 2017. [Online]. Available: http://www.safercar.gov
- W. Xinye, GE. Xiaohong, L. Shuyou, and H. Hongwu, “Research on Vehicle Rollover and Control,” in 2010 2nd International Conference on Advanced Computer Control, 2010.
- R. L. Martin, C. Ilse, “Robust indirect-defined envelope control for rollover and lateral skid prevention,” Control Engineering Practice, 61, 149-162, 2017.
- J.J. Rath, M. Defoort, and K.C. Veluvolu, “Rollover index estimation in the presence of sensor faults, unknown inputs, and uncertainties,” IEEE transactions on intelligent transportation systems, 17(10), 2949-2959, 2016.
- G. Phanomchoeng, and R. Rajamani, “New rollover index for the detection of tripped and untripped rollovers,” IEEE Transactions on Industrial Electronics, 60(10), 4726-4736, 2013. DOI: 10.1109/TIE.2012.2211312
- R. Rajamani, and P. Damrongrit Neng, “New paradigms for the integration of yaw stability and rollover prevention functions in vehicle stability control,” IEEE Transactions on Intelligent Transportation Systems, 14(1), 249-261, 2013. DOI: 10.1109/TITS.2012.2215856
- K. Warwas, and A. Krzysztof, “An Application of Neural Networks to Control Stability of an Articulated Vehicle in Real Time,” in Information Systems Architecture and Technology: Proceedings of 36th International Conference on Information Systems Architecture and Technology–ISAT 2015–Part I, 135-146. Springer International Publishing, 2016.
- B. Zhu, P. Qi, Z. Jian, and G. Litong, “Integrated chassis control for vehicle rollover prevention with neural network time-to-rollover warning metrics,” Advances in Mechanical Engineering, 8(2), 2016. https://doi.org/10.1177%2F1687814016632679
- K. Warwas, and K. Augustynek, “An Application of Neural Networks to Control Stability of an Articulated Vehicle in Real Time,” in Information Systems Architecture and Technology: Proceedings of 36th International Conference on Information Systems Architecture and Technology – ISAT 2015 – Part I, 135-146, 2016.
- S. Solmaz, M. Akar, R. Shorten, “Adaptive Rollover Prevention for Automotive Vehicles with Differential Braking,” in Proceedings of the 17th World Congress The International Federation of Automatic Control Seoul, Korea, July 6-11, 2008.
- S. Lee, Y. Fitri, K. Misawa Kasahara, and M. Yasuchika, “Rollover prevention with predictive control of differential braking and rear wheel steering,” in Robotics, Automation and Mechatronics (RAM), 2013 6th IEEE Conference on, 144-149. IEEE, 2013.
- Z. Yu, J. Li, F. Dai, and S. Li, “Anti-Rollover Control Based on Fuzzy Differential Braking for Heavy Duty Commercial Vehicle,” in Conference: 2016 4th International Conference on Machinery, Materials and Computing Technology, 2016.
- S. Yim, “Design of a preview controller for vehicle rollover prevention,” IEEE Transactions on Vehicular Technology, 60(9), 4217-4226, 2011. DOI: 10.1109/TVT.2011.2169687
- S. Solmaz, C. Martin, and S. Robert, “A methodology for the design of robust rollover prevention controllers for automotive vehicles with active steering,” International Journal of Control, 80(11), 1763-1779, 2007. https://doi.org/10.1080/00207170701473987
- R.A. Azim, and F.M. Malik, “Rollover mitigation controller development for three-wheeled vehicle using active front steering,” Mathematical Problems in Engineering, 2015.
- N. Zhang, G.M. Dong, and H.P. Du, “Investigation into untripped rollover of light vehicles in the modified fishhook and the sine maneuvers. Part I: Vehicle modelling, roll and yaw instability,” Vehicle System Dynamics, 46(4), 271-293, 2008. https://doi.org/10.1080/00423110701344752
- S. Yim, P. Yongjin, and K. Yi. “Design of active suspension and electronic stability program for rollover prevention,” International journal of automotive technology, 11(2), 147-153, 2010.
- D. Konik, “Dynamic drive-the new active roll stabilization system from BMW group-system description and functional improvements,” in Proc. 5th Int. Symp. Avec 2000, Ann Arbor, MI 2000.
- S. Yim, K. Jeon, and K. Yi, “An Investigation into Vehicle Rollover Prevention by Coordinated Control of Active Anti-roll Bar and Electronic Stability Program,” International Journal of Control Automation and Systems, 10(2), 2012. https://doi.org/10.1080/002071707014739887
- D.J. Sampson, and C. David, “Active roll control of single unit heavy road vehicles,” Vehicle System Dynamics, 40(4), 229-270, 2003.
- J. Yoon, W. Cho, and J. Kang, “Design and evaluation of a unified chassis control system for rollover prevention and vehicle stability improvement on a virtual test track,” Control Engineering Practice, 18(6), 585-597, 2010.
- D. Piyabongkarn, J.Y. Lew, R Rajamani, and J.A. Grogg, “Active driveline torque-management systems,” IEEE Control Systems, 30(4), 86-102, 2010.
- M.C. Walz, Trends in the static stability factor of passenger cars, light trucks, and vans. No. HS-809 868. 2005.
- S.B. Choi, “Practical vehicle rollover avoidance control using energy method,” Vehicle System Dynamics, 46(4), 323-337, 2008.
- J. Yoon, K. Dongshin, and Y. Kyongsu, “Design of a rollover index-based vehicle stability control scheme,” Vehicle system dynamics, 45(5), 459-475, 2007.
- B.C. Chen, “Warning and control for vehicle rollover prevention,” No. 30-00934 UMI. Ann Arbor, MI: University of Michigan, 2001.
- G. Phanomchoeng, and R. Rajamani, “Real-Time Estimation of Rollover Index for Tripped Rollovers with a Novel Unknown Inputs Nonlinear Observer,” IEEE/ASME Transactions on Mechatronics, 19(2), 743-754, 2014.
- R. Rajamani, and N. Piyabongkarn, “New Paradigms for the Integration of Yaw Stability and Rollover Prevention Functions in Vehicle Stability Control,” IEEE Transactions on Intelligent Transportation Systems, 14(1), 249-261, 2013.
- X. Cai, and J. Wu, “Hazardous Chemicals Vehicles Rollover Pre-warning System Based on CPS,” in Proceedings of the 2012 IEEE Sixth International Conference on Software Security and Reliability Companion, 2012.
- D. Konik, “Dynamic drive-the new active roll stabilization system from BMW group-system description and functional improvements,” in Proc. 5th Int. Symp. Avec 2000, Ann Arbor, MI 2000.
- J.R. Kerrigan, N.J. Dennis, D.P. Parent, and S. Purtsezov, “Test system, vehicle and occupant response repeatability evaluation in rollover crash tests: The deceleration rollover sled test,” International Journal of Crashworthiness, 16(6), 583-605, 2011.
- Bo.C. Chen, and H. Peng, “A Real-time Rollover Threat Index for Sports Utility Vehicles,” in Proceedings of the Amencan Control Conference, 1999.
- Bo.C. Chen, and H. Peng, “Rollover Warning Of Articulated Vehicles Based On A Time-To-Rollover Metric,” in Proceedings of the 1999 ASME International Congress and Exposition, Knoxville, TN, November 1999.
- B.L. Boada, M.J. L. Boada, L. Vargas-Melendez, and V. Diaz, “A robust observer based on H1 filtering with parameter uncertainties combined with Neural Networks for estimation of vehicle roll angle,” Mechanical Systems and Signal Processing, 99, 611–623, 2018.
- X. Glorot, and A. Bordes, and Y. Bengio, “Deep Sparse Rectifier Neural Networks,” in Proceedings of the 14th International Conference on Artificial Intelligence and Statistics (AISTATS) 2010.
- L. Wang, N. Zhan, and H. Du, “Real-time Identification of Vehicle Motion-Modes using Neural Networks,” Mechanical Systems and Signal Processing 50-51, 632–645, 2015.
- E.N. Sanchez, L.J. Ricalde, R. Langari, and D. Shahmirzadi, “Rollover Prediction and Control in Heavy Vehicles via Recurrent Neural Networks,” 43rd IEEE Conference on Decision and Control, December 14-17, 2004.
- K. Treetipsounthorn, and G. Phanomchoeng, “Real-Time Rollover Warning in Tripped and Untripped Rollovers with A Neural Network,” in The 4th International Conference on Control Science and Systems Engineering (ICCSSE 2018), Wuhan, China, Aug. 2018.
- S. Hochreiter and J. Schmidhuber, “Long short-term memory,” Neural Computation, 9(8), 1735–1780, 1997.
- R. Dey and F. M. Salemt, “Gate-variants of gated recurrent unit (gru) neural networks,” in 2017 IEEE 60th International Midwest Symposium on Circuits and Systems (MWSCAS). IEEE, 1597–1600, 2017.
- X. Glorot, A. Bordes, and Y. Bengio, “Deep sparse rectifier neural networks,” in Proceedings of the fourteenth international conference on artificial intelligence and statistics, 315–323, 2011.
- P. J. Werbos et al., “Backpropagation through time: what it does and how to do it,” in Proceedings of the IEEE, 78(10), 1550–1560, 1990.
- R. Pascanu, T. Mikolov, and Y. Bengio, “On the difficulty of training recurrent neural networks,” in International Conference on Machine Learning, 1310–1318, 2013.
- J. Chung, C. Gulcehre, K. Cho, and Y. Bengio, “Empirical evaluation of gated recurrent neural networks on sequence modeling,” arXiv preprint arXiv:1412.3555, 2014.
- R. Jozefowicz, W. Zaremba, and I. Sutskever, “An empirical exploration of recurrent network architectures,” in International Conference on Machine Learning, 2342–2350, 2015.
- C. Winkler, K. Campbell, and C. Mink, “Center of gravity height: a round-robin measurement program,” A Technical Report to The Motor Vehicle Manufacturers Association MVMA Project No. 0167A, The University of Michigan, Transportation Reserch Institute, 1991.
- C. E. Rasmussen, Gaussian Processes for Machine Learning. MIT University Press Group Ltd, 2005.
- D. Yuret, “Knet: beginning deep learning with 100 lines of julia,” in Machine Learning Systems Workshop at NIPS 2016, 2016.
- D. P. Kingma and J. Ba, “Adam: A method for stochastic optimization,” CoRR, abs/1412.6980, 2014. [Online]. Available: http://arxiv.org/abs/1412.6980