
Trace-Driven Simulation of LoRaWAN Air Channel Propagation in an Urban Scenario
Volume 5, Issue 6, Page No 211-220, 2020
Author’s Name: Eugen Harinda, Hadi Larijania), Ryan M. Gibson
View Affiliations
Glasgow Caledonian University, Networks and Cybersecurity, School of Computing and Built Environment, Glasgow, G4 0BA, United Kingdom
a)Author to whom correspondence should be addressed. E-mail: H.Larijani@gcu.ac.uk
Adv. Sci. Technol. Eng. Syst. J. 5(6), 211-220 (2020); ![]() DOI: 10.25046/aj050625
DOI: 10.25046/aj050625
Keywords: LoRaWAN, Trace-Simulation, Received Signal Strength, Deterministic models, Empirical Models, Urban Environment

Export Citations
Long-range, Low-Power Wide Area Network (LoRaWAN) is a very scalable solution for the Internet of Things (IoT). Due to the air channel environment’s complexity, connectivity is a crucial parameter for successfully planning and deploying the IoT networks. Measurements and simulations have been used to evaluate LoRaWAN propagation models in the Urban environment, but it is a challenging task. While practical propagation evaluation has been prohibitively expensive, the theoretical modeling results have been less accurate. This paper uses real-world measurements and a trace-driven simulation technique to evaluate the RF propagation models’ prediction performance for LoRaWAN 868 MHz propagation. First, a novel LoRaWAN trace- driven simulation of Glasgow city centre has been performed. Second, LoRaWAN 868 MHz measurements have been used to perform a critical analysis of LoRaWAN trace-driven Radio Frequency (RF) propagation models and validation. The processed trace dataset is composed of GPS coordinates, and the corresponding LoRaWAN received signal strength. The dataset has been extracted from 5017 datasets of LoRaWAN measurements taken from Glasgow city centre. A trace simulation program built-in ICS-Telecom was used to simulate LoRaWAN propagation in the real-world urban environment. Comparison of LoRaWAN simulation traces and the real-world data was performed to evaluate the prediction performance accuracy of Deygout 94, ITU-R 525/526, and COST-Walfish Ikegami (COST-WI) propagation models. All models over-estimated LoRaWAN trace-simulated RSS levels in comparison to collected measurement samples. While Deygout 94 prediction accuracy was higher with mean absolute error (MAE) at 0.83 dBm and standard deviation (SD) at 4.17 dBm, COST-WI performed poorly with MAE and SD at 2.87 dBm and 10.96 dBm respectively.
Received: 31 August 2020, Accepted: 18 October 2020, Published Online: 08 November 2020
1. Introduction
This paper is an extension of work originally presented in The International Conference on UK-China Emerging Technologies, Glasgow, UK, August 2019 [[1]]. The purpose of this work was the application of a trace-based approach to evaluate the prediction capabilities of the conventional propagation models for LoRaWAN networks. As the Internet of Things (IoT) network is steadily growing, an understanding of conventional radio propagation models’ prediction accuracy is key to the successful planning and deployment of Long-range, Low-Power Wide Area Network (LoRaWAN).
Unlicensed IoT technologies allow anyone with an idea to create and deploy IoT applications. Authors in [2] have predicted that a global number of IoT connected devices will rise to 75.44 from 15.4 things. It uses Long-Range (LoRa) modulation technology [4] at the physical layer to achieve long-distance connectivity among the connected things. LoRaWAN end-devices connect to LoRa gateway using Radio Frequency (RF) propagation through the air channel and LoRaWAN network and application servers. Due to the complexity of the air channel environment, connectivity is a crucial parameter for the successful deployment of the IoT networks. To understand whether a LoRaWAN network meets the acceptable connectivity performance, a detailed investigation of the network using radio propagation prediction models is requisite to the network’s deployment. However, Received Signal Strength (RSS) prediction in LoRaWAN networks has become a complex task due to prediction performance differences in RF propagation models. These models’ ability to accurately predict the RSS depends on how correctly they capture factors affecting RF signal propagation in the air channel.
Propagation models rely on natural and environmental factors to calculate signal power attenuation, path loss in the air channel. In the Line-of-Sight (LOS), the signal power attenuators include RF and the distance between end-devices and LoRa gateways. On the other hand, in cities, where Non-Line-of-Sight (NLOS) is dominant, environmental attenuators of signal power include humanmade structures such as dense tall and short buildings, cars, and bridges. The path loss incurred by the propagating signal due to these obstructions is a consolidation of LOS and NLOS path loss due to multipath, scattering, diffraction, and reflection losses. To incorporate sufficient natural and environmental factors in the RF propagation models, numerous empirical propagation models [5] and deterministic propagation models [6] have been designed.
Different empirical and deterministic RF propagation modeling techniques highlight contrasts in prediction performance accuracy and application scenario. Empirical models were designed to predict the RSS in the event of insufficient knowledge of terrain profile data. These models were designed based on actual measurements taken from the propagation environment conditions. They are made of simple mathematical formulae with no reliance on the digital terrain data and are less accurate for a distance range of less than 1 km [7]. On the other hand, deterministic models largely depend on the digital terrain models to predict the RSS. These models take into consideration the free space and NLOS path loss. Accordingly, detailed knowledge of digital terrain models is a prerequisite for their prediction performance. Further contrasts exist within empirical and deterministic models in terms of parametric design consideration and prediction performance accuracy. Empirically, measurements and simulation methods are accurately used to investigate these models’ ability to predict the RSS in radio networks.
Taking measurements from the real-world networks and simulation of the air channel propagation are vital methods used to evaluate the RF models. Studies [5], [6] and [8] have used measurements and simulations to evaluate the performance of various propagation models, but less has been done to validate their applicability on LoRaWAN networks in an urban environment. The studies in [9]– [13] have used only measurements to understand the behavior of air channel propagation on LoRaWAN network operations, but this is an expensive approach as best practices involve taking measurements at the later stages of network optimization. To validate the applicability of empirical propagation models for LoRaWAN in the city environment, our previous work in [14] showed less satisfactory empirical models’ prediction performance against measurements. Trace-driven simulation can bridge the gap between measurement and simulation to evaluate RF propagation models’ performance for LoRaWAN networks.
In this paper, we use real-world measurements and trace-driven simulation technique to evaluate the RF propagation models’ prediction performance for LoRaWAN networks. Trace-driven simulation method can be used to evaluate computer-based models, but it works well if a trace contains the experience required by the trace simulation program [15]. The RF models are implemented in ICS-Telecom [16], and the simulation required a digital terrain model of Glasgow city centre. The simulation that uses a trace that contains the system’s experience makes a more realistic simulation performance [17]. The study utilized a digital terrain model at 25 m and a dataset from Glasgow city centre. This dataset contained 5017 measurements with GPS coordinates and their corresponding LoRaWAN RSS. Trace-driven simulation results were compared against the real-world measurements to evaluate the prediction accuracy of Deygout 94, ITU-R 525/526, and COST-WI. All models over-estimated LoRaWAN trace-simulated RSS but showed superior prediction performance over empirical models in [14]. The result shows that the LoRaWAN network’s trace-driven simulation with these models provides a more realistic RSS prediction than the conventional simulations.
The main contributions of this work are given in the summary below:
- A novel use of measurement and trace-driven simulation of LoRaWAN 868MHz propagation prediction for Glasgow city centre.
- The trace-driven simulation and extraction of LoRaWAN RSS traces spread over the digital terrain model of Glasgow city centre with the minimum, maximum range of trace signal levels, and the total number of trace measurements.
- Critical analysis of LoRaWAN trace-driven RF propagation models and validation with real-world measurements. Deygout 94 prediction accuracy was higher with MAE at 0.83 dBm and SD at 4.17 dBm.
- Visual comparative analysis of trace patterns between the LoRaWAN real-world measurement site in Figure 2. and trace-simulated site in Figure 5.
- Shown the functional relationship (Figure 4.) between tracedriven simulation and the data collection, data processing, and input to the prediction models.
This paper is arranged as follows: Section I briefly introduces LoRa technology, LoRaWAN network, conventional RF propagation models, motivation for performance and evaluation of RF models with trace-driven simulation, and the related work. Section II provides details about measurements and simulation. Section III contains the RF models’ performance analysis and discussion. Finally, section IV presents the conclusion and prospective future work.
1.1. Overview of LoRaWAN and LoRa
LoRaWAN is one of the media access control protocol for lowpower Wide Area Network (WAN). It is a long-range wireless communication technology that enables low-powered IoT devices and applications to communicate over the Internet [18]. LoRaWAN specification V1.0 [3] published in 2015, provides LoRaWAN details to describe the network communication protocol and architecture. The typical LoRaWAN network architecture is a star topology consisting of the end-devices, applications, gateway, and the server. These devices may be connected through the air or cables. LoRaWANenabled devices may be categorized as Class A, B, or C, depending on the capacity for a trade-off between downlink latency and batterylife saving. Figure 1. describes a typical star-topology of LoRaWAN architecture. While LoRaWAN defines the architecture and system communication protocol, LoRa is a modulation technology defined at the physical layer.

Figure 1: Basic LoRaWAN Network Architecture
LoRa is a spread spectrum technique adapted by Semtech [4] and implemented at the physical layer for digital wireless modulation. It was derived from chirp spread spectrum technology [19] to achieve a long-range radio communication in LoRaWAN networks while retaining the ability to operate at low-power levels. Furthermore, the LoRaWAN network employs different spreading factors (SF), another key technology to allow a trade-off between the coverage and data rates [20]. Higher SF configuration helps the LoRaWAN network to transmit further, but at the cost of low data rates, and vice-versa. Thus, the LoRaWAN network delivers the required connectivity to enable the LoRa end-devices to transmit data over the air channel to the gateway and then to the network and application servers.
1.2. Radio Propagation Models
RF propagation models[21] characterize the propagation of radio waves as function carrier frequency, distance, and other NLOS factors in the air channel environment. These RF models, deterministic, semi-empirical, and empirical, employ several attenuation factors, including LOS, diffraction, multipath, to estimate the RSS. These models perform connectivity analysis in radio networks to fast-track radio coverage information. Radio propagation effects are heavily site-specific and depend on configuration parameters such as terrain cover, operating frequency, distance, transmitter, and receiver antenna height. In this study, commonly used RF models in ICS-Telecom, Deygout 94, ITU-R 525/526, and COST-231 Walfish-Ikegami models are evaluated for RSS prediction accuracy in LoRaWAN network. These models are respectively, deterministic, semi-deterministic, and empirical.
1.3. Deygout 94
Deygout 94 model determines diffraction attenuation for N successive knife-edge or rounded obstacles. The model is based on the idea of the main signal blocking component [22], which exerts considerably high obstruction losses to the link between the transmitting and receiving ends. The overall diffraction loss, LD, is given as:
where L1 is the diffraction loss in case of one main obstruction between the transmitter and receiver, and Vi is the diffraction parameter for the ith knife-edge. The total path loss is the sum of Deygout 94 diffraction losses, free space, sub-path attenuation, and 3D losses that are implemented in ICS-Telecom.
1.4. ITU-R 525/526
The ITU-R 525/526 uses ITU-R P 525 [23] to calculate the free space loss and ITU-R P 526 to calculate attenuation due to diffraction [24]. The concept of ITU-R 526 calculation of diffraction losses is similar to Deygout 94. It calculates sub-path and diffraction losses using the Delta Bullington diffraction model [25]. The ITU-R 525 calculates the basic free space transmission loss, PA0 between isotropic antennas, as follows:
![]()
where f is frequency (MHz) and d is the distance (km).
1.5. COST-231 Walfish-Ikegami
COST 231 Walfish-Ikegami (COST-WI) the model [26] is a combination of Walfish and Ikegami models. Unlike the deterministic model that requires digital terrain models, including the buildings layer, COST-WI is an empirical model that requires characteristic values. It improves the path loss prediction by considering more data to characterize medium-sized flat urban environments [27]. Compared to other empirical models, the COST-WI parameters include the heights hb of the building, the separation between buildings d, the widths of roads w, and the angle θ to the direct radio path. The range of fundamental parameters considered is 800-2000 MHz for frequency, 1-3 m, 4-50 m, 0.02-5 km for distance, and end-device and gateway antenna height, respectively. The model calculates path loss due to the LOS and NLOS. The mathematical formulae for LOS and NLOS are respectively defined in (3) and (4) below.
![]()
If NLOS is the case, then path loss calculation is a combination of attenuation due to free space PLOS , the rooftop to street diffraction, and the scattering Lrts, and the multiple screen diffraction loss Lmsd. The totality of this (NLOS) path loss is described mathematically [27? ] as follows:
![]()
The Lrts, the diffraction loss from the rooftop to the street is determined as in the following formula:
![]()
where, w is width of the roads, hb and hm are the height of building and end-device mobile station respectively. The street orientation correction factor, Lori[28] is given as:
where α is the street orientation angle, Lmsd, the multiscreen loss,
represents diffraction loss from multiple obstacles. The following mathematical representation determines it:

where the correction factors, Lbsh and Ka represent path loss when the gateway is above and below the rooftops, respectively. sb represents buildings separation. The terms Kd and Kf quantify the diffraction loss as a factor of the distance, d and frequency, f, and are defined in[26] as follows:

1.6. Motivation for Performance and Evaluation of RF Models with Trace-driven Simulation
The evaluation of how the air channel affects the propagation of wireless communication signals is a challenging task. In cities, the physical environment, including buildings, bridges, people’s motion, and vehicles, adversely affect propagating RF signals. To accurately evaluate the effects of the physical environment in cities, simulation methods and models have become an integral part of wireless communication systems’ planning and deployment. However, it has been challenging to identify which RF propagation models, from their significant number, produce realistic predictions of the RSS. The assumption that simulation models can be applied to modeling propagation effects in different environments, protocols, and applications have often been proved less accurate.
The literature is yet to contain either the RF propagation prediction models or an established understanding of the actual RF propagation prediction models’ performance for the LoRaWAN propagation system in cities. Studies that attempted to evaluated LoRAWAN propagation system performance in different urban scenarios used the analysis of the real-world measurements [9]–[13]. However, the use of field measurement to characterize the impact of the air channel on RF propagation is usually costly as it involves real systems. In wireless communication networks, taking realworld measurements is usually the last phase of network planning and deployment, aiming to optimize a wireless network system performance. Instead, the network planning tools use propagation prediction models to estimate path loss due to air channel conditions. In our previous work [14], we evaluated conventional empirical propagation models’ performance to determine applicability for predicting LoRaWAN RSS in an urban scenario. Although the study showed that COST-WI had better prediction performance for LoRaWAN RSS than other models considered for the study, this result was over-predicted by 6.48 dBm. Therefore, this indicates that empirical RF models lack accuracy in attempts to capture paths loss over the rooftops, diffraction, and reflections arising from the buildings and streets set up, and these factors are better handled with deterministic models.
In this paper, we intend to evaluate Electromagnetic Wave (EM) based deterministic models to understand the applicability of these models to predict LoRaWAN RSS in urban areas. The EM deterministic models’ ability to accurately consider the phenomena of path loss over the rooftops, diffraction, reflections from buildings, dispersion, and wave running are essential features for dense urban outdoor RF propagation [29]. Deterministic models require the use of accurate and high-quality terrain models of the environment. However, in the presence of low-quality terrain models, the use of trace-driven simulation for evaluation of deterministic and semi-deterministic models produced more accurate LoRaWAN RSS prediction than empirical RF models. This study can give insight into the effectiveness of trace-simulation with standard propagation models for evaluation of IoT connectivity with LoRaWAN networks at 868 MHz in the NLOS urban environment.
1.7. Related Work
Trace-driven simulation is a technique that utilizes both measurements and simulation for evaluation and prediction of the performance of the computer-based systems [30]. All the trace-driven studies reviewed in this paper used a software probe to collect measurement trace data except [31], which used device-specific data collection from the testbed. Trace-driven simulation technique has been introduced in [32] as a technique that uses analysis of measurement trace data to redo similar experimental circumstances in the simulations. Trace-driven simulation has been used to perform a realistic simulation.
Trace-driven simulation use analysis of the experimental trace data in an attempt to recreate simulation of the experimental conditions. Authors in [33] stated that sufficient and accurate measurement datasets could directly serve as a basis of propagation performance prediction or fitting the RF models. Trace-driven simulation was used in [34] to model the error behavior of the WaveLAN wireless channel. Chia et al [35] proposed an Automata-Synchronized Replay (EAR) system software to perform trace-based simulation of the measured packets received over the Wireless Local Area Network. The EAR was used to control trace packet, synchronize the environmental effects in trace packet with the packets, and other signals received from the real-world environment. The system implementation results show that the EAR achieved an event reproduction rate of 92.45% under a fading environment. Trace-driven simulation can be used to evaluate wireless link models.
In [36], the authors presented a Wireless Link Simulator (WiLinkSim). This simulator implemented models based on mathematical distribution to correctly represent wireless errors (bit error rate) due to the air channel’s effects. WiLinkSim utilizes trace-driven models for realistic simulation of Rayleigh and multipath fading and during the deployment of a real-world network. G. Judd and P. Steenkist [37] indicated that trace-driven simulation is one of the accurate methods to model RF signal propagation. Authors in [38] used measurement error traces to configure stochastic error models to reproduce the signal-to-noise-plus-interference ratio errors of the received wireless signal. The accuracy for Bernoulli, Gilbert-Elliot, and chaotic map error models’ ability to reproduce or estimate the measured dataset was performed by comparing the measured traces with models’ simulated traces. The results showed that Gilbert-Elliot and chaotic map error models attained enough accurate reproduction of the measured traces.
2. Measurement Setup and Simulation
In the first step, the measurement trace dataset was collected, and then, the RF propagation prediction models were trace simulated using the measurement processed trace data. The measurement trace dataset was collected from an experimental LoRaWAN network installed in Glasgow City using LoRaWAN end-devices and Servers. The processed trace data needed for trace-simulation was selected from the measured data. This trace data served as input data to the trace simulation program. Below is the detailed description of data collection, data processing, and trace-simulation setup.
Table 1: Measurement and Trace-simulation Parameters.
| S/N | Parameters | Values |
| 1 | Operating frequency Band | 868 MHz |
| 2 | Bandwidth | 125 kHz |
| 3 | End-device transmit power | 14 dBm |
| 4 | Number of Gateway | 3 m |
| 5 | Gateway antenna heights | 30, 27 and 27 m |
| 6 | End-device antenna height | 1.5 m |
| 7 | Measurement spreading factor (SF) | 7-12 |
| 8 | Trace-simulation spreading factor (SF) | 7, 8 and 12 |
| 9 | Maximum transmit and receive distance | 2275 m |
2.1. Data Collection Setup
Capturing the field measurements is essential in characterizing air channel impact on LoRaWAN system applications under real-world conditions. We performed an experimental field study to acquire real-world LoRaWAN measurements from Glasgow city, Scotland, the UK. On the map, the city’s latitude and longitude are 55.8642◦ N and 4.2518◦ W, respectively. The city is built at the bank of River Clyde and constitutes tall and huge buildings and open spaces. Data collection was performed in this city’s environment to characterize the effects the NLOS has on the air channel for RF propagation of the LoRaWAN network. The leading equipment used to collect data is the LoRaWAN end-device and three gateways. The former was a Multitech mDot module [39] with LoRa and LoRaWAN protocol, regulated by a single board Raspberry Pi computer, whereas the later constituted Kerlink gateways, enabled with Semtech LoRa SX1301 chip [40]. The Raspberry Pi computer was connected to a 3G/GPS module to keep location records for the received from transmitting end-device operated at 868 MHz and 14 dBm.
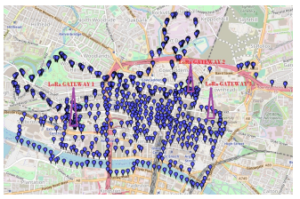
Figure 2: A Google map showing the location of the three LoRa Gateways installed in Glasgow city centre and measurements waypoints. The blue markers on the map represent GPS and their corresponding LoRaWAN RSS waypoints obtained during the measurements
The gateways operated at three locations. The first gateway at Glasgow Caledonian University, 30 m on top of George More building. The second gateway at Strathclyde University, 27 m on top of James Weir building, and the third gateway placed at 27 m on top of Skypark. The distance between gateway at Skypark and James Weir building is 2005 m apart, and both buildings are respectively, 590 m and 1900 m from George More building. Figure 2. is the display of a 1:300 Google map showing the topography of Glasgow city centre used for the LoRaWAN RSS measurements. It indicates the location of the three LoRa Gateways and measurement waypoints. The three gateways utilize the cable and mobile networks to connect to the network server to record packets received from the transmitting enddevice. The mobile end-device transmissions operated the 868 MHz and 14 dBm. Table 1. shows details of LoRaWAN transmission parameters. The packets were sequentially transmitted, and success or failure to receive an ACK message was recorded. These packets altered between 7-12 the spreading factor. We collected the data in a backpack logger unit at the walking speed in Glasgow city. The data collected in the network server and backpack logger unit were combined and processed in a database. This data shall be known as measurement trace data.
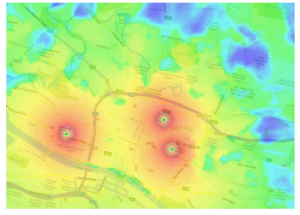
Figure 3: LoRaWAN 868 MHz simulation without traces over a Bing digital terrain model of Glasgow city centre. The three green squares in a reddish/brown color represent the simulated LoRa gateways. Colors represent the variation of signal levels, with blue indicating the weakest and reddish the strongest signals.
2.2. Data Processing and Input to Models
To prepare LoRaWAN system measurements for a trace simulation program, we processed measurement trace data. Measurement trace data contained feature data and metadata not required by the trace simulation program. A total of 5008 measurement trace data collected in the backpack logger unit and network server was loaded into the database. We used the command line manipulation commands to pare measurement trace data down to locations coordinates and the RSS suitable trace simulation. Consequently, manipulation of measurement raw data resulted in 5008 datasets for latitude, longitude, and corresponding RSS required for the ICS-Telecom trace simulation function.
The trace simulation program is built from LoRaWAN and RF propagation system models. LoRaWAN system configuration parameters in Table I. and RF propagation models are introduced in section I. The LoRaWAN parameters in this table are based on the LoRaWAN band regulation in the European Union and the physical position of gateway and end-device antenna heights used during the measurements. Similarly, the maximum transmission is the distance between the transmission and reception attained during the measurements. However, due to lack of mobility during the simulation, the SF was heuristically fixed at 7, 8, and 12. The trace simulation program imported the processed trace data through the measurement import function to perform a trace-driven simulation. It executes the LoRaWAN and RF propagation environment using the processed trace data. The trace-driven simulation program’s output, which is of interest to this work, was the trace-driven RSS. This output is compared with the RSS in the processed trace data for performance analysis. Figure 4. shows a block diagram of the trace-driven simulation model. This model’s main parts are; data collection, data processing, and LoRaWAN and RF propagation conceptual models.

Figure 4: Block Diagram of Trace-driven simulation
2.3. Trace-Driven Simulation
The trace-driven simulation requires a combination of system measurements and simulation [41]. In this paper, trace-simulation set up involved importing processed trace data and configuration of the Glasgow city centre digital terrain model. When the trace simulation program starts, it loads the processed measurement trace data and the LoRaWAN RF propagation system model to reproduce the same experimental conditions in the ICS-Telecom. Authors in [? ] showed that trace-simulation produces more realistic simulation results than conventional simulation. In [42], the authors provided a detailed account of the advantages of trace-simulation over the conventional simulation. To simulate Glasgow city centre terrain, we imported and configured a 1:300 Bing terrain model of Glasgow city centre at 25 m resolution into ICS-Telecom. However, lowresolution terrain maps such as 25 m provided a digital elevation model and the city’s clutter to the simulator, leaving out the building layer. This input facilitated the simulation of the LoRaWAN system in Glasgow city centre. Over the terrain map, we placed three system gateway models. Each gateway model location configuration on the terrain map matched the latitude and longitude of system gateways used during the LoRaWAN measurements. Like the measurement system, the distance between LoRaWAN gateway models at Strathclyde University and Skypark on the terrain map represents 2005 m apart. The respective distance between these gateway models from Glasgow Caledonian University represents 590 m and 1900 m on the ground. Figure 3. shows the LoRaWAN 868 MHz simulation system set up without traces over a Bing digital terrain model of Glasgow city centre. The next step was to load the processed trace data for trace-driven simulation of the LoRaWAN 868 MHz system.

Figure 5: A trace-driven simulation of LoRaWAN 868 MHz over a Bing digital terrain model of Glasgow city centre. The three green squares at the base of red triangles represent the simulated LoRa gateways. Colors represent trace-driven RSS data. The blue color refers to the weakest signals, and reddish/brown refers to the strongest signals. The trace-driven data follows waypoints of the real-world measurements.
Through the measurement import function, the trace simulation program imported the processed trace data. Presented to the digital terrain map are LoRaWAN system measurement locations, a set of latitude and longitude coordinates. Figure 5. shows a trace-driven simulation of LoRaWAN 868 MHz over a 1:300 Bing digital terrain model of Glasgow city centre. It presents the trace-simulated RSS in the previously identified location with the processed trace data, which contains latitude, longitude, and corresponding RSS. At the base of the trace simulation program, there are LoRaWAN and RF propagation system models. These models are the designed base of the trace-driven simulation program. LoRaWAN and RF conceptual system models comprise LoRa modulation, LoRaWAN network, RF propagation models, and the terrain model. The configuration of the LoRaWAN simulation system parameters is similar to LoRaWAN system parameters shown in Table I. On the other hand, the configured RF propagation models are described in Section I.
After the trace-simulation, extraction of the predicted trace-driven LoRaWAN RSS followed for each of the RF models.
The extraction of trace-simulated LoRaWAN RSS from the LoRaWAN simulation system provided a trace-simulated dataset required for prediction performance analysis. The minimum trace signal level was set to -140 dBm and the maximum trace signal level set to -61 dBm. The total number of trace data was set to 5008. The trace-simulated LoRaWAN RSS are spread over the digital terrain map of Glasgow city centre in Figure 5. and the color code shows the varying signal strength, which depends on different factors, including clutter obstructions in the environment. The predicted trace-driven dataset for each propagation model was extracted from the LoRaWAN simulation system digital terrain map. Alternatively, the predicted trace-driven dataset can be exported from the simulation system. To validate the obtained trace-simulated dataset, we compared the RF propagation models’ trace-simulated LoRaWAN RSS with the LoRaWAN system RSS, measured from Glasgow city centre.
3. Performance Analysis and Discussion
To evaluate models’ prediction performance accuracy, we validated LoRaWAN trace-simulation with measurement trace data. Common mathematical error methods measured the prediction accuracy of the models. The error performance metrics used to represent the error between measurement and simulation are the Mean Square
0
Error (MSE), ∆yi, Mean Absolute Error (MAE), |∆y|, and Standard
Deviation (SD), σe. In this paper, N indicates the total number of measured or simulated data samples, whereas ∆yi denotes the difference between predicted and measured datasets. While MAE is used as a measure of RF models prediction error, SD measures the average distance between measurement and the predicted dataset. C. J. Willmott and K. Matsuura [43] examined the ability of MAE and Root-Mean-Square Error (RMSE) to represent the average error performance of a model. The authors concluded that MAE is a preferred measure of one dimension average error performance compared to RMSE, which is suitable for more than one error performance of a model. However, in [44], authors argued that both MAE and RMSE may be used to evaluate the average error prediction accuracy of the models. In this study, the MAE is considered to be an intuitive measure of average error prediction accuracy in RF models.
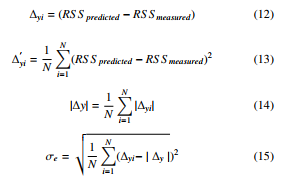
Table 2: Error Performance Metrics
| Parameters | Deygout94 | ITU-R525/526 | COST-WI |
| MSE | 18.7812 | 20.978 | 24.2155 |
| MAE | 0.83 | 1.01 | 2.87 |
| SD | 4.17 | 5.84 | 10.96 |
The comparative analysis of RF models prediction accuracy showed that all the three investigated models over-estimated the RSS measurements. However, Deygout 94 registered higher prediction accuracy with MAE at 0.83 dBm. The MAE for ITU-R 525/526 and COST-WI was 1.01 dBm and 2.87 dBm, respectively.
In terms of prediction error, Deygout 94 prediction had the lowest
Mean Square Error, MS E at 18.7812 dBm, followed by the ITUR 525/526 and COST-WI with MS E at 20.978 dBm and 24.2155 dBm respectively. Furthermore, Deygout 94 exhibited the lowest standard deviation, σe at 4.17 dBm, followed by the ITU-R 525/526 and COST-WI at 5.84 dBm and 10.96 dBm respectively. This result implies that Deygout 94, a deterministic model, performs better RSS predictions than the ITU-R 525/526 and COST-WI models. COSTWI poor prediction performance is attributed to its reliance on the buildings’ information. Table II. shows models’ prediction error performance metrics calculated in equations 12-15 for MS E, MAE and σe using measured and trace-driven dataset in the NLOS city environment. Overall, it can be observed that Deygout 94 obtained low prediction error performance.
Density and vertical obstructions presented to the application through a high-resolution DTM is crucial for modeling RF propagation [45]. The DTM at 25m resolution that presented the NLOS obstructions over Glasgow city centre terrain landscape into the ICS-Telecom lacked detailed buildings’ information. The graphical representation in Figure 6. shows the relationship between the LoRaWAN 868 MHz measurement dataset and models tracesimulation performance in the NLOS conditions in Glasgow city centre. The measurement and trace-driven simulated data are plotted as a RSS function, in dBm and distance, d in meters. The visible gap between measurements and trace-driven simulation may be attributed to the low resolution of the DTM, which fails to represent actual NLOS conditions in Glasgow city centre to the Trace Simulation Program. However, trace-driven RSS trend against the distance follows RSS measurements with Walfish-Ikegami keeping more distance and Deygout 94, making a closer drift with measurements. The clustered data visible on the graph indicates many RSS collected at specific locations due to reduced NLOS obstructions. On the other hand, the flattened regions are an indicator of either low variations of LoRaWAN RSS as signal reception reduce or completely blocked due to an increase in density and the height of buildings in the City’s air channel.

Figure 6: Models trace-simulated performance comparison with LoRaWAN 868 MHz measurements. The vertical axis plots real-world LoRaWAN RSS measurements, dBm and models’ trace-simulated LoRaWAN RSS data, dBm. The horizontal axis represents the distance, d in m.
The trace-driven simulated models improved prediction accuracy performance compared to empirical models in the previous study [14]. Both studies were carried out for LoRaWAN 868 MHz in Glasgow city centre, and the same measurement dataset was used for validation. Table III. shows the comparison of prediction accuracy of empirical models, in cyan color heading and trace-simulated models, in the yellow color heading. The improvement in tracesimulated predictions compared to empirical RF models can be attributed to measurement traces and differences in model design and application. The spreading of LoRaWAN RSS over the Glasgow city centre map shows how trace-driven simulation leads closer to measurements.
Table 3: Comparison of Emprical and Trace-simulated Models Prediction Accuracy
| Parameters | Deygout94 | ITU-R525/526 | COST-WI-Traced | Okumura-Hata | COST231 | COST-WI | |
| MSE | 18.7812 | 20.978 | 24.215 | 48.84021 | 57.2056 | 96.746 | |
| MAE | 0.83 | 1.01 | 2.87 | 5.564 | 6.131 | 7.413 | |
| SD | 4.17 | 5.84 | 10.96 | 9.158 | 11.425 | 7.454 | |
The analysis of measurements and simulation mapping over Glasgow city centre’s map shows significant variation in the RSS spreading. The simulation mapping of RSS in Figure 3. spreads all over the map compared to the mapping of RSS measurement, which follows the data collection path. On the other hand, LoRaWAN trace-driven simulation mapping in Figure 5. attains a close match to the mapping of RSS measurements in Figure 2. when the minimum and maximum trace signal level and the total number of trace dataset is set. The closer pattern between the measured and tracedriven RSS mapping matches the claims that trace-driven simulation performs realistic simulation [32]. This pattern shows that the tracedriven simulation technique can perform a realistic evaluation of RF models for the planning and deployment of LoRaWAN in cities.
4. Conclusion and Future work
We have created a trace-driven simulation of LoRaWAN 868 MHz for Glasgow city centre. Trace-driven simulation techniques using the real-world measurement trace dataset make it possible for RF propagation models to produce realistic RSS predictions of LoRaWAN radio links. This paper has used measurements to perform trace-driven simulation over the DTM of Glasgow city centre. We have used LoRaWAN trace-driven RF propagation models to analyse and evaluate several RF propagation models’ prediction performance accuracy for LoRaWAN 868 MHz. The RF models considered in this study are Deygout 94, ITU-R 525/526, and COST-WI. The trace simulation program, built in the ICS-Telecom, imported 5017 processed trace datasets measured from an experimental LoRaWAN 868 MHz network deployed in Glasgow city centre. The processed trace dataset contained the latitude, longitude, and the corresponding measurement RSS. The comparative performance analysis of trace-driven LoRaWAN simulation traces and the real-world measured LoRaWAN processed trace dataset showed that RF propagation models produce realistic LoRaWAN RSS predictions.
All models over-estimated LoRaWAN trace-simulated RSS levels in comparison to real-world collected data samples. However, a comparison of trace-driven simulated models and empirical RF models shows that trace-simulated RF models produce a more accurate prediction. Deygout 94 prediction accuracy was the higher with MAE at 0.83 dBm and SD at 4.17 dBm. COST-WI cannot
be used for simulation of LoRaWAN coverage estimation in an urban environment unless high-resolution DTM models are used in ICS-Telecom. Currently, most studies use measurements to evaluate LoRaWAN performance. This approach is expensive, and tracedriven simulation can be a better option. Although it requires DTM, the use of even low-resolution DTM produces results better than conventional models. The random neural network could be used to design a more accurate and inexpensive RF propagation model in the future.
- E. Harinda, H. Larijani, R. M. Gibson, “Trace-Driven Simulation for Lo- RaWan868 MHz Propagation in an Urban Scenario,” in 2019 UK/ China Emerg- ing Technologies (UCET), 1–5, 2019, doi:10.1109/UCET.2019.8881854.
- R. Taylor, D. Baron, D. Schmidt, “The world in 2025 – predictions for the next ten years,” in 2015 10th International Microsystems, Packaging, As- sembly and Circuits Technology Conference (IMPACT), 192–195, 2015, doi: 10.1109/IMPACT.2015.7365193.
- T. E. T. K. I. O. N. Sornin (Semtech), M. Luis (Semtech), “LoRaWANTM Specification,” LoRaWANTM Specification v1.1 — LoRa AllianceTM, 2015, 2015.
- LoRaQR Alliance, “A technical overview of LoRaQR and LoRaWANTM,”
https://lora-alliance.org/sites/default/files/2018-04/ what-is-lorawan.pdf/, 2015, [Online; accessed 25-September-2018]. - V. S. Abhayawardhana, I. J. Wassell, D. Crosby, M. P. Sellars, M. G. Brown, “Comparison of empirical propagation path loss models for fixed wireless ac- cess systems,” in 2005 IEEE 61st Vehicular Technology Conference, volume 1, 73–77 Vol. 1, 2005, doi:10.1109/VETECS.2005.1543252.
- E. Greenberg, E. Klodzh, “Comparison of deterministic, empirical and physical propagation models in urban environments,” in 2015 IEEE International Con- ference on Microwaves, Communications, Antennas and Electronic Systems (COMCAS), 1–5, 2015, doi:10.1109/COMCAS.2015.7360394.
- C. Braithwaite, M. Scott, UMTS network planning and development: design and implementation of the 3G CDMA infrastructure, Elsevier, 2003.
- O. Fratu, A. Martian, R. Craciunescu, A. Vulpe, S. Halunga, Z. Zaharis, P. Lazaridis, S. Kasampalis, “Comparative study of Radio Mobile and ICS Telecom propagation prediction models for DVB-T,” in 2015 IEEE Interna- tional Symposium on Broadband Multimedia Systems and Broadcasting, 1–6, 2015, doi:10.1109/BMSB.2015.7177260.
- R. Sanchez-Iborra, J. Sanchez-Gomez, J. Ballesta-Vin˜as, M.-D. Cano, A. Skarmeta, “Performance Evaluation of LoRa Considering Scenario Condi- tions,” Sensors, 18(3), 772, 2018, doi:10.3390/s18030772.
- A. Augustin, J. Yi, T. Clausen, W. Townsley, “A Study of LoRa: Long Range & Low Power Networks for the Internet of Things,” Sensors, 16(9), 2016, doi:10.3390/s16091466.
- L. Feltrin, C. Buratti, E. Vinciarelli, R. De Bonis, R. Verdone, “LoRaWAN: Evaluation of Link- and System-Level Performance,” IEEE Internet of Things Journal, 5(3), 2249–2258, 2018, doi:10.1109/JIOT.2018.2828867.
- A. J. Wixted, P. Kinnaird, H. Larijani, A. Tait, A. Ahmadinia, N. Strachan, “Evaluation of LoRa and LoRaWAN for wireless sensor networks,” in 2016 IEEE SENSORS, 1–3, 2016, doi:10.1109/ICSENS.2016.7808712.
- J. Petajajarvi, K. Mikhaylov, A. Roivainen, T. Hanninen, M. Pettissalo, “On the coverage of LPWANs: range evaluation and channel attenuation model for LoRa technology,” in 2015 14th International Conference on ITS Telecommu- nications (ITST), 55–59, 2015, doi:10.1109/ITST.2015.7377400.
- E. Harinda, S. Hosseinzadeh, H. Larijani, R. M. Gibson, “Comparative Per- formance Analysis of Empirical Propagation Models for LoRaWAN 868MHz in an Urban Scenario,” in 2019 IEEE 5th World Forum on Internet of Things (WF-IoT), 154–159, 2019, doi:10.1109/WF-IoT.2019.8767245.
- J. W. C. Fu, J. H. Patel, “Trace driven simulation using sampled traces,” in 1994 Proceedings of the Twenty-Seventh Hawaii International Conference on System Sciences, volume 1, 211–220, 1994, doi:10.1109/HICSS.1994.323170.
- I. Telecom, “ATDI,” 2014.
- S. W. Sherman, J. C. Browne, “Trace Driven Modeling: Review and Overview,” in Proceedings of the 1st Symposium on Simulation of Computer Systems, ANSS ’73, 200–207, IEEE Press, 1973, doi:10.1109/HICSS.1994.323170.
- D. Singh, O. G. Aliu, M. Kretschmer, “LoRa WanEvaluation for IoT Com- munications,” in 2018 International Conference on Advances in Computing, Communications and Informatics (ICACCI), 163–171, 2018, doi:10.1109/ ICACCI.2018.8554713.
- B. Reynders, S. Pollin, “Chirp spread spectrum as a modulation technique for long range communication,” in 2016 Symposium on Communications and Vehicular Technologies (SCVT), 1–5, 2016, doi:10.1109/SCVT.2016.7797659.
- F. Van den Abeele, J. Haxhibeqiri, I. Moerman, J. Hoebeke, “Scalability Anal- ysis of Large-Scale LoRaWAN Networks in ns-3,” IEEE Internet of Things Journal, 4(6), 2186–2198, 2017, doi:10.1109/JIOT.2017.2768498.
- S. Faruque, Radio frequency propagation made easy, Springer, 2014.
- J. Deygout, “Multiple knife-edge diffraction of microwaves,” IEEE Transac- tions on Antennas and Propagation, 14(4), 480–489, 1966, doi:10.1109/TAP. 1966.1138719.
- R. ITU, “ITU-R P. 525-3,” Calculation of Free-Space Attenuation, ITU-R Recommendation, 2016.
- P.-. ITU-R, “A path-specific propagation prediction method for point-to-area terrestrial services in the VHF and UHF bands,” 2014.
- C. Lee, S. Park, “Diffraction Loss Prediction of Multiple Edges Using Bulling- ton Method with Neural Network in Mountainous Areas,” International Journal of Antennas and Propagation, 2018, 2018, doi:10.1155/2018/8737594.
- D. Har, A. M. Watson, A. G. Chadney, “Comment on diffraction loss of rooftop-to-street in COST 231-Walfisch-Ikegami model,” IEEE Transactions on Vehicular Technology, 48(5), 1451–1452, 1999, doi:10.1109/25.790519.
- J. Milanovic´, G.Simac, K. Mazor, “Performance analysis of empirical propa- gation model for long term evaluation (LTE) network,” in 2016 International Conference on Smart Systems and Technologies (SST), 69–74, 2016, doi: 10.1109/SST.2016.7765635.
- P. Frangos, D. Jaggard, S. Sautbekov, G. Georgiev, S. Savov, “Propagation of electromagnetic waves in terrestrial environment for applications in wireless telecommunications,” 2014, doi:10.1155/2014/297082.
- W. J. Krzysztofik, “Radio Network Planning and Propagation Models for Urban and Indoor Wireless Communication Networks,” 2018.
- H. Lucas Jr, “Performance evaluation and monitoring,” ACM Computing Sur- veys (CSUR), 3(3), 79–91, 1971, doi:https://doi.org/10.1145/356589.356590.
- G. T. Nguyen, R. H. Katz, B. Noble, M. Satyanarayanan, “A trace-based ap- proach for modeling wireless channel behavior,” in Proceedings of the 28th conference on Winter simulation, 597–604, 1996, doi:10.1145/256562.256764.
- P. Owezarski, N. Larrieu, “A trace based method for realistic simulation,” in 2004 IEEE International Conference on Communications (IEEE Cat. No.04CH37577), volume 4, 2236–2239 Vol.4, 2004, doi:10.1109/ICC.2004. 1312915.
- G. Hampel, D. Abush-Magder, A. Diaz, L. M. Drabeck, M. J. Flanagan, J. M. Graybeal, J. D. Hobby, M. MacDonald, P. A. Polakos, J. Srinivasan, H. Trickey, L. Zhang, G. Rittenhouse, “The new paradigm for wireless network optimization: a synergy of automated processes and human in- tervention,” IEEE Communications Magazine, 43(3), S14–S21, 2005, doi: 10.1109/MCOM.2005.1404593.
- G. T. Nguyen, B. Noble, R. H. Katz, M. Satyanarayanan, “A trace-based approach for modeling wireless channel behavior,” in Proceedings Winter Simulation Conference, 597–604, 1996, doi:10.1145/256562.256764.
- C. Ku, Y. Lin, Y. Lai, P. Li, K. C. Lin, “Real traffic replay over WLAN with envi- ronment emulation,” in 2012 IEEE Wireless Communications and Networking Conference (WCNC), 2406–2411, 2012, doi:10.1109/WCNC.2012.6214199.
- H. Bai, M. Atiquzzaman, “Error modeling schemes for fading channels in wireless communications: A survey,” IEEE Communications Surveys Tutorials, 5(2), 2–9, 2003, doi:10.1109/COMST.2003.5341334.
- G. Judd, P. Steenkiste, “Using Emulation to Understand and Improve Wireless Networks and Applications,” NSDI’05, 203–216, USENIX Association, USA, 2005, doi:10.5555/1251203.1251218.
- M. Wellens, M. Petrova, J. Riihijarvi, P. Mahonen, “Building a better wireless mousetrap: need for more realism in simulations,” in Second Annual Confer- ence on Wireless On-demand Network Systems and Services, 150–157, 2005, doi:10.1109/WONS.2005.6.
- MultiTech, “Long Range LoRa R Modules (MTDOT Series),” https://www. multitech.com/brands/multiconnect-mdot, 2019, [Online; accessed 03-November 2020].
- LoRa R Alliance, “Wireless and sensing products datasheet,” https://www. semtech.com/uploads/documents/sx1301.pdf, 2017, [Online; accessed 25-September-2019].
- S. W. Sherman, “Trace driven modeling: An update,” ACM SIGSIM Simula- tion Digest, 7(4), 87–91, 1976, doi:10.1145/1013610.807302.
- S. W. Sherman, J. Browne, “Trace driven modeling: Review and overview,” in Proceedings of the 1st symposium on Simulation of computer systems, 200–207, 1973, doi:10.5555/800241.807240.
- C. J. Willmott, K. Matsuura, “Advantages of the mean absolute error (MAE)? over the root mean square error (RMSE) in assessing average model perfor- mance,” Climate research, 30(1), 79–82, 2005, doi:0.3354/cr030079.
- T. Chai, R. R. Draxler, “Root mean square error (RMSE) or mean absolute error (MAE)–Arguments against avoiding RMSE in the literature,” Geoscien- tific model development, 7(3), 1247–1250, 2014, doi:https://doi.org/10.5194/ gmd-7-1247-2014.
- R. J. Peckham, J. Gyozo, Digital terrain modelling, Springer, 2007.