
The Effect of E-Service Quality on Customer Satisfaction and Loyalty (Case Study at E-Marketplace XYZ in Indonesia)
Volume 5, Issue 6, Page No 206-210, 2020
Author’s Name: Hanny Juwitasarya), Christian Christian, Edi Purnomo Putra, Hilman Baskara, Mohammad Wildan Firdaus
View Affiliations
School of Information Systems, BINUS University, Jakarta, 11480, Indonesia
a)Author to whom correspondence should be addressed. E-mail: hjuwitasary@binus.edu
Adv. Sci. Technol. Eng. Syst. J. 5(6), 206-210 (2020); ![]() DOI: 10.25046/aj050624
DOI: 10.25046/aj050624
Keywords: Information Systems, E-Service Quality, Customer Satisfaction, Customer Loyalty

Export Citations
Online transactions make it easy for people to get products or sell the products through online applications. The success and failure of online sales depends on how satisfied and loyal the customer is to the service of the product or business which can certainly influence and increase competition between the online sales industry. Based on that background we want to measure how much influence the quality of services provided by the Online Marketplace to customers has an impact on customer satisfaction and customer loyalty. The measurement method used is to use E-Service Quality, to determine customer satisfaction (Customer Satisfaction) and determine the level of customer loyalty (Customer Loyalty). This research uses a quantitative approach and uses random sampling techniques. Data collection using a questionnaire with data samples totaling 102 respondents. The results of this study indicate that there is a significant relationship between E-Service Quality, Customer Satisfaction and Customer Loyalty to customers that increase customer online shopping transactions so that companies are able to compete with other companies.
Received: 16 June 2020, Accepted: 25 September 2020, Published Online: 08 November 2020
1. Introduction
By looking at the growing number of internet users in Indonesia[1], this has an impact on people’s behavior in Indonesia towards buying and selling interests [2]. Based on data [3], the number of smartphone users which continues to increase from time to time seems to be in line with the increasing number of online store users from websites and mobile apps. The average amount of Indonesian consumer spending when shopping online from all segments of the shopping category can reach US $ 36 (around Rp. 481 thousand). This value also makes Indonesia occupy the position of second size basketball in Southeast Asia, far behind that of developed countries in Singapore which reached US $ 91 or around Rp1.3 Million [4]. Based on the data and according to experts the development of e-marketplaces in Indonesia is very fast [1], including e-marketplaces owned by XYZ. In 2018 it was stated that five e-marketplace applications that were frequently downloaded consisted of five such marketplaces. Dominating the top ranking is XYZ’s e-marketplace. In this study we want increases customer online shopping transactions in the e-marketplaces owned by XYZ by knowing the indicators that influence satisfaction and loyalty can increase competition between the online selling industry so that companies can still compete with other companies.
2. Related Works
Service quality is the key to the success of a business [5], in addition to the quality of service that makes a key factor in the success of a business, loyalty also makes one a key factor in the success of a business [6].
In the previous study conduct by Tianxiang Sheng, the researcher testing e-service quality model from four dimensions, with the customers’ satisfaction as the main variable, the study has analyzed the effects of four dimensions of service quality on customers’ satisfaction and loyalty where all hypotheses are accepted. Other study by Akroush used SERVQUAL to analyze the effect of service quality on customer satisfaction and loyalty [7]. The result sho positive and significant influence of tangible, assurance, empathy, and reliability on consumer satisfaction, and customer satisfaction has a positive and significant effect on customer loyalty. customer satisfaction is the customer’s perspective based on expectations and then the shopping experience thereafter [8], other said customer satisfaction is everyone’s awareness that is differents. This feeling is obtained by comparing the expected service and the service obtained [9]. Customer loyalty can also be defined as the relationship that the customer maintains with the seller after making the first transaction [10].
The success and failure of online sales depends on how satisfied the customer[11], the relationship between satisfaction and loyalty is almost as intuitive[12]. In more recent research found satisfaction leads to loyalty[13], then knowing the indicators that influence satisfaction and loyalty can increase competition between the online selling industry[14]. By looking at these developments the author wants to conduct research with the e-service quality scale from Parasuraman’s E-S-QUAL[15] scale in terms of the basic service on user satisfaction on XYZ e-marketplace applications that have an impact on customer loyalty [16][17].
3. Research Methods
Research will be conducted by considering the following matters: questionnaire, online searching, and document Study[1]. We used quantitative research for data processing, quantitative research is systematic scientific research on parts and phenomena and their relationships. The purpose of quantitative research is to develop and use mathematical models, theories and hypotheses related to natural phenomena. We have distributing questionnaires that have been filled out by respondents through Google Form which will later be processed and analyzed, we distributed the questionaire with simple random sampling method[1].
This research uses E-SQUAL MODEL[2], where the statement contained in the questionnaire is a description of each variable such as, Efficiency[15], Requirement Fulfillment, Accessibility, Privacy[3] that influence Satisfaction [4] and Loyalty[5]. The following are research models we can use:
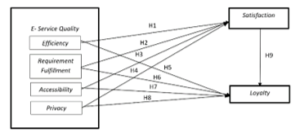
Figure 1: Research Model
Source: (T.Sheng, C.Liu [18])
Table 1: Demographic
Source: demographic from questionaire
| Variable | N | Percentange |
| Gender | ||
| Male | 38 | 37% |
| Female | 66 | 63% |
| Age | ||
| 11-15 years | 2 | 2% |
| 16-20 years | 20 | 19% |
| 21-25 years | 55 | 53% |
| 26-30 years | 11 | 11% |
| 31-35 years | 3 | 3% |
| >= 36 years | 13 | 13% |
| Domicile | ||
| DKI Jakarta | 25 | 24% |
| Banten | 61 | 59% |
| Jawa Barat | 11 | 11% |
| Jawa Tengah | 2 | 2% |
| Jawa Timur | 1 | 1% |
| Bali | 3 | 3% |
| NTB | 1 | 1% |
| Frequency Visit Online Marketplace | ||
| Once in a week | 78 | 75% |
| 2-3 times in a week | 26 | 25% |
3.1. Validity and Reliability Test
By using a valid and reliable instrument, the research results are expected to be valid and reliable as well. If the instrument is not tested for validity and reliability, then the data collected with the instrument is doubtful [19]. A valid instrument means that the instrument can be used to measure what should be measured and can display what must be displayed [19].
Table 2: Validity and Reliability Test Results
Source: Questionnaire Testing Results with SPSS
| Variable | Pernyataan | CI-TC | Cronbach’s Alpha |
| E-Service Quality | EF1 | 0.768 | 0.949 |
| EF2 | 0.697 | 0.950 | |
| EF3 | 0.558 | 0.951 | |
| RF1 | 0.696 | 0.950 | |
| RF2 | 0.549 | 0.951 | |
| RF3 | 0.557 | 0.951 | |
| AC1 | 0.649 | 0.950 | |
| AC2 | 0.682 | 0.950 | |
| P1 | 0.721 | 0.949 | |
| P2 | 0.575 | 0.951 | |
| Customer Loyalty | CL1 | 0.538 | 0.951 |
| CL2 | 0.372 | 0.953 | |
| CL3 | 0.679 | 0.950 | |
| Customer Loyalty | CL4 | 0.648 | 0.950 |
| CL5 | 0.638 | 0.950 | |
| CS1 | 0.760 | 0.949 | |
| CS2 | 0.623 | 0.950 | |
| CS3 | 0.737 | 0.949 | |
| Customer Satisfaction | CS4 | 0.584 | 0.951 |
| CS5 | 0.540 | 0.951 | |
| CS6 | 0.771 | 0.949 | |
| CS7 | 0.645 | 0.950 | |
| CS8 | 0.676 | 0.950 | |
| CS9 | 0.710 | 0.950 | |
| CS10 | 0.676 | 0.950 | |
| CS11 | 0.719 | 0.949 | |
| CS12 | 0.766 | 0.949 | |
| CS13 | 0.790 | 0.949 | |
| CS14 | 0.541 | 0.951 | |
| CS15 | 0.604 | 0.951 |
Based on the results of the validity and reliability test in Table 2, researchers omitted 2 respondents in the validity test using SPSS with 2 respondents coming from the Banten region because the number of respondents in the Banten area was quite large so the sample of respondents the researchers used became 102. Those pieces the statement proposed for this study has an r table of 0.195 with a significant level of 5%, while the CI-TC of all statements are judged to be greater than the r table. The Cronbach’s Alpha value of all statements is above 0.6. It can be concluded that all these statements are valid and reliable as research instruments.
3.2. Convergent Validity Testing
According to [20] convergent validity is the extent to which measures are positively correlated with alternative steps of the same construct. The size loader is said to be high if the value of the collection must be 0.708 or higher.
Table 3: Convergent Validity Testing Result
Source: Questionnaire Testing Results with SPSS
| Accessibility | Efficiency | Loyalty | Privacy | Requirement Fulfillment | Satisfaction | |
| AC1 | 0.867 | |||||
| AC2 | 0.900 | |||||
| CL1 | 0.635 | |||||
| CL2 | 0.582 | |||||
| CL3 | 0.828 | |||||
| CL4 | 0.813 | |||||
| CL5 | 0.817 | |||||
| CS1 | 0.797 | |||||
| CS10 | 0.696 | |||||
| CS11 | 0.723 | |||||
| CS12 | 0.787 | |||||
| CS13 | 0.814 | |||||
| CS14 | 0.557 | |||||
| CS15 | 0.614 | |||||
| CS2 | 0.709 | |||||
| CS3 | 0.775 | |||||
| CS4 | 0.580 | |||||
| CS5 | 0.538 | |||||
| CS6 | 0.782 | |||||
| CS7 | 0.667 | |||||
| CS8 | 0.683 | |||||
| CS9 | 0.736 | |||||
| EF1 | 0.868 | |||||
| EF2 | 0.905 | |||||
| EF3 | 0.673 | |||||
| P1 | 0.942 | |||||
| P2 | 0.904 | |||||
| RF1 | 0.893 | |||||
| RF2 | 0.788 | |||||
| RF3 | 0.751 |
From Table 2 it can be seen that there are ten indicators that have values less than 0.708, namely indicators CL1 (0.635), CL2 (0.582), CS10 (0.696), CS14 (0.557), CS15 (0.614), CS4 (0.580), CS5 (0.538), CS7 (0.667), CS8 (0.683), and EF3 (0.673).
All indicators above refer to opinions [20], each indicator with a value between 0.40 to 0.70 does not have to be deleted, except when deleted, the indicator can increase the value of composite reliability.
3.3. Testing Discriminant Validity
Discriminant Validity shows the extent to which a construct is completely different from other constructs. Discriminant Validity implies that the construct is unique and can capture events that are not represented by other constructs in the model[21]. Cross Loadings is the first approach to assess the validity of discriminant indicators. Specifically, the external load of the indicators on the related construct must be greater than the other constructs [20].
Table 4: Testing Discriminant Validity Result
Source: Questionnaire Testing Results with SPSS
| Accessibility | Efficiency | Loyalty | Privacy | Requirement Fulfillment | Satisfaction | |
| AC1 | 0.867 | 0.540 | 0.401 | 0.478 | 0.535 | 0.579 |
| AC2 | 0.900 | 0.646 | 0.551 | 0.451 | 0.521 | 0.585 |
| EF1 | 0.663 | 0.868 | 0.606 | 0.396 | 0.573 | 0.698 |
| EF2 | 0.537 | 0.905 | 0.599 | 0.373 | 0.534 | 0.610 |
| EF3 | 0.437 | 0.673 | 0.322 | 0.329 | 0.557 | 0.512 |
| CL1 | 0.388 | 0.383 | 0.635 | 0.353 | 0.257 | 0.479 |
| CL2 | 0.281 | 0.275 | 0.582 | 0.128 | 0.131 | 0.304 |
| CL3 | 0.515 | 0.552 | 0.828 | 0.467 | 0.409 | 0.610 |
| CL4 | 0.392 | 0.568 | 0.813 | 0.377 | 0.525 | 0.571 |
| CL5 | 0.411 | 0.523 | 0.817 | 0.353 | 0.406 | 0.586 |
| P1 | 0.517 | 0.442 | 0.482 | 0.942 | 0.451 | 0.724 |
| P2 | 0.444 | 0.375 | 0.383 | 0.904 | 0.315 | 0.566 |
| RF1 | 0.542 | 0.621 | 0.500 | 0.362 | 0.893 | 0.634 |
| RF2 | 0.485 | 0.523 | 0.386 | 0.262 | 0.788 | 0.462 |
| RF3 | 0.419 | 0.469 | 0.285 | 0.415 | 0.751 | 0.493 |
| CS1 | 0.487 | 0.514 | 0.630 | 0.560 | 0.498 | 0.797 |
| CS10 | 0.410 | 0.544 | 0.482 | 0.473 | 0.414 | 0.696 |
| CS11 | 0.455 | 0.557 | 0.610 | 0.599 | 0.489 | 0.723 |
| CS12 | 0.546 | 0.619 | 0.571 | 0.612 | 0.494 | 0.787 |
| CS13 | 0.572 | 0.626 | 0.575 | 0.593 | 0.541 | 0.814 |
| CS14 | 0.323 | 0.418 | 0.327 | 0.283 | 0.378 | 0.557 |
| CS15 | 0.395 | 0.565 | 0.488 | 0.316 | 0.353 | 0.614 |
| CS2 | 0.357 | 0.376 | 0.427 | 0.445 | 0.364 | 0.709 |
| CS3 | 0.438 | 0.554 | 0.617 | 0.533 | 0.510 | 0.775 |
| CS4 | 0.446 | 0.512 | 0.379 | 0.336 | 0.459 | 0.580 |
| CS5 | 0.408 | 0.402 | 0.467 | 0.169 | 0.268 | 0.538 |
| CS6 | 0.648 | 0.542 | 0.480 | 0.653 | 0.597 | 0.782 |
| CS7 | 0.489 | 0.518 | 0.348 | 0.550 | 0.549 | 0.667 |
| CS8 | 0.477 | 0.556 | 0.406 | 0.511 | 0.409 | 0.683 |
| CS9 | 0.424 | 0.495 | 0.524 | 0.603 | 0.544 | 0.736 |
3.4. Testing the value of AVE (Average Variance Extracted)
The next convergent validity test is to test the average variance extracted (AVE) value of each variable.the value of AVE 0.50 or higher shows that, on average, constructs explain more than half of the indicator variants[20]. Conversely, if AVE is less than 0.50, it shows that, on average, there are variant items that are explained by the construct.
Table 5: Average Variance Extracted
Source: Questionnaire Testing Results with SPSS
| Construct | Average Variance Extracted (AVE) |
| Accessibility | 0.781 |
| Efficiency | 0.675 |
| Loyalty | 0.551 |
| Privacy | 0.852 |
| Requirement Fulfillment | 0.661 |
| Satisfaction | 0.494 |
It can be seen in Table 5 that there is an average variance extracted (AVE) value on the customer satisfaction variable which has AVE value of 0.494. The author re-observes in Table 3 to find the outer loading value of customer satisfaction is low. In Table 3 there is a low outer loading value that belongs to customer satisfaction, that is, CS5 with a value of 0.538 and the writer deletes the CS5 indicator to increase the AVE value of customer satisfaction[21].
Table 6: Average Variance Extracted (after)
Source: Questionnaire Testing Results with SPSS
| Constructs | Average Variance Extracted (AVE) |
| Accessibility | 0.781 |
| Efficiency | 0.675 |
| Loyalty | 0.551 |
| Privacy | 0.852 |
| Requirement Fulfillment | 0.661 |
| Satisfaction | 0.510 |
Table 7: Cronbach’s Alpha
Source: Questionnaire Testing Results with SPSS
| Constructs | Cronbach’s Alpha |
| Accessibility | 0.721 |
| Efficiency | 0.756 |
| Loyalty | 0.793 |
| Privacy | 0.829 |
| Requirement Fulfillment | 0.744 |
| Satisfaction | 0.924 |
Table 8: Composite Reliability
Source: Questionnaire Testing Results with SPSS
| Constructs | Composite Reliability |
| Accessibility | 0.877 |
| Efficiency | 0.860 |
| Loyalty | 0.857 |
| Privacy | 0.920 |
| Requirement Fulfillment | 0.853 |
| Satisfaction | 0.935 |
After the researchers removed the CS5 indicator, it can be seen in Table 6 that AVE value owned by customer satisfaction increased from 0.494 to 0.510.
Table 9: Hypothesis Test Result
Source: Questionnaire Testing Results with SPSS
| Hypothesis | Path | Original Sample | T-Statistic | Conclusion |
| H1 | EF→CS | 0.385 | 4.664 | Significant |
| H2 | RF→CS | 0.193 | 2.323 | Significant |
| H3 | AC→CS | 0.046 | 0.541 | Less significant |
| H4 | P→CS | 0.444 | 5.954 | Significant |
| H5 | EF→CL | 0.245 | 1.723 | Less significant |
| H6 | RF→CL | -0.056 | 0.446 | Less significant |
| H7 | AC→CL | 0.091 | 0.754 | Less significant |
| H8 | P→CL | -0.034 | 0.263 | Less significant |
| H9 | CS→CL | 0.519 | 3.029 | Significant |
After the researchers removed the CS5 indicator, it can be seen in Table 8 that AVE value owned by customer satisfaction increased from 0.494 to 0.510.
The following conclusions are obtained from the results of testing the hypothesis of the research model based on Table 9:
- Hypothesis 1, Efficiency Factor (EF) has a significant positiveeffect on Customer Satisfaction (CS). That is because the value of the path coefficient and T-statistics are at a minimum, namely 0.384 and 4.664.
- Hypothesis 2, Requirement Fulfillment (RF) factors have a significant positive effect on Customer Satisfaction (CS). That is because the value of the path coefficient and T-statistics are at a minimum, namely 0.193 and 2.323.
- Hypothesis 3, The Accessibility (AC) factor is less influential on Customer Satisfaction (CS). That is because the path coefficient and T-statistics are below the minimum values, namely 0.046 and 0.541.
- Hypothesis 4, Privacy factor (P) has a significant positive effect on Customer Satisfaction (CS), which is due to the value of the path coefficient and T-statistics are at a minimum value, namely 0.444 and 5.954.
- Hypothesis 5, Customer Loyalty (CL) Efficiency Factor (EF). That is because the path coefficient and T-statistics are at a minimum value, 1,723.
- Hypothesis 6, The Requirement Fulfillment (RF) factor is less significant to Customer Loyalty because the value of T-statistics is at a minimal value of 0.446.
- Hypothesis 7, The Accessibility (AC) factor is less significant to Customer Loyalty (CL) because the value of T-statistics is at a minimum value of 0.754.
- Hypothesis 8, Privacy Factor (P) Less significant to Customer Loyalty (CL) because the T-statistic value is at a minimum value of 0.263.
- Hypothesis 9, The Customer Satisfaction (CS) factor is significantly positive towards Customer Loyalty (CL) because the T-statistics value is 3.029.

Figure 2: Results of Partial Research Model
Source: (author analysis)
In Figure 2, the relationship between variables based on the hypothesis received and has been proven to have a significant effect. The following discussion of the results of hypothesis testing.
4. Results
Based on the results of data processing related to the influence of e-service quality on customer satisfaction and customer loyalty in the XYZ e-marketplace, it can be concluded as follows:
- There are 10 indicators namely customer satisfaction (CS4, CS5, CS7, CS8, CS14, CS15), efficiency (EF3), and customer loyalty (CL1, CL2) that do not meet the criteria because the value is less than 0.7 but of the 10 indicators only customer satisfaction (CS5) is omitted due to the low outer loading value that is 0.538 so that the AVE of customer satisfaction shows below 0.5. Therefore, researchers conducted outer loading testing again by removing the indicator on customer satisfaction (CS5) after the researchers re-tested the outer loading, the AVE value indicates that all indicators have reached values above 0.5 and met the required requirements.
- The factors that influence this research on customer satisfaction are efficiency, privacy, and fulfillment requirements. But other variables such as accessibility have less effect on customer satisfaction. While the factors that influence customer, loyalty are only customer satisfaction. But other variables such as accessibility, efficiency, privacy, and fulfillment requirements have less effect on customer loyalty
- There is a positive and significant effect on the efficiency, privacy, and customer satisfaction variables on customer loyalty variables with each value above 1.96
- In measuring the significant level of relationship between variables it can be concluded that the accessibility variable has no significant effect on customer satisfaction. This has been proven by the results of the measurement of accessibility variable has a value of 0.541 <1.96, then so does the variable efficiency, requirements fulfillment, accessibility, and privacy has an insignificant effect on customer loyalty with each value below 1.96, which means not significant.
5. Discussion
E-Service Quality in the XYZ e-marketplace must be re-considered and must be improved again both in terms of the services provided to customers. The results of the study, e-service quality that has been done in the Accessibility section is something that must be considered again because of the low level of customer satisfaction in the given accessibility. On other hand e-service quality does not directly affect customer loyalty due to achieving a customer loyalty, the customer must feel satisfied first so that the customer can be loyal and shop again at the XYZ e-marketplace. The last service quality has a good impact on customer satisfaction, this is because when customers shop using the XYZ e-marketplace application the services provided by XYZ already meet customer needs but there is one indicator that is accessibility that is not achieve customer satisfaction.
6. Future Work
From the results of our research, researchers suggest:
- In the future work the study should compare to another marketplace.
- Due to the many insignificant hypotheses (5 of 9) it is recommended that future research use other variables to achieve much better research results.
- Try to use other models such as UTAUT or TAM to do research about the impact of e-service quality on customer satisfaction and customer loyalty.
- Adding the number of samples due to the small number of samples then it causes the results of testing the research hypothesis is not satisfactory, so it is advisable to increase the number of samples in future research.
- O. Yusuf, Pengguna Internet Indonesia Nomor Enam Dunia, 1–2, 2014.
- H.K. Soemartono, Survei APJII: Penetrasi Internet di Indonesia Capai 143 Juta Jiwa, Buletin Asosiasi Penyelenggara Jasa Internet Indonesia, Edisi-22 2, 3, 2018.
- R. Maulana, T. Perilaku Konsumen Belanja Online Indonesia Tahun 2018 Menurut iPrice, https://id.techinasia.com/tren-perilaku-konsumen-o, 2018.
- Peta E Commerce Indonesia, 1, 2020. [Accessed: 10-Jun-2020].
- C.P. Anh, “Factors Influence Customer Satisfaction In Mobile Commerce”, 6–52, http://urn.fi/URN:NBN:fi:amk-2015121621158, 2015.
- R.Q. Danish, A.A. Himayon, H.J. Iqbal, S. Raza, J. Shahid, “The Impact of Service Quality, Customer Satisfaction and Loyalty Programs on Customer’s Loyalty: An Evidence from Telecommunication Sector,” European Online Journal of Natural and Social Sciences, 7(1), 40–47, 2018.
- Q. Chen, S. Rodgers, Y. He, “A Critical Review of the E-Satisfaction Literature,” American Behavioral Scientist – AMER BEHAV SCI, 52, 38–59, 2008, doi:10.1177/0002764208321340.
- J. Cronin. Jr, S. Taylor, “Measuring Service Quality – A Reexamination And Extension,” The Journal of Marketing, 56, 55–68, 1992, doi:10.2307/1252296.
- R.L. Oliver, “Whence consumer loyalty?,” Journal of Marketing, 63(SUPPL.), 33–44, 1999, doi:10.2307/1252099.
- M.N. Khuong, N.Q. Dai, “The Factors Affecting Customer Satisfaction and Customer Loyalty — A Study of Local Taxi Companies in Ho Chi Minh City, Vietnam,” International Journal of Innovation, Management and Technology, 7(5), 228–233, 2016, doi:10.18178/ijimt.2016.7.5.678.
- T.O. Jones, “Why Satisfied Customers Defect,”, https://hbr.org/1995/11/why-satisfied-customers-defect, 1995. [Accessed: 10-Jun-2020].
- V. Zeithaml, A.P. Parasuraman, A. Malhotra, “A Conceptual Framework for Understanding E-Service Quality: Implications for Future Research and Managerial Practice,” Marketing Science Institute Working Paper Report No, 2000.
- K. Laosethakul, W. Boulton, “Critical Success Factors for E-commerce in Thailand: Cultural and Infrastructural Influences,” EJISDC The Electronic Journal on Information Systems in Developing Countries, 30, 1–22, 2007, doi:10.1002/j.1681-4835.2007.tb00205.x.
- M. Akroush, S.D. Ali, I. Affara, “Service quality, customer satisfaction and loyalty in the Yemeni mobile service market,” International Journal of Services, Economics and Management, 7, 53, 2015, doi:10.1504/IJSEM.2015.076323.
- A. Parasuraman, V.A. Zeithaml, A. Malhotra, “E-S-QUAL a multiple-item scale for assessing electronic service quality,” Journal of Service Research, 7(3), 213–233, 2005, doi:10.1177/1094670504271156.
- M.N. Khuong, N.Q. Dai, “The Factors Affecting Customer Satisfaction and Customer Loyalty — A Study of Local Taxi Companies in Ho Chi Minh City, Vietnam,” International Journal of Innovation, Management and Technology, 7(5), 228–233, 2016, doi:10.18178/ijimt.2016.7.5.678.
- B. Ranjbarian, S. Fathi, Z. Rezaei, “Factors Influencing on Customers’ E-Satisfaction: A case Study from Iran,” Interdisciplinary Journal of Contemporary Research in Business, 3(9), 1496–1511, 2012.
- T. Sheng, C. Liu, “An empirical study on the effect of e-service quality on online customer satisfaction and loyalty,” Nankai Business Review International, 1(3), 273–283, 2010, doi:10.1108/20408741011069205
- Sugiyono, “Metode Penelitian Kuantitatif Kualitatif dan R&D,” 2011.
- A. Leguina, “A primer on partial least squares structural equation modeling (PLS-SEM)”, International Journal of Research & Method in Education, 38:2, 220-221, 2015, doi:10.1080/1743727X.2015.1005806
- A. Özer, M.T. Argan, M. Argan, “The Effect of Mobile Service Quality Dimensions on Customer Satisfaction,” Procedia – Social and Behavioral Sciences, 99, 428–438, 2013, doi:10.1016/j.sbspro.2013.10.511.