
Real-Time Identification and Classification of Driving Maneuvers using Smartphone
Volume 5, Issue 6, Page No 193-205, 2020
Author’s Name: Munaf Salim Najim Al-Dina)
View Affiliations
College of Engineering and Architecture, Electrical and Computer Engineering, University of Nizwa, Nizwa, 616, Oman
a)Author to whom correspondence should be addressed. E-mail: munaf@unizwa.edu.om
Adv. Sci. Technol. Eng. Syst. J. 5(6), 193-205 (2020); ![]() DOI: 10.25046/aj050623
DOI: 10.25046/aj050623
Keywords: Driving behavior, Identification and classification, Smartphones

Export Citations
The fast-paced development of smart technologies and the prevalence of vehicles, created an urgent demands to study and improve safety issues related to driving. In order to reduce traffic accidents, driving behavior was found to be very important issues to study and investigate. Recently, the advent and widespread of smartphone platforms with advanced computing competence and embedment of a variety sensing elements have greatly contributed to the development of solutions that can detect, and evaluate driving behavior and skills. In this study the development of a real-time smartphone-based identification and classification system for highway driving maneuvers is presented. The proposed system has been designed to detect ten different maneuvers usually performed by drivers when driving on highways. The methodology is based on separating the identification and the classification processes. The identification process is performed by a hybrid pattern matching scheme that combines Dynamic Time Warping (DTW) and neural networks. While a second neural network has been used to classify maneuvers, severity based statistical and time features. The separation of the identification and classification processes simplifies and accelerates the learning processes of the neural networks and greatly improves both system’s reliability and accuracy
Received: 18 August 2020, Accepted: 01 November 2020, Published Online: 08 November 2020
- S.C. Davis and Robert G. Boundy, Transportation Energy Data Book, Ed. 38, Oak Ridge National Lab TN-United States, 2020.
- D. Searsona , G. Pontea , T Paul Hutchinsona , Robert Andersona and Mary Lydona, “Emerging vehicle safety technologies and their potential benefits: Discussion of expert opinions” in 2015 1st Australasian Road Safety Conference (ARSC2015), 1-11, 2015,
- World Health Organization: “Global status report on road safety 2018”, WHO: Geneva, Switzerland, 2018.
- A. Haghi, D. Ketabi, M. Ghanbari and H. Rajabi, “Assessment of Human Errors in Driving Accidents; Analysis of the Causes Based on Aberrant Behaviors”, Life Science Journal, 11( 9), 414-420, 2014.
- M.Q. Khan and Sukhan Lee, “A Comprehensive Survey of Driving Monitoring and Assistance Systems”, Sensors 19(11), 2574-2606 ,2019, doi: 10.3390/s19112574
- C.M. Martinez ; M. Heucke ; Fei:Yue Wang ; Bo Gao ; Dongpu Cao, “Driving Style Recognition for Intelligent Vehicle Control and Advanced Driver Assistance: A Survey”, IEEE Transactions on Intelligent Transportation Systemsm 19 (3) , 666–676, 2018, doi: 10.1109/TITS.2017.2706978.
- M. VivaldiniI; Silvio R. I. PiresI; Fernando Bernardi de SouzaII, “Improving logistics services through the technology used in fleet management”, Journal of Information Systems and Technology Management, 9(3), 541-562, 2012, doi: 10.4301/S1807-17752012000300006
- M.J. Prasad, S Arundathi, Nayana Anil, Harshikha, B. S. Kariyappa, “Automobile black box system for accident analysis”, in 2014 International Conference on Advances in Electronics Computers and Communications (ICAECC), 1-5, 2014, doi: 10.1109/ICAECC.2014.7002430.
- T.K. Chan ; Cheng Siong Chin ; Hao Chen ; Xionghu Zhong, “A Comprehensive Review of Driver Behavior Analysis Utilizing Smartphones” IEEE Transactions on Intelligent Transportation Systems, 21(10), 4444 – 4475, 2020, doi: 10.1109/TITS.2019.2940481.
- M. S. N. Al-Din, “Highway Driving Events Identification and Classification using Smartphone,” in the 2018 International Conference on Circuits and Systems in Digital Enterprise Technology (ICCSDET), 1-6, 2018, doi: 10.1109/ICCSDET.2018.8821090.
- R. Kridalukmana, H. Y. Lu and M. Naderpour, “An object oriented Bayesian network approach for unsafe driving maneuvers prevention system”, in the 2017 12th International Conference on Intelligent Systems and Knowledge Engineering (ISKE), 1-6, 2017, doi: 10.1109/ISKE.2017.8258758.
- I. Silva and JoséEugenio Naranjo, “A Systematic Methodology to Evaluate Prediction Models for Driving Style Classification”, Sensors, 20(6), 1692-1713, 2020, doi: /10.3390/s20061692
- H. Malik, G. S. Larue, A. Rakotonirainy and F. Maire, “Fuzzy Logic to Evaluate Driving Maneuvers: An Integrated Approach to Improve Training,” IEEE Transactions on Intelligent Transportation Systems, 16(4), 1728-1735, 2015, doi: 10.1109/TITS.2014.2371061.
- T. K. Chan, C. S. Chin, H. Chen and X. Zhong, “A Comprehensive Review of Driver Behavior Analysis Utilizing Smartphones,” IEEE Transactions on Intelligent Transportation Systems, 21(10). 1-32, 2019, doi: 10.1109/TITS.2019.2940481.
- N. AbuAli, “Advanced vehicular sensing of road artifacts and driver behavior,” in the 2015 IEEE Symposium on Computers and Communication (ISCC), 45-49, 2015, doi: 10.1109/ISCC.2015.7405452.
- L. M. Bergasa, D. Almería, J. Almazán, J. J. Yebes and R. Arroyo, “DriveSafe: An app for alerting inattentive drivers and scoring driving behaviors,” in the 2014 IEEE Intelligent Vehicles Symposium Proceedings, 240-245, 2014, pp. doi: 10.1109/IVS.2014.6856461.
- M. Fazeen, B. Gozick, R. Dantu, M. Bhukhiya and M. C. González, “Safe Driving Using Mobile Phones,” IEEE Transactions on Intelligent Transportation Systems, 13(3), 1462-1468, 2012, pp. 1462:1468, doi: 10.1109/TITS.2012.2187640.
- Yang Zheng, A. Sathyanarayana and J. H. L. Hansen, “Threshold based decision-tree for automatic driving maneuver recognition using CAN-Bus signal,” in the 2014 17th International IEEE Conference on Intelligent Transportation Systems (ITSC), 834-2839, 2014, doi: 10.1109/ITSC.2014.6958144.
- T. Pholprasit, W. Choochaiwattana and C. Saiprasert, “A comparison of driving behaviour prediction algorithm using multi-sensory data on a smartphone,” in the 2015 IEEE/ACIS 16th International Conference on Software Engineering, Artificial Intelligence, Networking and Parallel/Distributed Computing (SNPD), 1-6, 2015, doi: 10.1109/SNPD.2015.7176249.
- H.R. Eftekhari and Mehdi Ghatee, “Hybrid of discrete wavelet transform and adaptive neuro fuzzy inference system for overall driving behavior recognition”, Transportation Research Part F, 58, 782-796, doi: 10.1016/j.trf.2018.06.044.
- H.R. Eftekhari, M. Ghatee,: “A similarity:based neuro:fuzzy modelling for driving behavior recognition applying fusion of smartphone sensors”, Journal of Intelligent Transportation Systems, 23(1), 72-83, 2019, doi: 10.1080/15472450.2018.1506338.
- C. Arroyo, L. M. Bergasa and E. Romera, “Adaptive fuzzy classifier to detect driving events from the inertial sensors of a smartphone,” in the 2016 IEEE 19th International Conference on Intelligent Transportation Systems (ITSC), 1896-1901, 2016, doi: 10.1109/ITSC.2016.7795863.
- A. Aljaafreh, N. Alshabatat and M. S. Najim Al:Din, “Driving style recognition using fuzzy logic,” in the 2012 IEEE International Conference on Vehicular Electronics and Safety (ICVES 2012), 460-463l, 2012, doi: 10.1109/ITSC.2014.6957822.
- M. Najim, Ahmad Aljaafreh, Nashat Albdour and Maen Saleh:, “Driving Styles Recognition Using Decomposed Fuzzy Logic System”, International Journal of Electrical, Electronics and Computer Systems, 16(1) 820-824, 2013.
- D.A. Johnson and M. M. Trivedi, “Driving style recognition using a smartphone as a sensor platform,” in the 2011 14th International IEEE Conference on Intelligent Transportation Systems (ITSC), 1609-1615, 2011, doi: 10.1109/ITSC.2011.6083078.
- C. Saiprasert, Pholprasit, T. and Thajchayapong, S., “Detection of Driving Events using Sensory Data on Smartphone”, International Journal of Intelligent Transportation Systems Research, 15(1), 17-28, 2015, doi:10.1007/s13177-015-0116-5.
- G. Singh, D. Bansal and Sanjeev Sofat, “A smartphone based technique to monitor driving behavior using DTW and crowdsensing”, Pervasive and Mobile Computing, 40, 56-70, 2017, doi: 10.1016/j.pmcj.2017.06.003.
- P. Tkachenko, J. Zhou, Davide Gagliardi and Luigidel Re, “On:line Maneuver Identification in Highway Traffic Using Elastic Template Matching”, IFAC:PapersOnLine, 51(15), 557-562, 2018, doi: 10.1016/j.ifacol.2018.09.214.
- M. Wu; Zhang, S.; Dong, Y., “A Novel Model-Based Driving Behavior Recognition System Using Motion Sensors”, Sensors, 16(10), 1746-1769, 2016, doi: 10.3390/s16101746.
- C. Chen, 1 Xiaohua Zhao, “Driver’s Eco-Driving Behavior Evaluation Modeling Based on Driving Events”, Journal of Advanced Transportation, 2018, 1-12, 2018, doi: 10.1155/2018/9530470.
- J. Yu, Z. Chen, Y. Zhu, Y. Chen, L. Kong and M. Li, “Fine-Grained Abnormal Driving Behaviors Detection and Identification with Smartphones,” IEEE Transactions on Mobile Computing, 16(8), 2198-2212, 2017, doi: 10.1109/TMC.2016.2618873.
- J. F. J´unior, E. Carvalho, B. V. Ferreira, C. de Souza, Y. Suhara, A. Pentland, and G. Pessin, “Driver behavior profiling: An investigation with different smartphone sensors and machine learning,” PLoS one, 12(4), e0174959, 2017. doi:10.1371/journal.pone.0174959
- P. Brombacher, J. Masino, M. Frey and F. Gauterin, “Driving event detection and driving style classification using artificial neural networks,” in the 2017 IEEE International Conference on Industrial Technology (ICIT), 997-1002, 2017, doi:10.1109/ICIT.2017.7915497..
- U. Fugiglando et al., “Driving Behavior Analysis through CAN Bus Data in an Uncontrolled Environment,” IEEE Transactions on Intelligent Transportation Systems, 20(2), 737-748, 2019, doi: 10.1109/TITS.2018.2836308.
- Manon Kok, Jeroen D. Hol and Thomas B. Schon, “Using Inertial Sensors for Position and Orientation Estimation”, Foundations and Trends in Signal Processing: 11(1-2), 1-153, 2017, doi:10.1561/2000000094.
- I. Aicardi , P. Dabove , A. Lingua and M. Piras, “Sensors Integration for Smartphone Navigation: Performance and Future Challenges”, The International Archives of the Photogrammetry, Remote Sensing and Spatial Information Sciences, XL(3), 9-16, 2014 .
- I. P. Prikhodko, B. Bearss, C. Merritt, J. Bergeron and C. Blackmer, “Towards self-navigating cars using MEMS IMU: Challenges and opportunities,” in the 2018 IEEE International Symposium on Inertial Sensors and Systems (INERTIAL), 1-4, 2018, doi:10.1109/ISISS.2018.8358141.
- J. Almazán, L. M. Bergasa, J. J. Yebes, R. Barea and R. Arroyo, “Full auto:calibration of a smartphone on board a vehicle using IMU and GPS embedded sensors,” in the 2013 IEEE Intelligent Vehicles Symposium (IV), 1374-1380, 2013, doi: 10.1109/IVS.2013.6629658.
- M. S. Najim Al:Din, “Calibration and Pre-Processing Techniques for a Smartphone:Based Driving Events Identification and Classification System,” in the 2018 IEEE Electron Devices Kolkata Conference (EDKCON), 396-402, 2018, doi: 10.1109/EDKCON.2018.8770487.
- Munaf Salim Najim Al:Din; Atef Saleh Al:Mashakbeh, “Development of a highway driving events identification and classification using smartphone”, International Journal of Nanoparticles, 12(1-2), 152-173, 2020, doi;10.1504/IJNP.2020.106006
- T. Pan, C. Kuo and M. Hu, “A noise reduction method for IMU and its application on handwriting trajectory reconstruction,” in the 2016 IEEE International Conference on Multimedia & Expo Workshops (ICMEW), 1-6, 2016, doi: 10.1109/ICMEW.2016.7574685.
- M. Wu, S. Zhang and Y. Dong, “A novel model:based driving behavior recognition system using motion sensors”, Sensors, 16(10), 1746-1769, 2016, doi: 10.3390/s16101746
- Wendy L. Martinez and Angel R. Martinez, “Exploratory Data Analysis with MATLAB”, Chapman & Hall/CRC Press, 2005.
- F Bruwer and M Booysen, “Vehicle Acceleration Estimation using Smartphone:Based Sensors”, in the 2015 34th Annual Southern African Transport Conference (SATC 2015), 118-129, 2015, doi: 10.13140/RG.2.1.3244.4640 .
- Y. Huang, Y. Rizal and M. Ho, “Development of attitude and heading reference systems,” in the 2015 International Automatic Control Conference (CACS), 13-18, 2015, doi: 10.1109/CACS.2015.7378358.
- T. Lei, A. A. Mohamed, and C. Claudel, “An imu-based traffic and road condition monitoring system,” HardwareX, 4, e00045, 2018, doi: 10.1016/j.ohx.2018.e00045
- Xu Dawei,Wu Bian, Zhao Jianwei et al., “A real time algorithm for voice activity detection in noisy environment”, Computer Engineering and Application, 24(1), 115-117, 2003.
- Liang-Sheng Huang and Chung-Ho Yang, “A novel approach to robust speech endpoint detection in car environments,” in the 2000 IEEE International Conference on Acoustics, Speech, and Signal Processing. Proceedings 1751-1754, 2000, doi: 10.1109/ICASSP.2000.862091.
- B. Johnen and B. Kuhlenkoetter, “A Dynamic Time Warping algorithm for industrial robot motion analysis,” in the 2016 Annual Conference on Information Science and Systems (CISS), 18-23, 2016, doi: 10.1109/CISS.2016.7460470.
- F. Petitjean, J. Inglada, and P. Gancarski, “A global averaging method for dynamic time warping, with applications to clustering,” Pattern Recogn., 44(3), 678–693, 2011, doi: 10.1016/j.patcog.2010.09.013.
1. Introduction
During the last century vehicles have prevailed all over the world and have greatly contributed to the development and prosperity of the world economy. According to [1], the number of registered vehicles in the world has increased from 1.015 billion in 2010 to nearly 1.5 billion in 2020. In spite of all their positive impacts, vehicles have negative consequences on environmental pollution, global warming and greenhouse gas emissions, congested roads and noises, fuel consumption, social impacts, road accidents and many others to list. These negative consequences have stringent the environmental and safety regulations and standards for automotive industry. Therefore, to be in compliance with the regulations and standards, innovative solutions and newly emerging technologies have been adopted and utilized to provide the utmost advanced, efficient, safest and comfortable transportation means. In these days, high-end vehicles are equipped with smart systems such as cruise control, advanced emergency braking, safety warning systems, GPS technology for navigation, fuel efficiency, and automated driving system. Furthermore, in the near future, the automotive industry is expected to evolve even further by the production of autonomous vehicles that operate in a fully connected and digitized environment. Such immense leap in transportation technologies is only made possible by intensive studies in the field of vehicular applications especially the studies of driving behaviors.
Although that advanced technologies such as smart safety systems have been integrated within modern, still fully human driven vehicles is and will continue to dominate traffic safety since almost all of vehicles in use at the present time are of conventional type. Conventional vehicles are those fully driven and controlled by human drivers, and have few or none of the new technologies and accessories. The impediment in utilizing the new technologies is due to prohibitive cost that cannot be afforded by most of vehicles’ owners especially in developing countries in addition to insulation difficulties [2]. Based on this argument, safety and road accidents due to human errors are still urgent issues that need to be addressed and solved for the majority of conventional vehicles. Based on the World Health Organization reports, vehicle accidents are considered to be the ninth cause of death in the world in addition they are a leading cause of fatal injuries [3]. Previous road safety studies and statistics have showed that the majority of road accidents are attributed to both physiological and behavioral human factors [4]. Therefore, research in the field of driving behavior monitoring systems has gained great momentum and several research institutes have developed systems to monitor and analyze the driving patterns and activities. Beside their urgent importance these studies serve the research and developments of different applications such as the design of advanced driver assistance system, intelligent transportation systems, and autonomous vehicles [5-6]. Additionally, they helped logistics companies to reduce their operational costs through tracking and monitoring their vehicles [7], and insurance companies to evaluate the driver performance, usage and can be used to resolve insurance tariffs and disputes [8].
The study and analysis of the concepts related to driving processes and problems involve the utilization of Driving Monitoring and Assistance System (DMAS). DMASs are usually designed to at least provide two main tasks, data acquisition and driving maneuvers analysis. The first unit is responsible for automating the collection of driving data, such as driver’s attentiveness, vehicle dynamic state, driver’s actions and driving environment or surrounding. The second unit is designed to extract patterns and features from the driving data and then utilizes intelligent computational techniques to identify and classify the driving behavior. In general real-time acquisition of driving patterns and parameters can be achieved through various types of sensors, such as GPS, GNSSs, In-Vehicle sensors such as CAN-BUS signals, costumed designed systems, vision systems and smartphones. Among this range of sensing platforms smartphone-based DMAS have growing so rapidly in number and sophistication, due to the prevalence, continuous improvement of the computing power, advancement of integrated sensors and continuous reduction cost in smartphones. Therefore, smartphones are taking an important role in the field of Intelligent Transport Systems such as vehicle monitoring driver behavior analysis [9].
This paper is an extended version of the work published in [10] and it is intended to presents the development of a real-time smartphone-based highway driving maneuvers identification and classification system. The system consists of three layers namely, data acquisition layer, preprocessing layer and the identification and classification layer. It is well known that the estimation driving parameters with high degree of accurately greatly affects the detection and classification of driving maneuvers. Therefore, in this paper a new approach to estimate the speed of a moving vehicle derived from GPS and the IMUs is developed. The identification and classification layer consists of three main units, a pattern matching units, to identify the patterns of estimated driving parameters. The DTW technique is used to identify the pattern of each driving parameter during maneuver execution. The second unit consists of a single feed-forward neural network that will identify the type of the maneuver based on the combination of the identified patterns from the first unit. Finally the third unit is responsible for the manoeuver classification and it is performed by a second neural network.
2. Literature Review
In the past decade several techniques and methodologies have been proposed and used to recognize and classify driving maneuvers and then infer an evaluation for driving behavior. Up to date there is no agreement on the parameters and techniques that could uniquely be used for this purpose. This section presents a short review of the existing technologies and methodologies used for driving maneuvers identification and classification. The literature review illustrates only two major issues related to this field of research namely, the data collection and identification and classification techniques.
Depending on the purpose and functionalities that is required to be achieved, there are various types of data acquisition systems (DAS) developed in the past ten years. The first category of DAS relies on the in-vehicle sensors which broadcast their data through the CAN-BUS which can be captured through the OBD II port. These systems can only provide information that can be used to monitor vehicle’ state such as speed, fuel consumption and engine RPM and some limited information related to the driver actions such as throttle pedals positions [11, 12]. Many research centers have developed customized monitoring systems that combine in-vehicle sensors with GPS unit, inertial measurement units, and video systems of the external road and traffic environment and inside the vehicle itself [13]. In general sensors are configured to perceive external and internal environments to provide contextual details about the driving and drivers states. The drawbacks of the simple plug and play monitoring systems are the limited data that can be extracted with. On the other hand, drawbacks of in-vehicle customized systems are their high cost, installation complexity, compatibility and customer acceptance [5]. The developments of smartphones in terms of computational power and integration of sensing devices such as Inertial Measurement Units (IMUs), GPS and many other sensors combined with their ubiquitous presence have led to wide prevalence of smartphones in vehicular applications. Nevertheless, there are shortcomings when employing smartphones as monitoring systems such noisy measurement, coordinates orientation due smartphone placement, battery life and they cannot access vehicles data by their own. Several techniques, as they will be explained later, have been developed to provide the required remedies to overcome these problems [14]. Smartphones have also been utilizes as an intermediate processing hub with the aid of special applications to collect vehicle’s sensors data and perform the necessary computation. In general, these applications enable the smartphone to communicate with the OBD-II port, either through Bluetooth or WiFi, and to collect a number of vehicle’s sensors data such as the speed, engine RPM and many other diagnosis parameters. The processing of these in-vehicle sensors’ data streams can be combined with smartphone sensors to further enrich the analysis [15].
Based on the collected data or the estimated driving parameters and the maneuvers to be detected, different techniques have been suggested to identify the type of a maneuver and classify it. A straightforward approach used to process the driving data is based on specifying a number of thresholds for each maneuver, that are defined merely based on the range of collected driving data and the experience. Once the sensed signals exceed a predefined threshold for a specified period of time then a maneuver is detected [16-19]. The main disadvantage in using threshold-based approaches is related to the absence of both the sensitivity and specificity that are required to obtain accurate identification and classification since improper definition of thresholds can result in poor performance. In a different approach, researchers considered the vehicle driving as a reasoning process, hence rule-base and fuzzy logic systems have been used to model driving behavior in terms of driving maneuvers classification only, i.e. it is not possible to detect the type of the maneuver by using fuzzy logic schemas [13,20-24]. The implementation of a classical fuzzy logic classifier depends on the definition and setting of fuzzy input variables, the rule-based inference system and the fuzzification and defuzzification processes. Therefore, fuzzy logic classifiers are not constantly precise, since the both the fuzzy rules and conclusions are based on postulation, so it may not be widely accepted. Furthermore, they don’t have the capability of machine learning and the setting of the precise inference rules and, membership functions is a difficult task. To overcome the aforementioned limitations in both threshold-based and fuzzy logic classifiers several adaptive methods have been proposed to automatically generate thresholds and fuzzy rules from numerical data [20-24]. Adaptive systems have showed distinctive superiority over classical fuzzy systems due to their learning capabilities, their ability to be modified and extended and finally the ability to extract newly modified rules and fuzzy variables. As a consequence of this combination between the adaptive learning and human experience adaptive vigorous classification systems can be designed with high degree of reliability and accuracy.
Since the data and information used in the identification and classification of driving behaviors and maneuvers are time varying signals, pattern matching techniques, such as DTW, have been employed. In this approach the maneuvers are identified and classified by comparing the similarity of the collected sensors’ signals or estimated driving parameters patterns with predefined templates. If the incoming measured sequence has adequate similarity to one of the standard templates, then the system will indicate that a specific driving maneuver has been executed or detected. The major advantage of pattern matching techniques is that the system can sense maneuvers in spite of any differences, in their amplitudes or durations, with predefined templates. Therefore, it would be possible to develop a single set of standard templates that be used for matching maneuvers for different drivers to the same template set [25-28]. The main drawback of pattern matching approach is excessive computational requirements since the algorithms compute the similarity differences for all elements in two signals. This problem will be more significant when the classification analysis is dependent on multidimensional time series. Furthermore, enormous effort is required to extract and select the reference templates and it is also very hard to gather all types of templates due to the exclusive driving styles and behaviors of drivers.
Very recently, machine learning algorithms have been adopted and implemented to identify and classify driving maneuvers. Machine learning algorithms, when are well trained can generate specific rules that will enable them to identify and classify abrupt irregularity on a large set of data. Different approaches have been suggested and implemented to extract features for training these approaches such as simple threshold-based discriminators, statistical values, time domain parameters, frequency domain parameters, and most importantly rules inferred from clustering algorithms. Machine learning algorithms are generally categorized into three different approaches namely the supervised learning, unsupervised learning and semi-supervised learning. In Supervised learning techniques a dataset is first collected and labeled to certain predefined classes. Then a learning model is chosen and trained with some of the labeled dataset to produce a predicted output in different testing samples. Several algorithms under the supervised learning category have been used in the identification and classification of driving maneuvers and behavior such as K-Nearest Neighbor, Naive Bayes, Decision Trees [29], linear regression [30], Support Vector Machines (SVM) [31-32] and Neural Networks [33]. Unsupervised learning methods are used when there are no pre-knowledge about ground truth labels. Therefore, they are used to classify collected unknown data into groups depending on common trends, attributes, patterns, or relationships. There are different unsupervised approaches such as clustering techniques and self-organizing maps. Each approach uses different algorithm for classifying data into groups, and these algorithms could be simple straightforward that can divide collected data based on the common attributes or similar trends in their features. Nevertheless, when performing a pre-processing step of the data, unsupervised learning techniques are usually used with other techniques to enable specific characteristics of the learning model,. The K-means clustering [34] and Principal Component Analysis algorithms [30] are samples of the approaches used in driving behavior analysis.
2.1. Data Collection
As it has been stated modern smartphones are integrated with sensors that can be utilized to collect vehicle driving data for driving maneuver analysis. Previous work [35, 36] showed that precisely preprocessed and calibrated smartphone sensors are becoming a competitive approach to the high price in-vehicle customized DAS. In this study ten frequent maneuvers usually executed by drivers during highway driving are going to be detected and classified. Four of these maneuvers namely, braking, acceleration and left and right lane changes will be analyzed for both straight and curved road segments, in addition to another two maneuvers which are the merging on or exiting a highway. In the preliminary stages of this study an online vehicle driving data recording system has be developed and installed on three different android-based smartphones. The sensors that have been used are the Accelerometer, Gyroscope and the GPS. The developed App has been test by comparing its performance with well-established available Apps like AndroSensor. The sampling rate for the IMUs is in the range between 50 and 100 Hz, from which the optimal sampling rate then will be obtained.
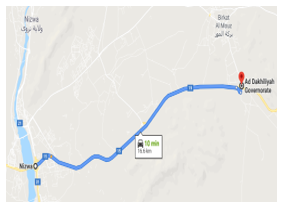
Figure 1: The route used to collected training data
The development of the system proposed in this study passed through two phases, the development and testing phase and the final real-time testing phase. In the first phase adequate data for training and testing the system were first collected. Ten drivers with different vehicles were enlisted to drive along a highway route of 16km long that covers varying road conditions as shown in Figure 1. In order to have adequate data for training and testing each driver repeat each of the basic divining maneuvers for at least five times with different severity levels from the defensive to the aggressive level. Data collected from inertial sensors in these tests are first pre-processed, then segmented and finally labeled into types and classes.
In addition to the collected data by the smartphone the state of the surrounding vehicles and the state of the driver have been recorded by two video cameras. These two recorded videos are combined with the manually segmented vehicle’s driving data to define each recorded maneuver’s irregularity levels by three experts. Each expert examined all recorded maneuver and assigned a category or a score for them. Each extracted maneuver will be assigned with an inter-rater agreement score that is calculated from the scores provided by each expert. If the inter-rater agreement score is low then the maneuver is assigned with deviated scores by the experts and there is no agreement on the classification. Therefore, experts are requested to iterate their evaluation to reach a high inter-rater agreement score for most of the extracted maneuvers.
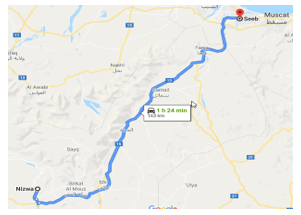
Figure 2: The route used to test data
One of the common problems that obstruct the development of reliable and accurate classification systems is the lack of adequate training and testing data. The lack of sufficient data for any classification problem could results in a noisy and instable class distribution. Therefore, for the sake of improving the system a second dataset was collected by installing a special app, developed by the author, in the smartphones of different 15 drivers, whom they drive on a daily base from the city of Nizwa to the capital Muscat over the route shown in Figure 2. The aim of collecting the second dataset is to enrich the training and testing data by performing a naturalistic driving through a route that is very dynamic and contains almost every different road types.
3. Calibration and Signal Processing
Smartphones’ sensors are cheap low-grade sensors that have several deficiencies that may impose restrictions to their use in certain class of applications. In vehicular applications, it is hard to measure and guarantee smartphones accuracy and reliability due to five main prominent problems and limitations namely:
1- Sensor and algorithm complexity
2- Limited battery power.
3- The perturbation of the measurements due to the usage of the device that causes change in its orientation.
4- The low accuracy of smartphone sensors.
3.1. Sensors Calibration
Smartphones’ IMUs have poor performance and are prone to error when especially used in measuring dynamic motion applications such as vehicle driving patterns. Therefore, sensors calibrations are used to correct sensors’ deterministic errors. The most common types of these sources of errors are biases, scale factors and axes misalignment. In addition to the above mentioned deterministic errors, smartphones’ sensors are also exposed to random noise and vibration, non-linearity due to thermal and magnetic effect and many others [37, 38]. To overcome these deficiencies a proper calibration process has been employed to eliminate Smartphones’ sensors deterministic errors namely, fixed biases, scale factor errors, and misalignment errors.
The accelerometers are used to measure the instantaneous forces acting on the sensor. The measured acceleration along any axis consists of three components namely; linear acceleration, gravitational acceleration field and noise. On the other hand, the gyroscope measures the rate of change in the device’s angular displacement, i.e. angular velocity, along the smartphone’s three orthogonal axes. As mentioned errors in an IMU’s measurements are contributed to three main categories: biases, scale-factor errors, and misalignment errors. The following equations (1) and (2) are used to model the accelerometer and gyroscope instantaneous measurement:
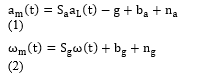
Here am, aL, Sa, g, ba and na represent the instantaneous measured acceleration component, the linear acceleration, scaling factor, gravitational acceleration, bias and noise respectively. While wm, w, Sg, bg and ng represent the measured angular velocity along one of the three axes, the true angular velocity, scaling factor, bias and noise respectively. In this paper a new set of calibration procedures were proposed and used to estimate and calibrate smartphone’s IMU sensors deterministic errors by considering the effects of vehicle vibration and noise [39-40].
3.2. Filtering
It is well known that data collected using IMU sensors contains substantial noise level, specially the accelerometer and the gyroscope readings. The noise in raw data can be contributed to several sources but mainly it is due to vibration noise and white Gaussian noise. There are different sources of vibration in vehicles such as road roughness, engine induced vibration, whirling of shafts, worn out parts, speed bumps, wheels, etc. In general, the data collected from the sensors contains random white Gaussian noise signals that oscillate with high frequency and typically have zero mean value. A sample for the measured noisy accelerometer and gyroscope signals are shown in Figure 3). In order to attain reliable and accurate recognition, the noise needs to be eliminated as much as possible. There are different approaches to filter distorted signals; for example statistical filters [41], digital filters [27], Kalman Filter [42] and many others.
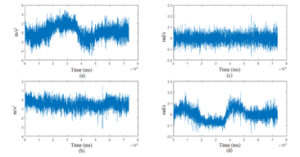
Figure 3: Noisy Smartphone Sensors Signals: (a) Accelerometer Signal x-Direction, (b) Accelerometer Signal y-Direction, (c) Gyroscope Signal x-Direction and (d) Gyroscope Signal z-Direction
In this paper three types of low-pass filters have been investigated namely; one-dimensional Kalman filter, simple moving average filter, and locally weighted running line smoother (LOSS). The performances of the aforementioned filters were compared to select the filter that effectively removes high frequency noise and maintain the real time variation of different driving patterns to the utmost extent.
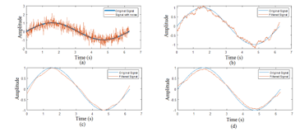
Figure 4: Filtering Results for Test Signal; (a) Original Test Signal; (b) Moving Average Filtering; (c) Kalman Filtering; (d) LOSS Filtering
The simplest filter is the moving average filter which filters the measured sampled signal by replacing each sampled value with the average of the neighboring sampled values defined within a given span or window. Kalman filter is a recursive predictive filter that is based on the use of state space techniques and recursive algorithms. The filter observes over time a series of measured data values, including noise, and then estimates new values that tend to be more accurate than those based on the actual measurement. The LOESS filter estimates the latent function in a point-wise fashion, where for each value of the measured sampled signal a new estimated value is found by using its weighted neighboring sampled (known) values. Detailed theory and implementation of this type of filters is presented in [43]. Due to the random irregular road pavement and vehicle vibration, it is found that the separation between of the real signals through total elimination of noise is not possible. Therefore, a test sinusoidal signal with imposed noise is used to assess the performance of the three filtering approaches. Figure 4 shows the results obtained for the three filters. It is clear that the LOESS technique can achieve very close results to Kalman filter where both effectively remove the nose while preserving the shape of the original signal. Figure 5 shows a sample of the measured accelerometer signals, from which the same conclusion regarding the two filters can be drawn. The LOSS filter has been used in the implementation of noise filtering unit of the complete system because of it is simpler to implement and faster to execute.
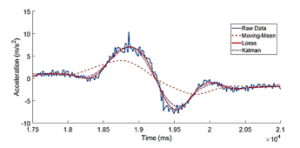
Figure 5: Raw and Filtered Accelerometer Signal
3.3. Smartphone Orientation
When smartphones are used to detect vehicle’s driving patterns they could be placed at any location with any arbitrary orientation. Since sensors’ measured signals are expressed in a specific frame that is static relative to the device, then one of the most interesting problems of smartphone-based vehicular applications is the separation of the dynamics of the smartphone from the dynamics of the vehicle. In this paper the smartphone is fixed to the windshield by a holder and it could have any orientation. Therefore, a reorientation correction process for the smartphone’s coordinate systems is integrated as a pre-processing module to transform the measured sensors data to the vehicle coordinate system. This process is performed by a sequence of geometrical rotations using Euler Angles by assuming that the vehicle is horizontally aligned during the initial calibration period, so that the vehicle roll and pitch angles relative to a tangent frame both are zero. Assuming that the vehicle does not experience any acceleration, the smartphone’s roll and pitch angles can be estimated from accelerometer measurements of the gravity vector as shown in Figure 6.
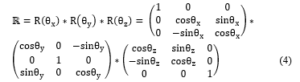
The determination of Euler angles has fully detailed in [44]. Upon the determination of rotational angles, the referenced coordinate system for the smartphone can be transformed to the vehicle-referenced coordinate system by multiplying with the reorientation matrices as follows:
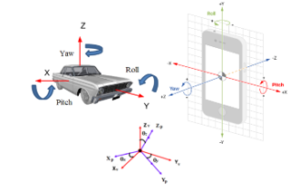
Figure 6: Smartphone and Vehicle Coordinate Systems
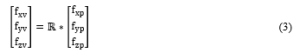
where fiv is the transformed measured signal to the vehicle reference, fip the measure signal in the phone reference and R is rotation matrix defined by:
4. System Overview
The general architecture of the proposed system and its design methodology is shown in Figure 7). The system contains five main modules: raw data acquisition, pre-processing, driving parameters estimation, maneuvers detection unit and maneuvers identification and classification unit. The function of each module is briefly described as follows:
- Android smartphones were used to capture vehicle’s raw data through by using its IMUs, i.e. the accelerometer and gyroscope at a rate of 50 samples/second. Furthermore, smartphone’s GPS data are also collected and used to provide vehicle’s location and to correct speed estimation.
- The pre-processing unit is designed to perform four functions namely; signals filtering, sensors error correction, transformation of sensors data to vehicle’s coordinate system and finally estimates the driving parameters.
- The manoeuvre detection unit is designed to detect and slice and executed manoeuvre in real-time by implementing the endpoint detection algorithm that identifies the starting and ending time.
- The identification and classification unit is responsible to identify manoeuvre’s type and its irregularity class. In this study the identification and the classification processes were performed separately by using a hybrid pattern matching and neural networks schemes.
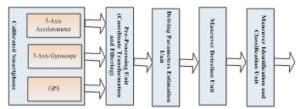
Figure 7: The Proposed System Architecture
5. Driving Parameters Estimation
A successful implementation of a driving maneuvers identification and classification system depends on the set of features and parameters that are used in the this process. In the literature there are two main approaches used to define the set of features and parameters namely, driver actions based approach and vehicle state based approach. In the first approach a number of essential driving signals can be collected from the vehicle’s CAN-BUS such as vehicle speed, gas pedal pressure, brake pedal pressure, steering wheel angle, and acceleration. The second approach utilizes different approach by monitoring the vehicle’s dynamic state in terms of longitudinal and lateral movements. These longitudinal and lateral movements can be detected and identified by using IMUs, GPS and the fusion of both the IMUs and the GPS. In this study it is believed that the description of vehicle’ dynamical state in terms of actual driving parameters is more informative than other approaches and useful for future investigations. Therefore, the vehicle’s acceleration, orientation and speed are used and represented as a time-series signals.
5.1. Longitudinal and Lateral Accelerations
The first and the simplest parameters that can be estimated directly are the longitudinal and the lateral acceleration components. The two components can be determined directly by subtracting the gravity the from the filtered accelerometer’s Cartesian components, axp, ayp and azp. The resulted singles are then transformed from the smartphone’s to the vehicle’s coordinate system by using Eqn. (4). The two components of the acceleration can be obtained by:
![]()
where, alat and alon are the lateral and longitudinal accelerations, axv, ayv are the x and y components of the acceleration represented in the vehicle coordinate system and the angles g and r are given by:
![]()
5.2. Vehicle’s Orientation
The second estimated parameter is vehicle’s heading or orientation. The attitude of a vehicle can be described by its angles of rotation along three axes as indicated in Figure 6). The attitude of any object can be modeled by different methods such as Direction Cosine Matrix, Quaternions and Euler angles. The first method has nine parameters to be estimated, hence it is difficult to implement. On the other hand, Quaternions has less parameters and it has advantages over Euler angles since it does not suffer from the gimbal lock problem, but still the Euler angles method is used in this study because it is more comprehensible and easier to decompose the rotations into separate degrees of freedom. Furthermore, since the smartphone is held in a fixed position inside the vehicle then the gimbal lock problem will not appear.
Euler angles can be found directly by using the measured gyroscope’s data and integrate them with respect to time [45]. The accelerometer can also be used to estimate Euler angles, where simple trigonometric projections can be utilized to obtain both the Roll and the Pitch angles. Nevertheless, both methods could results in low prediction accuracy due to the stochastic bias variation in gyroscopes and the noisy accelerometer signals that results in an accumulated drift error [45]. To overcome the limitations of the direct approaches, sensor fusion techniques are developed to join all sensors’ data to compensate the deficiency of each method. There are two filtering techniques namely; Kalman and complementary filters are widely used for sensor fusion. Because of its simplicity and reliability, the digital complementary filter is utilized to estimate of the orientation. The filter uses a low-pass filter for the accelerometer’s data to remove the high frequency noise and the dynamic bias, and utilizes a high-pass filter to suppress the drift from the gyroscope’s data. Figure 8) shows a simple block diagram illustrating the implementation of a digital complementary filter. The filter can determine the angles using the following equation:
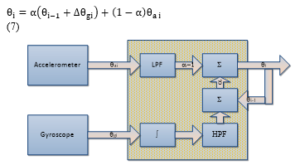
Figure 8: The Implementation of Digital Complementary Filter
In Eqn. (7), qi represent any of the estimated angles (Roll, Pitch or Yaw) and qi-1 is the formerly determined angles, while the subscripts g and a designate the sensor type. The empirical constant a is selected to set the time constant of the error-signal calculations and stabilize the rate-sensor angle calculation.
5.3. Vehicle’s Speed
Based on the kinematic equations, vehicle’s speed can be found directly from the smartphone accelerometer data by integrating the corresponding acceleration component, longitudinal or lateral, as follows:
![]()
where is final speed, is the initial speed and a(t) is vehicle’s acceleration. The system is a discrete one, hence a sequence of the acceleration data is collected and equation (8) can be rewritten as:
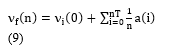
where T is the sampling rate, n is the present nth sample and a(i) is the ith accelerometer value.
As it can be noted the basic idea of estimating the speed is very simple, and it is expected that with rigorous calibration and noise filtering of the raw data will improve the estimation process and a reasonable accuracy would be achieved. Nonetheless, speed estimation by the direct integration of accelerometer data suffer from significant deviations and unrealistic drifts because the accelerometer data is not pure and still contains some noise and other effects. This can be clearly shown in Figure 9), where the variation of the speed obtained from the GPS and those obtained by using the direct integration are shown. The doted green curve shows the estimated speed when the accelerometer data are not calibrated neither filtered while the dashed orange curve shows the trend in the estimated velocity for the preprocessed accelerometer data. As it can be seen, the error is accumulated over time and will obviously cause serious errors in the estimation of the speed. Therefore, a correction method is required to instantaneously correct the speed estimation by eliminating the accumulative error.
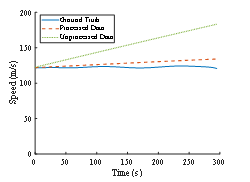
Figure 9: Comparison between Measured and Estimated Speed
In the literature there are mainly three methods that can be used to correct the accumulated error in numerical integration of the accelerometer data namely; high pass correction filter, Kalman filter and sensor fusion techniques. In this study, a simple but effective sensor fusion technique has been adopted and utilized to provide accurate velocity estimation [46].The basic idea of the technique is based on fusing the high frequency estimated speed with a low frequency ground truth speed obtained through the GPS. To illustrate the implementation of the vehicle speed estimator, consider Figure 10) that shows two equally spaced time intervals at which correction process take place at these instants. Suppose that the estimated speed and that measured by the GPS at time instant t = TA are nAE and nAG respectively, while those at the instant t = TB are nBE and nBG. The error of the speed at reference points then are given by:
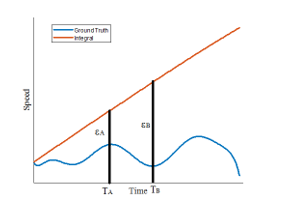
Figure 10: Vehicle Speed Correction Process
and
![]()
If we can consider that the rate of change in the accelerometer error is constant, i.e. that the accelerometer error varies linearly in this short interval, then this rate change can be expressed as follows:
![]()
From Eqn. (11) the accumulative error at any instant (t) can be given by:
![]()
The constant k is the number of samples passed from the time instant TA to t, and Ts is the sampling rate of the accelerometer. By knowing the accumulative error at any instant, then the estimated speed at instant (t) can be given by:
![]()
Further enhancement been has been achieved by using exponential moving average correction to the error rate change as follows:
Figure 11 shows the estimated speed and the speed obtained through the GPS. It can be clearly seen that there is some small error between the estimation and the ground truth, which indicates that the estimator has excellent accuracy.
6. Maneuvers Detection
The main task that is required to be performed by any driving monitoring system is to reveal driving maneuver with reasonable level of reliability and accuracy. Table (1) presents a list of the maneuvers that are detectable by the proposed system. The system should be able to process the measured signals or the estimated parameters and attempts to detect the maneuver. The system detects the variation in the vehicle’s longitudinal and lateral states by continuously monitoring the variation in the speed and orientation at a rate of 10Hz. Once a maneuvers is detected, the system can then proceed to recognize and classify it. There are different methods that can be used to detect the starting ending times of a maneuver [47-48]. In this paper the short-term energy endpoint detection algorithm with sliding window has been adopted, where the speed and orientation are continuously separated to event and non-event segments.
Table 1: Maneuvers Classes
| 1- | Acceleration straight road segment | 2- | Acceleration curved road segment |
| 3- | Braking straight road segment | 4- | Braking curved road segment |
| 5- | Left lane change straight road segment | 6- | Left lane change curved road segment |
| 7- | Right lane change straight road segment | 8- | Right lane change curved road segment |
| 9- | Merging into highway | 10- | Exit from highway |
The detection module consists of three key phases. In the first phase the signal is divided into non-overlapping windows of a 100ms period. The short-term energy is first computed for the data sequence in each window. For an infinite sequence of a discrete signal the energy is defined by:
![]()
where L is a window function given by:
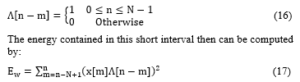
The value of the energy computed by Eqn. (17) is then compared to a threshold value, see Figure 12, and if the computed energy is lower than a specific threshold, then this frame is rejected and considered as a non-event segment. Otherwise, if the computed energy is higher than a lower threshold level Tl then the second stage will be executed.
Once the second stage is triggered, the starting time of the detected maneuvers is logged and the short-term energy is computed for a rectangular sliding window function as in Eqn. (17). Depending on the computed short-term energy in the second stage one of the following possibilities could be activated:
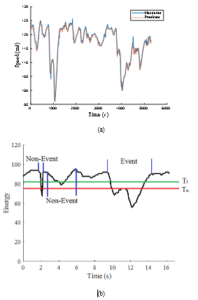
Figure 11: (a) Estimated and Measured Speed (b) Maneuver Detection using Short-Term Energy
- If the computed short-term energy is maintained to be less than the upper threshold Tu for less than 2 seconds or the energy fall back to a value lower than Tl, then this segment is treated as a non-event segment and the execution will resume from stage 1.
- If the computed short-term energy becomes higher than the upper threshold Tu for more than one second, then this segment will be treated as an event segment. In this case the system will continue computes the energy and compare it with the threshold until it drops back to the lower than Tl It is should be noted that if the energy falls down to be lower than Tu before the end of the first second then this segment will be regarded as a non-event segment, and the execution will start again from stage
7. Driving Maneuvers Identification and Classification
The Identification process is used to describe a driving maneuvers by a well-defined unique type. On the other hand the classification process evaluates the driving maneuvers to a certain class according to given criteria. In general there are two main approaches used for maneuver identification and classification, the first is based on the selection of a number of distinctive features and uses a machine learning technique, and the second approach is based on pattern matching algorithms. In this study 60% of the first dataset, described in section three, were used to study the time variation of each estimated driving parameters when a certain maneuvers has been executed. Figure 12) shows a sample of parameters’ variations for a brake maneuvers. Intensive off-line observations and investigation were made to study and analyze the behavior of the parameters variation for each maneuvers type and to infer a general trend in their variations. It has been clearly noticed that the variation of the parameters follow common variation patterns and this fact agrees with what been presented in the literature. Figure 13) shows ideal approximated patterns that could be generated during any driving maneuver. As it can be notices that the driving parameters have limited number of patterns, for example the longitudinal acceleration, the lateral acceleration and the speed have three different patterns each, while the heading angle has five different patterns. Based on these facts, the identification and classification processes are performed separately where the identification process is performed by using a hybrid pattern matching neural network unit and the classification processed is performed by using another neural network.
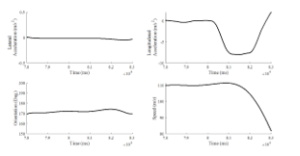
Figure 12: Driving Parameters Variation during a Break Manoeuvre
Figure 14) shows the basic units of the identification and classification module. The module consist of three units, a pattern matching units, to identify the patterns of estimated parameters, the second unit consist of a single feed-forward neural network that will identify the type of the maneuvers based on the combination of the identified patterns. Finally the third unit, which is responsible for the manoeuver classification, is performed by another neural network.
The pattern matching unit utilizes four DTW units, each one is designed to identify the pattern type for one of the parameters. The DTW is a pattern matching technique uses the discrete dynamic programming model to compute the alignment between two discrete time signals or sequences by assessing the similarity between them, regardless of the time/speed synchronization and distortion effects due to dynamic spatiotemporal differences.
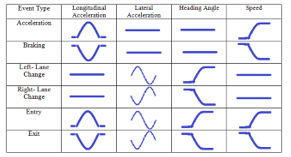
Figure 13: Driving Parameters Variation for Different Maneuver
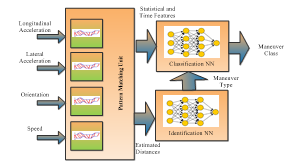
Figure 14: Structure of Identification and Classification Unit
To illustrate how the DTW algorithm works, consider two discrete signals, R = {r1, r2…, rm} which is the reference signal and an unknown signal S = {s1, s2…, sn} that need to be identified, where m and n represent the number of samples in R and S, respectively. In Figure 15) the two time series that are highly similar, are shown. To align these two sequences an (m ´ n) local distance matrix is constructed by populating its elements with the Euclidean distances as follows:
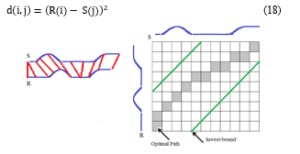
Figure 15: A DWT Matrix with a Warp Path
The correlation between the patterns of these two sequences is expressed by the cumulative distance measured over the optimal path within the distance matrix. For this purpose a warping matrix (D) is constructed and filled by searching for the minimum distance between the two sequences. This minimum distance can be found by computing the total distance D(i, j) for each entry (i, j) as:
![]()
In the final stage the optimal warping path (P), as shown in Figure 15), and the DTW distance are to be computed. The Warping path is a set of adjacent matrix elements that detect the similarity between R and S and it represents the minimum distance between R and S. The matrix (P) contains K elements which range in value as:
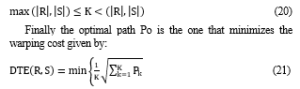
To reduce the complexity of the DTW technique and thus speeding up the execution time, not all the warping paths are evaluated. To reduce the number of paths considered during the matching process four constraints are usually applied namely; monotonicity, continuity, boundary and windowing. To prevent the warping path from rolling back on itself, the monotonicity constrain is imposed to assure that any two adjacent elements, and will follow the inequalities and . On the other hand, to guarantee a one-step advancement in the warping path, the continuity constrain is used to restrict the movement of the point (i, j) to the next point must be (i+1, j+1), (i+1, j), or (i, j+1). Finally, to assure that the warping path contains all points of both sequences, the boundary constrain is used to force the warping path to start from the top left corner and ends at the bottom right corner. Finally the windowing will prevent pathological mappings between two sequences by restricting one point in the first sequence to be mapped to a limited number of points in the other sequence; hence the path is likely to be around the diagonal without deviating much from it [49].
In order to identify the types of the maneuver by the DWT technique, a set of templates for each maneuvers are required as reference signals. To find a template signals for different set of sequences, one can consider that template sequence could be the longest common sequence, or the medoid sequence, or the average sequence. The selection of the reference pattern for each specific maneuvers class is not a simple task because the set of sequences collected for each maneuvers class have different time durations and amplitudes. In this study, the sequence with the minimum average distance from all other sequences for a specific class is selected as the reference template. The details of the averaging strategy are given in [50].
When dealing with single 1-D signal identification, the DTW technique will directly identify the test signal. Nevertheless, when it is required to identify a maneuvers or an action by using multiple measured signals, the DTW won’t be able to identify its type directly. This is because each signal will need a special DTW unit to identify the pattern of the signal only. In order to predict the type of the maneuvers, the combination of the DTW distances were used as features to train a neural network that will be used for the final identification of the maneuvers.
Statistical and time metrics have been utilized as features to classify maneuvers’ irregularities. In general maneuvers are categorized into one of three main types; Hard, Normal and Light. By studying all the possible patterns for all the classes, see Figure 13), it was found that there are seven distinctive patterns as shown in Figure 16). For each pattern time metrics and statistical values such as max, min, mean, standard of deviation and the variance are used as classification features. The segmented maneuvers collected in the first dataset were represented by a vector that contains the statistical and the time metrics for each driving parameter and the classification label. As it has been mentioned the classification labels are obtained from classification made by the experts. It is should be noted that the percentage of the rejected samples was less than 10%.
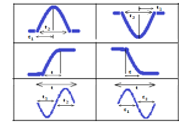
Figure 16: Time features for the common signals
8. System Validation
This section presents an experimental evaluation for the three main components of the proposed system namely, detection, the identification and classification units. To test the performance of the system, two different datasets have been used. In the first phase the first dataset described in section three has been used to train and conduct a preliminary testing of the system. In this phase a single smartphone (Samsung Galaxy S5) have been calibrated and used in all the tests. As been mentioned ten drivers with different car models were asked to conduct each of the basic maneuvers, listed in table (1), at least five times with different severity levels from the Light to the Hard level. From this dataset 1500 maneuvers were collected and segmented then each was combined with two videos, the first used to record the surrounding traffic state and the second used to record the driver’s state, i.e. hands and feet. To obtain the ground truth classification of each maneuvers, experts were consulted to evaluate the abnormality level. Each assessor assigned abnormality level scores for the entire recorded maneuvers and the final score for every recorded maneuvers was calculated using the inter-rater reliability method.
For this initial dataset 60% of the collected samples were utilized to extract the information and the features that were used in the training phase. The information and features includes the computation of the DTW reference templates, the DTW’s distances and the statistical and time metrics. The DTW reference templates have been stored and used to measure a vector that includes the distances of the warping for each recorded driving parameter of a specific tested sample. These vectors are used to train the first neural network which is used to identify the type of the maneuvers, while another set of vectors that contain the statistical and time metrics features used to train the classification neural network.
The remaining 40% of the first dataset have been used to validate the performance of the system. Figure 17 shows results obtained when the 40% testing samples fed to the identification module. It can be seen clearly that the identification rate is very high and reached a 100% successful rate for some of the maneuver and the minimum identification rate scored is 85%, and this is obvious since the identification process combines all the similarities for the four parameters. Figure 18, shows the confusion matrix classification for the 40% testing samples. Again it can be noticed that the classification rate is very high nearly 95% for some cases. This high identification and classification rates are expected since the two processes have been separated.
In the second phase of this study, the author developed a complete Android-based APP that detects, identify and classify the highway driving maneuver in real-time. The architecture of the system is described in section five. The first test for the system was to check its ability to detect the starting and end of a driving maneuvers. The complete trips performed by the ten drivers, from which the first dataset was collected, were used just to detect the driving maneuver. Figure 19, shows the detection of maneuvers for a sample trip. It should be noted that the first 1500 maneuver collected in the first data set were used to determine the lower and upper thresholds for short-term energy for both the vehicle’s speed and orientation. The results obtained by the system were compared with those already registered manually by the author. The system showed a high detection rate where more than 96% of the manually registered maneuver were detected successfully by the detection unit.
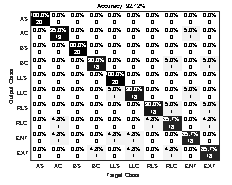
Figure 17: Confusion Matrix for Maneuvers Identification
The developed application allows two types of analysis namely, the real-time analysis and off-line analysis. The graphical interface of the developed application is designed to achieve user friendly interaction with the driver. All the driving maneuver are presented instantly to the driver using both audio and visual indicators. Each maneuvers type is represented by a special icon that it will be lighted up; along with a human voice that utters the name of the maneuvers when it is detected by the application. Furthermore, the icon’s color will be changed in accordance to the class of the maneuvers. This attractive and user friendly interface helped in measuring the performance and the reliability of the system in the second stage of the study. As been mentioned in section three a second dataset was collected from a naturalistic driving performed by 15 drivers who are daily travel a distance of 140km back and forth. We have asked driver’s companions to check the alerts produced by the application and check them. Data recoded by the companions and those stored in the SD card are then analyzed. Table (2), presents a comparison between the number of maneuver performed by each driver and those detected by the system. Note that the first number in any cell represents the performed maneuver, while the second number represents the detected maneuver. Figure 20 and 21 show the confusion matrix for the maneuvers’ identification and classification respectively.
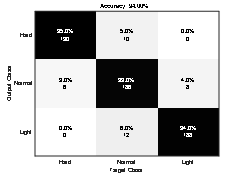
Figure 18: Confusion Matrix for Maneuvers Classification
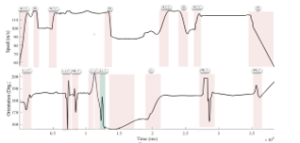
Figure 19: Driving Maneuvers Detection in a Complete Driving Trip
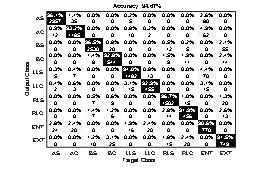
Figure 20: Confusion Matrix for Maneuvers Identification (Second Dataset)
Table 2: Comparison between Performed and Detected Maneuver for each Driver
| Driver | ACC/S | ACC/C | B/S | B/C | LLC/S | LLC/C | RLC/S | 37 : 34 | Ent. | Exit |
| 1 | 221: 210 | 95 : 87 | 184 : 176 | 48 : 42 | 112:109 | 37 : 33 | 114 : 111 | 40 : 36 | 60 : 57 | 60 : 56 |
| 2 | 211: 207 | 86 : 81 | 159 : 156 | 41 : 36 | 105:99 | 30 : 26 | 104 : 99 | 35 : 32 | 58 : 52 | 59 : 54 |
| 3 | 199: 189 | 85 : 81 | 154 : 142 | 43 : 38 | 108:100 | 41 : 36 | 107 : 102 | 39 : 36 | 59 : 57 | 59 : 57 |
| 4 | 230: 222 | 87 : 84 | 200 : 194 | 44 : 40 | 110:104 | 36 : 33 | 109 : 105 | 31 : 28 | 58 : 56 | 58 : 56 |
| 5 | 219: 213 | 93 : 86 | 194 : 186 | 46 : 42 | 114:109 | 40 : 36 | 111 : 106 | 34 : 29 | 60 : 56 | 60 : 57 |
| 6 | 216: 209 | 91 : 85 | 188 : 181 | 45 : 40 | 107:104 | 39 : 34 | 106 : 101 | 41 : 35 | 59 : 56 | 60 : 56 |
| 7 | 220: 212 | 89 : 83 | 166 : 162 | 41 : 36 | 109:108 | 38 : 32 | 110 : 104 | 37 : 34 | 59 : 55 | 59 : 55 |
| 8 | 223: 214 | 90 : 85 | 172 : 168 | 42 : 37 | 111:107 | 34 : 30 | 113 : 108 | 40 : 36 | 58 : 57 | 59 : 57 |
| 9 | 218: 210 | 94 : 86 | 190 : 187 | 47 : 40 | 112:110 | 37 : 34 | 105 : 100 | 35 : 32 | 55 : 51 | 55 : 52 |
| 10 | 210: 202 | 93 : 88 | 185 : 179 | 48 : 44 | 108:102 | 40 : 36 | 108 : 104 | 39 : 36 | 56 : 53 | 57 : 54 |
| 11 | 200: 193 | 92 : 84 | 184 : 180 | 43 : 39 | 115: 110 | 35 : 32 | 112 : 107 | 31 : 28 | 58 : 55 | 57 : 53 |
| 12 | 207: 201 | 90 : 84 | 180 : 173 | 44 : 39 | 104:99 | 39 : 36 | 110 : 106 | 34 : 29 | 60 : 56 | 60 : 56 |
| 13 | 215: 208 | 89 : 85 | 176 : 172 | 40 : 35 | 106:102 | 31 : 28 | 104 : 99 | 41 : 35 | 57 : 55 | 57 : 54 |
| 14 | 201: 196 | 88 : 83 | 185 :180 | 42 : 37 | 110:106 | 34 : 29 | 101 : 97 | 37 : 34 | 59 : 56 | 60 : 56 |
| 15 | 196: 191 | 95 : 89 | 190 : 186 | 45 : 41 | 114:108 | 41 : 35 | 110 : 104 | 40 : 36 | 57 : 52 | 56 : 51 |
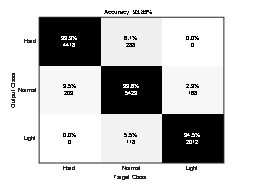
Figure 21: Confusion Matrix for Maneuvers Classification (Second Dataset)
9. Conclusion
This paper proposes a novel real-time smartphone-based highway driving maneuvers identification and classification system. The system collects vehicle’s longitudinal and lateral movements using smartphone’s IMU sensors and vehicle’s location by using the GPS. All the smartphones used in this investigation were calibrated the collected smartphone’s raw data were filtered and smoothed by using the statistical LOESS filter. Driving parameters namely vehicle’s acceleration, orientation and speed were used in the identification and classification of the driving maneuver. Sensor fusion techniques have been used to estimate vehicle’s orientation and speed.
It was noted that driving parameters for each event class have common patterns, thus the DTW technique combined with a feed-forward neural network are used for the identification. In the classification process a second neural network was employed, and it is trained to classify a maneuver classes. Two datasets were collected through a number of experiments conducted on highway routes. Results obtained in this study show an excellent detection, identification and classification rates were achieved.