
An Evaluation of some Machine Learning Algorithms for the detection of Android Applications Malware
Volume 5, Issue 6, Page No 1741-1749, 2020
Author’s Name: Olorunshola Oluwaseyi Ezekiel1,a), Oluyomi Ayanfeoluwa Oluwasola2, Irhebhude Martins2
View Affiliations
1Cyber Security Department, Faculty of Computing, Air Force Institute of Technology, Kaduna, 800283, Nigeria
2Electrical Electronics Engineering Department, Air Force Institute of Technology, Kaduna, 800283, Nigeria
3Computer Science Department, Nigerian Defence Academy, Kaduna, 800283, Nigeria
a)Author to whom correspondence should be addressed. E-mail: seyisola25@yahoo.com
Adv. Sci. Technol. Eng. Syst. J. 5(6), 1741-1749 (2020); ![]() DOI: 10.25046/aj0506208
DOI: 10.25046/aj0506208
Keywords: Mobile phone, Malware, Algorithms, Operating System, Benign

Export Citations
Android Operating system (OS) has been used much more than all other mobile phone’s OS turning android OS to a major point of attack. Android Application installation serves as a major avenue through which attacks can be perpetrated. Permissions must be first granted by the users seeking to install these third-party applications. Some permissions can be subtle escaping the attentions of the users. Some of these permissions can have adverse effects like spying on the users, unauthorized retrieval and transference of the data and so on. This calls for the need of a heuristic method for the identification and detection of malware. In this discourse, testing of classification algorithms including Random forest, Naïve Bayes, Random Tree, BayesNet, Decision Table, Multi-layer perceptron (MLP), Bagging, Sequential Minimal Optimization (SMO)/Support-Vector Machine (SVM), KStar and IBK (also known as K Nearest Neighbours classifier (KNN)) was carried out to decide which algorithm performs best in android malware detection. Two dataset was used in this study and were gotten from figshare. They were trained and tested in the Waikato Environment for Knowledge Analysis (WEKA). The performance metrics used are Root Mean Square Error (RMSE), Accuracy, Receiver Operating Curve (ROC), False positive rate, F-measure, Precision and recall. It was discovered that the best performance with an accuracy of 99.4% was the multi-layer perceptron on the first dataset. Random Forest has the best performance with accuracy, 98.9% on the second dataset. The implication of this is that MLP or random forest can be used to detect android application malwares.
Received: 08 October 2020, Accepted: 25 December 2020, Published Online: 30 December 2020
1. Introduction
This work is an extension of [1] in which this work considers another dataset in carrying out the research. This research answers the questions from the comments received about the biasness of the algorithms used.
There has been a considerable increase in the usage of mobile phones year on year. Mobile phones have served as a medium of communication through calls and short mailing services (SMS) [2]. Technological advancement has increased the usage of mobile phones for various purposes. The operating system (OS) of mobile phones have evolved from java to Symbian with the current ones being android OS, windows OS and Apple OS – iOS [3]. The usage of mobile phones spans from individuals to organizations as well. This study focuses on Android OS. Mobile phones with Android OS comprises of some components which are; the
Android OS, the middleware and key applications [4]. The android OS has the biggest and fastest growing smartphone OS market, hence it has become a practical target for cyber criminals [5]. Large support to third party applications is also gotten from android. These third party applications can easily be downloaded on the popular Google Play store [6]. The developers of the Android OS do not develop third-party applications; it is done by software developers. Hence the name of the third party applications [6]. In [7], there are over 2.7 billion mobile users globally, and in 2022, 258.2 billion apps are projected to be downloaded. Android phones are useful for crucial functions ranging from financial transfers to e-commerce transactions (goods payments) and so on [8]. It also allows other features, such as photo editing, game play, social media and messaging, internet searching, typing, listening, reading, and so on. Any of all these procedures are feasible due to the implementation of third-party apps.
The growth of android application malware has been made possible by the free application market for the Android OS [9]. The most severe and important threat to the Android OS arises as a result of malicious applications especially from unauthorized applications market that can easily be installed on any phone [9]. Android applications depend on users to grant permission to work optimally. Such permissions can forewarn users to the applications’ secrecy and/or security [10]. Android malware can impersonate a legitimate program, but with intrusive permissions for which an agreement is required from the users before installation can be done [10]. The malware executes activity(s) that are malicious through these permissions. SMS spy pro is an example, masking itself as a tip calculator but forwarding all sent SMS and received SMS by the user to a third party [11]. Android malware can access and steal user data such as browsing history, SMS, location of GPS, phone records, e-mails, other application information (Like Facebook log-in details) and more [12]. Tasks such as snapping and sending photographs, sending unauthorized e-mails, conducting bank transfers without user awareness can also be executed [2]. The degree to which both malicious and innocuous applications can execute their functions is primarily dependent on the form of permissions that users grant them.
Considering the sensitivity of the data that can be colleted from users via the malwares combined with the kind of damage that can be done by these malwares (for example, spying, identity theft, extortion, logic bomb) [13], these malwares need to be identified effectively. Due to zero-day attacks, the conventional malware detection techniques that uses the malware signature to store them in a repository has proved to be ineffective [9]. Zero-day attacks are based on new flaws found by cyber attackers that the creator is unaware of and thus has not issued a patch [14]. Therefore, until the developers are aware, the attackers make the most of these vulnerabilities. Android malware with its corresponding permission requests must be found [9]. This study is focused on Olorunshola and Oluyomi’s recommendations in [1]. An evaluation of the classification algorithms with regard to their performance in the identification of malicious software based on their manifested permission, command signature, API call signature and intents, is the aim of this study. This study aims to verify the conclusions drawn by Olorunshola and Oluyomi by training and testing the algorithms with additional datasets in this research. Two android datasets based on manifest permission, command signature, API call signature and intent are obtained from figshare created by [15] to achieve this aim. The algorithms are trained and tested on the datasets. The remaining portion of this work is structured as follows: review of literature, methodology, result and discussion, conclusion and future work.
2. Literature Review
2.1. History of Android
Android was created using the name of Android Inc company by Rich Miner, Nick Sears, Chris White, and Andy Rubin in 2003 [16]. Android began as a camera OS intended to enhance connectivity between personal computers (PCs) and cameras, allowing communication wireless between cameras and PCs. After a couple of months of the company’s formation, the OS was adapted towards making mobile cell phones smarter [17]. Android was purchased by Google in August 2005. Android OS was created using the Linux kernel to make it free for mobile phone manufacturers [16,18]. The first version of Android OS (version 1.0) was released in November 2007, and the novel Android handset, T-Mobile, was deployed in September 2008. While it has a lot of feedback and appraisal, it ran with Android 1.0 OS, and it has other Google apps such as play store, charts, YouTube, etc. built on it. [16,18]. As the year passes by, android OS has evolved into improved models. Android 10 is the latest edition of Android, launched in September 2019 [19, 20].
The stack layers of Android apps contain applications, application framework, libraries and the Linux kernel, with each layer closely incorporated to offer stronger smartphone applications. Interoperability has also been provided for to make it easier for design developers to work and develop their applications at a cost-friendly level [4]. It made it possible for anyone to obtain due to the open source nature of the Android framework thus growing its users over the years. Android sales stood at 115 million units in 2011, and Android OS accounted for around 52.5 percent of the overall number of mobile phones [21]. The Apple App Store reportedly has 2.2 million applications [7]. Recently, about 68.71 percent of people use android OS while 29.60 percent use iOS, 0.30 percent use Windows devices, while 0.06 percent use Symbian [22]. The heavy use of android OS is attributed to several factors that include the reduced price relative to iOS, open source enabling third-party software installation unlike iOS. The sum total of applications available in the Android store (play store) as of 2017 was around 2,800,000 [22]. In March 2018, the applications in the play store crossed 3.600,000 [23].
2.2. Security in Android
IOS as a closed framework that offers more data protection and is more pristine than Android which is an open source. In the play store, developers can host the applications they have built giving rise to Android vulnerabilities [22]. The security enhancements in Android were clarified in [24]. They are public vs. private components, components open implicitly, permission for broadcast intent, permission for content provision, secure APIs, service hooks, pending intents, permission protection level, URIs permission. Security refinements such as these, aid the protection of the data of users from manipulation and abuse.
2.3. Android Malware
The skill to debone the code used in the development of Android applications and the open source nature of the applications also enabled the easy encoding of malicious codes and increased number of attacks [25]. In [26], Networks recorded that mobile malware rose to 155 percent in 2011, with a rise of 614 percent from March 2012 to March 2013, of which 92 percent of the malware is Android. When android devices are upgraded to the latest OS, about 77 percent of threats to android can be eliminated. Just one threat infected about 5,000 devices in the third quarter of 2018. This accelerated through phishing using download and installation of a voice message application that is fake thereby sends all the user’s data to a server or using text messages [27]. Report has it that 2,47 million of the latest mobile malware were discovered in 2013, indicating a 197 percent increase over 2012 [28].
From a simplistic SMS sending Trojan, Android malware has advanced to more futuristic codes that can corrupt other applications, encrypt user data, gain root privileges, download and install more applications that are malicious bypassing the knowledge of the users, and load a payload from a remote server to cellular phones [9,29]. In [29], the authors gave a complete malware for android analysis looking at the past, observing the present and predicting the potential android malware cases into the future. In [30], the author gave a thorough analysis of the models of mobile malware dissemination and explored potential future developments as well.
2.4. The dangers of android malware
Users are exposed to multiple attacks and may suffer from them if an android OS is compromised with malware. According to [25]. Many of the threats they face include but are not restricted to:
- Personal information theft which can lead to theft of identity
- Loss of privacy
- Monitoring of the users
- Financial loss through ransomware
- Remote operation of the phones
2.5. Android malware detection
Detection of Android malware can broadly be divided into;
- Signature-based: Detection using signature-based detection uses the malware’s identity to determine the genuineness of the malware. The downside of this method is some form of attacks may be eluded. E.g., byte code level transformation [28].
- Machine-learning focused: The detection based on machine-learning uses an analytical method that includes extracting features from the application’s behaviour [28]. These behaviours (permission request, API calls) are then developed into a dataset and then a machine learning algorithm is used to test and train. The measurement metrics used in the evaluation include: precision, accuracy, false positive, to mention a few.
Several approaches to android malware detection have been put forward; the use of applications’ requested permissions, specific application programming interface for detection, the use of the applications’ fundamental code (since most codes for malware are modifications of existent codes), sandboxing, components encapsulation, optional access control or signing of application [31,32].
This study is aimed at the usage of manifest permission, API call signature, intents and command signature for the android malware detection. The rights defined by the developer in the application to allow system interrelationship: to access system components (such as camera and GPS) or modules of other applications is permission [33]. There are four types of android permission with two classifications, according to [2,34]. These are:
- Signature permissions: These applications are authorized only if it is certified by the creator of the stipulated consents. It is used for component access restriction to a limited collection of application controlled and trusted only by the creator.
- System permissions: Once the application satisfies the signature criteria, these applications are authorized. Applications requesting these permissions are pre-installed by an advanced customer or system manufacturer.
The two permissions (Signature and System) are booked for applications that have signatures with keys accessible only to the creator of the firmware. This is not available for implementations from third party application.
- Normal permissions: These are software that do not need the involvement of the customer. They are immediately accepted.
- Dangerous permissions: These are software that prompts the user what system facility will be used before it can perform its function. Prior to installation, they must be issued by the consumers. [2, 34].
In [34] and [35], the studies titled “PScout: Analyzing the Android Permission Specification” and “Android Permissions Demystified” evaluated the different android OS permission specification. In [2], the author also examined certain motives for some evasive consents. Some are broadcast theft, malicious service launch, hijacking of activity, malicious activity launch, hijacking of service.
2.6. Review of Past Works
Some research has been conducted in the detection of malware, part of which includes:
A Naïve Bayes algorithm model for android malware detection system was proposed by Shang, Li, Deng, & He in [36]. By using the new permissions for malware and training permissions impact as the weight, the detection accuracy was enhanced. In order to strengthen the model, a detection model of information theory and permissions based on the enhanced Naive Bayes algorithm was used also. As a rate of detection for non-malicious applications, the proposed model earned 97.59 percent.
In [37], the authors proposed a hybrid intelligent model which evolves and uses support vector support (SVM). Genetic algorithm (GA) and particle swarm optimization (PSO) were used to resolve the optimization challenge in the SVM. This helped boost the classifier’s accuracy. With the use of GA, 95.60 percent accuracy was obtained as the highest.
In [38], the authors performed a fixed evaluation of applications for android, tested the existence and occurrence of words that ae key in the manifest file of the applications, and established static feature sets from a dataset of 400 applications to yield superior results for malware detection. KNN and SVM classification algorithms were applied getting an average accuracy of 79.08 percent and 80.50 percent respectively.
In order to detect malware, Shohel Rana, Gudla, & Sung in [39] improved and analyzed certain algorithms through the implementation of a static analysis that is classifier based. When random forest was used on the dataset, 94.33 percent was obtained as the accuracy.
In [31], the authors proposed a technique of malware detection by first extracting the function call graphs from android applications and then embedding the function call graphs with a direct map feature. This was inspired by a linear-time graph kernel. They used the structural features of 12,158 samples of malware. SVM classifier was trained to differentiate between malicious and benign applications. 89% of the malware was detectable using this technique with minimal false alarms pin-pointing the code structures which are malicious within the android applications.
In [28], the authors extracted a weighted contextual API dependency graphs as program semantics which was used to create the feature sets. Authors also introduced graph similarity metrics to discover identical application behaviours for the purpose of discovering zero-day malware. In their work, a system called DroidSIFT was implemented to evaluate 2200 malwares and 13500 benign samples. It was able to correctly classify 93% malware instances while the detection of zero-day malware had a low false negative rate of 2% and false positive rate of 5.15%.
In [25], the authors presented a method of detecting malware in android by examining the manifest files of the android application since there are differences that are significant in the manifest files of benign and legitimate applications. Manifest files carry important information of the application like the name of the package, the version number of the application, the intent filter (action, category and priority), the API level, required permission, this approach was discovered to be effective by the use of real samples of android malwares. A total of 365 samples were used and the total correct detection was 90.0%.
In [5], the authors presented an automated detection system for the android platform (AMDA) where the behaviour analysis of the application was utilized. The features of both malicious and benign applications were first extracted to form the dataset used. Various algorithm in WEKA which include, Navies Bayes, decision tress and so on were used for the analysis.
In [40], the authors proposed a technique of applying the Bayesian classifier in a novel way. 1,000 samples each for both benign and malicious application was gotten. The accuracy obtained was 0.921 and true positive rate of 0.906.
In [41], the authors proposed a machine learning approach to the detection of malware in android using 200 features. These features were taken out of both the static and dynamic analysis of android applications. The deep learning technique used had an accuracy of 96.5%.
In [42], the authors used 17 supervised learning techniques to analyse adware in android devices and compared the result. It was discovered that Random Forest was the best classifier with an accuracy of 0.9838 and a false positive rate of 0.017.
This research was inspired by the recommendations in [1]. Their research study comprises of commonly and hardly used machine learning algorithms and it was found that multilayer perceptron (MLP) outperforms the other algorithm having an accuracy of 0.994. It was therefore recommended that other dataset should be put into consideration to confirm if MLP is dataset-specific.
3. Methodology
3.1. Environment Description
This research was conducted using the Waikato Environment for Information Analysis (WEKA) version 3.8.3 which was developed in [43]. Ten algorithms out of the available algorithms in WEKA were used in this research.
3.2. Dataset Description
From publicly available datasets, two datasets were used in the study. The first was gotten from figshare which was developed in [15]. The dataset contains a total of 215 characteristics which were extracted from 3,799 applications; 1,260, malicious and 2,539, benign. The second was also developed by Yerima in [44]. The dataset contains 215 attributes with 15,036 instances of which 5,560 was malware and 9,476 was benign.
Table 1: Description of the Android Malware Datasets
| Description | Dataset | |
| First | Second | |
| Instances | 3,799 | 15,036 |
| Malware | 1,260 | 5,560 |
| Benign | 2,539 | 9,476 |
| Attributes | 215 | 215 |
Attributes/characteristics are the applications’ features that were extracted. The extracted features were gotten from the manifest permission, the API call signature, the commands signature and the Intents. Some features extracted under the manifest permission are SEND_SMS, RECORD_AUDIO, READ_PHONE STATE, WRITE_SMS, USE_CREDENTIALS, GET_ACCOUNTS, MANAGE_ACCOUNTS, RECEIVE_SMS. Some features under the API call signature are IBinder, Binder, createSubprocess android.os.IBinder, URLClassLoader. Some features under intents are android.intent.action.ACTION_POWER_DISCONNECTED, android.intent.action.NEW_OUTGOING_CALL, android.intent.action.CALL_BUTTON. The command signature has only the following features /system/app, mount, /system/bin, chmod, chown and remount.
3.3. Classification Algorithms application
The training and testing was carried out with the 10 algorithms chosen in the WEKA environment. The algorithms are Random forest, Naïve Bayes, Random Tree, BayesNet, Multi-layer perceptron (MLP), Decision Table, Sequential Minimal Optimization (SMO), Bagging, KStar and IBK (also known as K Nearest Neighbours classifier (KNN)). The 10-folds cross validation and 66% split were used to train and test in the condition. In the 10-folds cross-validation, the dataset is divided into 10 folds or parts wherein each fold is divulged in almost equal sizes as the full dataset while the 9 remaining is used for training. This procedure is repeated for each fold, making it ten times. The mean for all the 10 folds is then calculated for each performance metric. The 66% split divides the dataset into 66% and 34%. It uses the 66% part of the data for training while using the 34% for testing. The 66% split was used to validate each algorithm.
3.4. Graphical Representation of the Methodology
Figure 1 shows the graphical representation of the how the research was carried out.
3.5. Performance Evaluation
Below are the performance metrics used in evaluating the algorithms.
- Accuracy: This calculates the rate of applications correctly classified, taking into account true positive, false negative, true negative and false positive [45].
- False Positive Rate (FPR). This calculates the rate incorrectly classified instances as benign. A low FP-rate implies that the classifier is good. [46]
- Precision, Recall and F-measure. Precision is the ratio of instances that are positively predicted among the retrieved instances. Recall is the ratio of instances which were positively predicted among all the instances and F-measure is the harmonic mean of recall and precision.
A high F-measure is essential since both precision and recall are desired to be at high levels [47,48]. Therefore

- Receiver Operating Characteristic (ROC) curve. A high ROC value means that the algorithms are good. The true positive rate is plotted against the false positive rate [46].
![]()
where TPR is True Positive Rate
- Root mean square error (RMSE). This is the predicted error’s standard deviation. The error between the training and the testing dataset is the predicted error. A low RMSE means that the classifier is good [49,50].
RMSE =
where SD = Standard Deviation
r = Predicted error
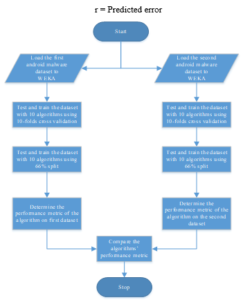
Figure 1: A graphical representation of the methodology
3.6. Algorithm Evaluated
Below are the description of two of the algorithms that stood during this research work
- Multilayer perceptron (MLP) is a perceptron that join up with extra perceptron, packed in many layers to figure out compound problems. Every perceptron in the input layer that is first layer to the left sends outputs to all the unseen layers that is the second layer perceptrons and all the second layer perceptrons send outputs to the output layer to the right that is the final layer [51].
- Random Forest: An additional dimension of randomness was introduced to bagging to create random forest in 2001. The algorithm creates tree predictors, and for all the trees in the forest, each tree depends on the random vector differently and autonomously sampled with the same dispersal. The best of these randomly chosen predictors is used in [52, 53].
4. Result and Discussion
This sections discusses the result gotten from the analysis done.
4.1. Analysis of the result
The dataset is made up of both malicious and innocuous applications. After the 10 algorithms have been trained and tested with the 10 folds cross validation and 66 percent split in the WEKA environment, the obtained results is discussed in this section. Table 2 and table 3 show the performance metrics of dataset 1 and dataset 2 respectively. The performance metrics used are; accuracy, RMSE, false positive, ROC, precision, recall and f-measure. Figure 1 shows a display of the best performing algorithm in WEKA using the second dataset.
- Discussion on the first dataset
While performance was optimal for all algorithms when trained and tested with the first dataset as seen in table 2, judging by accuracy, the top performing algorithm is the multilayer perceptron (MLP) having an accuracy of 99.4% when trained and tested under 66% split as previously stated in [1]. Under the 66% split, the MLP has the lowest false positive rate of 0.006 measured and also the highest recall (0.994), f-measure (0.994) and RMSE (00764).
Random Forest performs best measuring with respect to precision (0.993), accuracy (0.993), recall (0.993), f-measure (0.993) and ROC when trained and tested under the 10 folds cross validation [1]. MLP evaluated under the 66% split is, however, the best performing algorithm overall.
- Discussion on the second dataset
In the second dataset, as seen in Table 3, while all algorithms perform well when evaluated with the dataset, the random forest had an accuracy of 98.9% when trained and tested under 10 folds cross validation making it the algorithm that performed best in terms of accuracy. The IBK has 0.013 as the lowest false positive rate. In comparison, the random forest has a reduced FPR of 0.016 and has the highest precision (0.989), recall (0.989), f-measure (0.989) and ROC (0.998). Kstar had the lowest RMSE of 0.0984.
Table 2: Showing the result of the performance metrics of the algorithms on the first datase
| Accuracy | False Positive | Precision | Recall | F-Measure | ROC | RMSE | ||||||||
| 10 Folds | 66% Split | 10 Folds | 66% Split | 10 Folds | 66% Split | 10 Folds | 66% Split | 10 Folds | 66% Split | 10 Folds | 66% Split | 10 Folds | 66% Split | |
| MLP | 0.989 | 0.994 | 0.012 | 0.006 | 0.989 | 0.994 | 0.989 | 0.994 | 0.989 | 0.994 | 0.999 | 0.999 | 0.0938 | 0.0764 |
| SMO | 0.991 | 0.991 | 0.011 | 0.009 | 0.991 | 0.991 | 0.991 | 0.991 | 0.991 | 0.991 | 0.99 | 0.991 | 0.096 | 0.0923 |
| IBK | 0.992 | 0.991 | 0.008 | 0.01 | 0.992 | 0.991 | 0.992 | 0.991 | 0.992 | 0.991 | 0.995 | 0.996 | 0.0853 | 0.0851 |
| KStar | 0.992 | 0.991 | 0.01 | 0.01 | 0.992 | 0.991 | 0.992 | 0.991 | 0.992 | 0.991 | 0.999 | 1 | 0.0811 | 0.0823 |
| Random forest | 0.993 | 0.99 | 0.013 | 0.018 | 0.993 | 0.99 | 0.993 | 0.99 | 0.993 | 0.99 | 1 | 1 | 0.0913 | 0.0985 |
| Bagging | 0.986 | 0.983 | 0.02 | 0.023 | 0.986 | 0.983 | 0.986 | 0.983 | 0.986 | 0.983 | 0.999 | 0.998 | 0.1115 | 0.1186 |
| Random Tree | 0.972 | 0.972 | 0.033 | 0.029 | 0.972 | 0.972 | 0.972 | 0.972 | 0.972 | 0.972 | 0.97 | 0.972 | 0.1662 | 0.1669 |
| NaiveBayes | 0.958 | 0.96 | 0.045 | 0.039 | 0.959 | 0.961 | 0.958 | 0.96 | 0.959 | 0.96 | 0.994 | 0.995 | 0.1852 | 0.1821 |
| Decision Table | 0.938 | 0.947 | 0.066 | 0.059 | 0.939 | 0.947 | 0.938 | 0.947 | 0.938 | 0.947 | 0.977 | 0.979 | 0.2074 | 0.2032 |
| BayesNet | 0.927 | 0.93 | 0.046 | 0.046 | 0.937 | 0.938 | 0.927 | 0.93 | 0.929 | 0.931 | 0.992 | 0.993 | 0.2448 | 0.2482 |
Table 3: Showing the result of the performance metrics of the algorithms on the second dataset
| Accuracy | False Positive | Precision | Recall | F-Measure | ROC | RMSE | ||||||||||
| 10 Folds | 66% Split | 10 Folds | 66% Split | 10 Folds | 66% Split | 10 Folds | 66% Split | 10 Folds | 66% Split | 10 Folds | 66% Split | 10 Folds | 66% Split | |||
| MLP | 0.972 | 0.97 | 0.037 | 0.034 | 0.972 | 0.97 | 0.972 | 0.97 | 0.972 | 0.97 | 0.992 | 0.992 | 0.1621 | 0.1676 | ||
| IBK | 0.988 | 0.985 | 0.013 | 0.018 | 0.988 | 0.985 | 0.988 | 0.985 | 0.988 | 0.985 | 0.994 | 0.99 | 0.1032 | 0.1167 | ||
| KStar | 0.988 | 0.985 | 0.014 | 0.018 | 0.988 | 0.985 | 0.988 | 0.985 | 0.988 | 0.985 | 0.998 | 0.998 | 0.0984 | 0.1113 | ||
| SMO | 0.978 | 0.972 | 0.027 | 0.035 | 0.978 | 0.972 | 0.978 | 0.972 | 0.978 | 0.972 | 0.976 | 0.969 | 0.147 | 0.1673 | ||
| Random forest | 0.989 | 0.984 | 0.016 | 0.024 | 0.989 | 0.984 | 0.989 | 0.984 | 0.989 | 0.984 | 0.998 | 0.997 | 0.1058 | 0.121 | ||
| Bagging | 0.978 | 0.973 | 0.029 | 0.034 | 0.978 | 0.973 | 0.978 | 0.973 | 0.978 | 0.973 | 0.996 | 0.995 | 0.1333 | 0.1465 | ||
| Random Tree | 0.973 | 0.968 | 0.03 | 0.037 | 0.973 | 0.968 | 0.973 | 0.968 | 0.973 | 0.968 | 0.972 | 0.965 | 0.164 | 0.1791 | ||
| NaiveBayes | 0.834 | 0.836 | 0.122 | 0.126 | 0.865 | 0.863 | 0.834 | 0.836 | 0.834 | 0.839 | 0.949 | 0.839 | 0.3972 | 0.3957 | ||
| Decision Table | 0.922 | 0.907 | 0.077 | 0.093 | 0.924 | 0.909 | 0.922 | 0.907 | 0.922 | 0.908 | 0.976 | 0.962 | 0.2322 | 0.2524 | ||
| BayesNet | 0.828 | 0.829 | 0.124 | 0.128 | 0.862 | 0.861 | 0.828 | 0.829 | 0.831 | 0.831 | 0.928 | 0.925 | 0.4082 | 0.4081 | ||
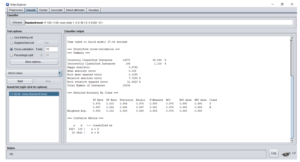
Figure 2: A display of Random forest in the environment using the second dataset.
Under the 66% split, KStar and IBK performs best with the same accuracy (98.5%), false negative (0.018), precision (0.985), recall (0.985) and f-measure (0.985). Kstar performs best in terms of ROC and RMSE with values of 0.998 and 0.1113 respectively. However, the overall best performing algorithm is Random forest tested under the 10 folds cross validation.
Although MLP was found to have the best performance under the 66% split when tested with the first dataset, it is seen that it was not able to maintain this performance when tested on the second dataset, this shows that MLP is data-set specific. This is as a result of the increased instances in the second dataset. The performance metrics of MLP was not maintained as a result of the increase in the instances. It is noteworthy in the classification of the first dataset that the analysis done under the 10 folds cross validation shows that random forest performs best with an accuracy of 99.3% having a difference of 0.001 when compared to MLP. The performance metric of random forest was further confirmed when analysis was done on the second dataset. It was observed that random forest performs best when trained and tested under the 10 folds cross validation. This therefore backs up the result of the first dataset analysis proving that random forest is not data specific.
5. Conclusion and Recommendations
Malicious applications has increasingly become sophisticated and complex with advancement in technological innovation. Models and methods for improved detection of such malware have been actively developed by various researchers in the field. The goal of this research study was to evaluate/appraise classification algorithms for malware in android detection. After the analysis in the WEKA domain, it was found that the performance metric of MLP was diminished with increased instances, making it dataset-specific. Random forest was found to perform better than the other algorithms with the first and second dataset when trained and tested under the 10 folds cross validation, having an accuracy of 99.3% and 98.9% respectively. Therefore, the contribution of this research is to determine that random forest is the best performing algorithm in the detection of Android malware. Random forest is being proposed for use as the classification algorithm when building an android application for the purpose of android malware detection.
Further studies can consider selecting the best features of the dataset through feature selection or optimization for better performance. Other classification techniques under the reinforcement and unsupervised learning can be trained and tested. The studies should consider using Random forest as the classification and detection algorithm when developing anti-malwares, so as to provide a safe space for android users.
Conflict of Interest
The authors declare no conflict of interest.
- O.E. Olorunshola, A.O. Oluyomi, “ANDROID APPLICATIONS MALWARE DETECTION: A Comparative Analysis of some Classification Algorithms,” in 2019 15th International Conference on Electronics, Computer and Computation, ICECCO 2019, Institute of Electrical and Electronics Engineers Inc., 2019, doi:10.1109/ICECCO48375.2019.9043284.
- E. Chin, A.P. Felt, K. Greenwood, D. Wagner, “Analyzing Inter-Application Communication in Android,” in Proceedings of the 9th international conference on Mobile systems, applications, and services, ACM: 239–252, 2011, https://doi.org/10.1145/1999995.2000018
- OS Timeline, Mobile operating system – Wikipedia, 2020.
- A. Developers, “What is android,” 2011,
- K.J. Abela, D.K. Angeles, J.R.D. Alas, R.J. Tolentino, M.A. Gomez, “An Automated Malware Detection System for Android using Behavior-based Analysis AMDA,” in International Journal of Cyber-Security and Digital Forensics (IJCSDF), Citeseer: 1–11, 2013.
- K. Nadia, The risks of third-party app stores, 2020.
- Ian Blair, Mobile App Download and Usage Statistics (2020) – BuildFire, 2020.
- P. Tracy, Smartphone Banking Definition & Example | InvestingAnswers, 2020.
- S. Verma, S.K. Muttoo, “An Android Malware Detection Framework-based on Permissions and Intents,” Defence Science Journal, 66(6), 618–623, 2016, DOI : 10.14429/dsj.66.10803.
- A.P. Felt, E. Ha, S. Egelman, A. Haney, E. Chin, D. Wagner, “Android Permissions: User Attention , Comprehension , and Behavior,” in Proceedings of the eighth symposium on usable privacy and security, ACM: 3, 2012, https://doi.org/10.1145/2335356.2335360.
- M. Vennon, “Android malware: Spyware in the Android Market,” Technical Report, SMobile Systems, 2010.
- G. Thompson, Android Malware Steals Data From Apps, Records Audio, Captures Screenshots – Binary Defense, 2020.
- Webroot, The Dangers of Hacking and What a Hacker Can Do to Your Computer | Webroot, 2020.
- Norton, Zero-day vulnerability: What it is, and how it works, 2020.
- S.Y. Yerima, Android malware dataset for machine learning 1 (Version 1), 2018, doi:https://doi.org/10.6084/m9.figshare.5854590.v1.
- J. Callaham, The history of Android OS: its name, origin and more, 2019.
- J. Alabaster, Android founder: We aimed to make a camera OS | PCWorld, IDG News Service, 2013.
- W. Bellevue, T-Mobile Unveils the T-Mobile G1 — the First Phone Powered by Android | T-Mobile Newsroom, 2008.
- Android version history, Android version history, Wikipedia, 2019.
- Android 10 | Android, 2019.
- M. Grace, Y. Zhou, Q. Zhang, S. Zou, X. Jiang, “RiskRanker: Scalable and Accurate Zero-day Android Malware Detection Categories and Subject Descriptors,” in Proceedings of the 10th international conference on Mobile systems, applications, and services, ACM: 281–294, 2012, https://doi.org/10.1145/2307636.2307663
- D. Kavinya, R.S. Priya, R. Deebika, “Vulnerabilities attacks on mobile operating systems ( Android versus iOS ): A review,” International Journal of Advance Research, Ideas and Innovations in Technology, 4(5), 214–216, 2018.
- Statista, Number of available applications in the Google Play Store from December 2009 to June 2019, Google Play Store: Number of Available Apps 2009-2019, 2019.
- W. Enck, M. Ongtang, P. McDaniel, “Understanding Android Security,” IEEE Security & Privacy, 7(1), 50–57, 2009, https://doi.org/10.1109/MSP.2009.26
- R. Sato, D. Chiba, S. Goto, “Detecting Android Malware by Analyzing Manifest Files,” Proceedings of the Asia-Pacific Advanced Network, 36(17), 23–31, 2013, http://dx.doi.org/10.7125/APAN.36.4.
- J. Networks, Juniper networks third annual Mobile threats report, 2013.
- Alexandre Mundo Alguacil, C. Beek, C. Castillo, T. Dunton, J. Fokker, S. Grobman, T. Hux, N. Minihane, L. Munson, E. Peterson, M. Rivero, T. Roccia, C. Schmugar, R. Samani, R. Sims, D. Sommer, B. Sun, McAfee Labs Threats Report: December 2018, 2018, doi:10.1016/s1361-3723(19)30004-1.
- M. Zhang, Y. Duan, H. Yin, Z. Zhao, “Semantics-Aware Android Malware Classification Using Weighted Contextual API Dependency Graphs,” in Proceedings of the 2014 ACM SIGSAC conference on computer and communications security, ACM: 1105–1116, 2014, https://doi.org/10.1145/2660267.2660359.
- C. Castillo, Android Malware Past , Present , and Future, 2011.
- S. Peng, S. Yu, A. Yang, “Smartphone malware and its propagation modeling: A survey,” IEEE Communications Surveys and Tutorials, 16(2), 925–941, 2014, doi:10.1109/SURV.2013.070813.00214.
- H. Gascon, F. Yamaguchi, D. Arp, K. Rieck, “Structural Detection of Android Malware using Embedded Call Graphs Categories and Subject Descriptors,” in Proceedings of the 2013 ACM workshop on Artificial intelligence and security, 45–54, 2013, https://doi.org/10.1145/2517312.2517315.
- L. Davi, A. Dmitrienko, A. Sadeghi, M. Winandy, “Privilege Escalation Attacks on Android,” in International conference on Information security, Springer, Berlin, Heidelberg: 346–360, 2010, https://doi.org/10.1007/978-3-642-18178-8_30
- F. Di Cerbo, A. Girardello, F. Michahelles, S. Voronkova, “Detection of malicious applications on android OS,” Lecture Notes in Computer Science (Including Subseries Lecture Notes in Artificial Intelligence and Lecture Notes in Bioinformatics), 6540 LNCS(January 2010), 138–149, 2011, doi:10.1007/978-3-642-19376-7_12.
- K.W.Y. Au, Y.F. Zhou, Z. Huang, D. Lie, “PScout: Analyzing the Android Permission Specification,” in Proceedings of the 2012 ACM conference on Computer and communications security, ACM: 217–228, 2012, https://doi.org/10.1145/2382196.2382222.
- A.P. Felt, E. Chin, S. Hanna, D. Song, D. Wagner, “Android Permissions Demystified,” in Proceedings of the 18th ACM conference on Computer and communications security, ACM: 627–637, 2011, https://doi.org/10.1145/2046707.2046779.
- F. Shang, Y. Li, X. Deng, D. He, “Android malware detection method based on naive bayes and permission correlation algorithm,” Cluster Computing, 21(1), 955–966, 2017, doi:10.1007/s10586-017-0981-6.
- W. Ali, “Hybrid Intelligent Android Malware Detection Using Evolving Support Vector Machine Based on Genetic Algorithm and Particle Swarm Optimization,” IJCSNS International Journal of Computer Science and Network Security, 19(9), September 2019.
- M. Kakavand, M. Dabbagh, A. Dehghantanha, “Application of machine learning algorithms for android malware detection,” ACM International Conference Proceeding Series, (February 2019), 2018, doi:10.1145/3293475.3293489.
- M. Shohel Rana, C. Gudla, A.H. Sung, “Evaluating machine learning models for android malware detection – A comparison study,” ACM International Conference Proceeding Series, (March 2019), 17–21, 2018, doi:10.1145/3301326.3301390.
- S.Y. Yerima, S. Sezer, G. Mcwilliams, I. Muttik, “A New Android Malware Detection Approach Using Bayesian Classification,” in 2013 IEEE 27th international conference on advanced information networking and applications (AINA), IEEE: 121–128, 2013.
- Z. Yuan, Y. Lu, Z. Wang, Y. Xue, “Droid-Sec: Deep Learning in Android Malware Detection,” in ACM SIGCOMM Computer Communication Review, ACM: 371–372, 2014, https://doi.org/10.1145/2619239.2631434.
- J.Y. Ndagi, J.K. Alhassan, “Machine learning classification algorithms for adware in android devices: A comparative evaluation and analysis,” in 2019 15th International Conference on Electronics, Computer and Computation, ICECCO 2019, Institute of Electrical and Electronics Engineers Inc., 2019, doi:10.1109/ICECCO48375.2019.9043288.
- G. Holmes, A. Donkin, I.H. Witten, “Weka: A machine learning workbench,” 357–361, 1994.
- S. Yerima, Android malware dataset for machine learning 2, 2018.
- J. Brownlee, Failure of Classification Accuracy for Imbalanced Class Distributions, 2020.
- J. Brownlee, ROC Curves and Precision-Recall Curves for Imbalanced Classification, 2020.
- Metacademy, F measure, 2020, Jun. 2020.
- Metacademy, Precision and recall, 2020.
- S. Glen, RMSE: Root Mean Square Error, StatisticsHowTo.com, 2020.
- S. Holmes, RMS Error, 2000.
- Y. Taguri, N. Gilboa, S. Gigi, I. Kober, A. Farhi, S. Awrabi, J. Freeman, Perceptrons & Multi-Layer Perceptrons: the Artificial Neuron – MissingLink, Dec. 2020.
- L. Breiman, “Random Forests,” Machine Learning, 45(1), 5–32, 2001.
- A. Liaw, M. Wiener, “Classification and Regression by randomForest,” R News, 2(3), 18–22, 2002.