Real-time Gradient-Aware Indigenous AQI Estimation IoT Platform
 , Abderrazak Abdaoui 1, Farid Touati 1, Mohammad Abdullah Al Hitmi 1, Damiano Crescini 2, Adel Ben Mnaouer 3
Adv. Sci. Technol. Eng. Syst. J. 5(6), 1666–1673 (2020);
 DOI: 10.25046/aj0506198
Environmental monitoring has gained significant importance in outdoor air quality measurement and assessment for fundamental survival as well as ambient assisted living. In real-time outdoor urban scale, instantaneous air quality index estimation, the electrochemical sensors warm-up time, cross-sensitivity computation-error, geo-location typography, instantaneous capacity or back up time; and energy efficiency are the six major challenges. These challenges lead to real-time gradient anomalies that effect the accuracy and pro-longed lags in air quality index mapping campaigns for state and environmental/meteorological agencies. In this work, a gradient-aware, multi-variable air quality sensing node is proposed with event-triggered sensing based on position, gas magnitudes, and cross-sensitivity interpolation. In this approach, temperature, humidity, pressure, geo-position, photovoltaic power, volatile organic compounds, particulate matter (2.5), ozone, Carbon mono-oxide, Nitrogen dioxide, and Sulphur dioxide are the principle variables. Results have shown that the proposed system optimized the real-time air quality monitoring for the chosen geo-spatial cluster (Qatar University).
1. Introduction
Living conditions or probability of life forms are dependent on environmental conditions, i.e. combination of gases, temperature, humidity, pressure, and light [1]. The quality of respiratory life processes is directly related to air quality at a particular geo-location [2]. Gradual deterioration in urban air quality is ambient each year due to the increasing population, chemical emissions from machinery, and depreciation in green ecology [3]. Air quality sustainability is a major concern in the age of imperialism [4] due to exponential development and construction density in the urban landscape.
An increase of 41% in the design and development of gas and pollutant sensing systems was observed in the environmental market since 2001 [5]. The top contributions AirNut, PA-I and PA-II, Egg, PATS+, and S-500, CairClip, Portable ASLUNG, AirSensEUR, Met One, AQY v0.5, Vaisala AQT410, 2B Tech, and AQMesh V3.0 systems had measurement capabilities in specific pollutants and gases presented in [6–8]. FIS SP-61 by FIS, O3-3E1F by CityTechnology, AirSensEUR v.2 by LiberaIntentio, and S-500 by Aeroqual, and AirSensEUR used a built-in AlphaSense OX-A431 limited to O3 [9–11]. The PMS1003 and PMS3003 by Plantower; DC1100 PRO and DC1700 by Dylos; OPC-N2 by AlphaSense had only sensing support for particulate matter (PM) [11–13]. The CO-3E300 by City Technology; CO-B4 by Alphasense, MICS-4515 by and SGX Sensortech, Smart Citizen Kit by Acrobotic and the RAMP had only abilities to measure carbon mono-oxide [4]. It illuminated the requirement of structure real-time sensor data processing framework for multiple gases sensing nodes with warm-up times below 5mins at ambient outdoor environmental conditions.
The top 10 environmental protection agencies (EPAs) unanimously agreed on the standard of four core gases for outdoor air quality [14] i.e. Ozone, Nitrogen Dioxide, Sulphur Dioxide, Carbon Monoxide, and two prime pollutants particulate matter PM2.5 and PM10. The concentration or ratio of four critical gases and air particles part per million (ppm) constitutes air quality index (AQI) is the fundamental design using Smart Rig [15]. The ratio of Ozone (O3), Sulphur Dioxide (SO2), Carbon Monoxide (CO), and Nitrogen Dioxide (NO2) are the standard gases discussed in major environmental standards for AQI [4,14,15]. A standard outdoor air quality node (O-AQN) was needed to measure discrete and cumulative AQI with minimum data processing and power consumption.
Related Works
The existing O-AQNs, Urban AirQ, Smart Citizen Kit, SeReNo V1, AirQ Mesh needed improvement in energy efficiency, GPS, time-series vector structuring, and remote data transmission to ensure dynamic air quality mapping [16–20].
1.1. Urban AirQ
The AirQ platform [17] by Vishal et al was a smart and cost-effective solution for air quality monitoring. It supported wireless data communication technologies including WiFi, 4G, Bluetooth, LoRa, etc. It was supported by non-embedded data management and the implementation of smart data analytics algorithms exhibited at an AirQ Dashboard and Smartphone App. It had a dependency on external hardware and software with more processing needs with only air quality sensors.
1.2. Smart Citizen Kit
The Smart Citizen Kit [18] by Gullien et al was dependent on an additional resource named “Smart Citizen Station”. Needed improvement in multi-variable time-series measurements and location accuracy, energy efficiency, and reduced data processing. Multi-variable sensing with simultaneous measurement of gases and environmental variables.
1.3. SeReNo V1
The Sensor Node (SeReNo) V1 [19] by Farid et al was the first node developed with indoor air quality monitoring and energy harvesting capabilities. SeReNo V2 presented in this work [20] is the improvement of [19] that needed to be upgraded with GSM and GPS, more Flash to perform AQI data processing needed for optimized energy efficiency, electrochemical gas sensors warm-up times, and outdoor air quality.
1.4. AirQ Mesh
The networked AirQ Mesh [21] by Nuria et al focused on the review and performance of existing AirQ platforms and their maximum utilization leading to credible results by EPA and Air Quality Directive (AQD). Data payloads were very high due to response time estimation errors leading to high storage requirements with energy challenges in the field were the gaps in the Nuria et al contribution.
Furthermore, the improvement potential in context-aware data processing model and thresholding for detection was discussed by Hasan et al in [22,23] for multi-sensor single-board node. The energy efficiency schemes were one major gap highlighted by [24]. The works Lebilium Waspmote [21] was Zigbee but needed GSM/GPRS support for outdoor sensing and have been more contributory if equipped with geo-spatial traces or cadastral layouts support for all the measured variables like AirBox [22]. An infrastructure embedded system was needed to accommodate the maximum sensing, minimum data processing, AQI estimation, and long-haul deployability [19–23].
2. Materials and Methods
This work proposed a smart AQM IoT system with three major components:
- The Real-time Gradient Aware Multi-Variable Sensing Model (GAM)
- The SeReNo V2 AQM Sensing Platform
- Real-time AQI Estimation Engine (AQM-EE)
First, we proposed the GAM and then the pillars of GAM led to the design and fabrication SeReNo V2 node.
3. The Real-time Gradient Aware Multi-Variable Sensing Model (GAM)
A real-time structured multi-variable structured data time-series vector was needed to proceed with AM. Let us consider an EPA standard outdoor air quality index (O-AQI) real-time variables as temperature T in centigrade, pressure P in pascals, humidity H in %, volatile organic compounds as VoC (ppm), particulate matter as PM (ug/m3), Ozone as O3 (ppm), Nitrogen Dioxide as NO2 (ppm), Carbon Monoxide as CO2 (ppm), and Sulphur Dioxide as SO2 (ppm). The real-time O-AQI data was proposed as a commutative time series multi-variable vector VO-AQI of two non-linear time-series with t1 and t2 of environmental E and gas G sensors data at a particular geo-location L given as:
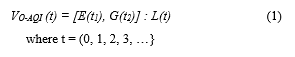
The practicality of response time of heterogeneous sensors was taken in account for non-linear time-series decomposition t, gas sensor response time t2 is greater than the response time of environmental sensors t1 with relationship t2 > t1 given as:
![]()
The environmental sensor variables function E for sensor array AE(T, P, H, VoC, PM) as E(AE, t1); and for gas sensors array AG(O3, NO2, SO2, CO) as G(AG, t2) and position vector L as reference function GPS using GSM network cell locations (using AT+CIPGSMLOC=1,1) for LGPRS and GPS module as LGPS (using AT+CGPSINF). For precise AQM the LGPS must belong to the slope of LGPRS1 and LGPRS2 in a particular slope format by NEMEA specifier for consecutive cells is given as:
![]()
The agreed LGPS was termed as L(t) where condition (3) was satisfied. From equations (1), (2), and (3) the finalized AQM vector of VO-AQI was derived as:
![]()
The transmission of this structured AQM vector can be power leeching. Here we introduce a gradient impact vector as a function of warm-up time tW, cross-sensitivity classifier CS, geo-location L(t), and energy efficiency EE. Three bounded value conditions we applied on GAM programmed in the SeReNo V2 firmware:
- The mandatory system unit to stay on is the power is the micro-controller with power consumption PM and at sleep mode, it has PM-SLEEP power with all the critical sensors active only.
- For EE the system has to have instantaneous power Pi varying between PM-SLEEP < Pi < PM.
- The tW had to be in the lower section of the curve of Pi. Likewise, at the constant magnitude of vector AE at tn and tn+1, the difference cross-sensitivities had to stay constant at a particular L(t).
4. The SeReNo V2 AQM Sensing Platform
A generic multi-variable AQM node consists of an EPA recommended sensors for VO-AQI based on equation (4), application-specific signal conditioning, power, and communication sections. The block diagram of a generic AQM node is given below in figure 1.
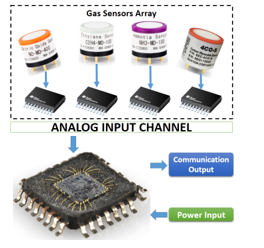
Figure 1: A Generic Multi-Variable AQM Sensing
In our previous works [14,15,19,20], we had filled the design gaps in indoor air quality monitoring and developed a multi-sensor AQM node called Sensors V1 revision 1 and revision 2 presented in figure 1. In this work, work proposed a novel O-AQM node by improving the system architecture of SeReNo V1 as SeReNo V2. In our recent work [24] we had developed SeReNo V2 nodes tested for long-haul autonomous operations of 1.5 years that were improved in this work. The existing SeReNoV2 node was improved with GAM and AQI-EE to meet the state of the art needs.
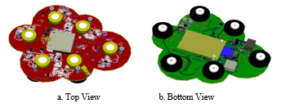
Figure 2: Two 3D Layouts of SeReNo V1 AQM Node
For outdoor AQM SeReNo V1 was improved to V2 as per global EPAs standards recommended sensors, energy harvesting long-range communication support. The comparison of major capabilities of SeReNo V1 and V2 is exhibited in the table below.
Table 1: SeReNo V1 and V2 Characteristics
| Blocks | SeReNo V1 | SeReNo V2 |
| Energy
Block |
PV and Manual Charging + LiPo Battery 3.7V / 1200mAh
+ 6 Thermo-Electric Generators |
Dual PV + Manual Charging |
| Communication
Block |
RF 433Mhz | GSM/GPRS |
| Sensors
Block |
6 Indoor Sensors Only interfaced with Analog Input | 10 Outdoor Sensors Networked with I2C
(4 Gas Sensors + 2 Pollutant Sensors + 4 Environmental Sensors) |
| Environmental
Sensors Block |
Absent | 4 Sensors |
| Controller Block | RFC200 | ATMega328P |
| Location
Block |
NIL | GPS |
| Local Display | NIL | Present |
| Energy Optimization | Partial | Full |
| Sensors Control | NIL | Present |
| Outdoor Cross Sensitivity | NIL | Present |
GAM was a core engine driving the multi-sensor O-AQM IoT system. Mathematically modeled design and equations (1~4) parameters are addressed in the hardware blocks. A 1-1 correspondence electronics and instrumentation system was designed SeReNo V2 presented in figure 3 presented below.
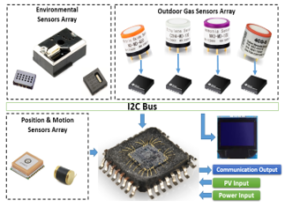
Figure 3: Block Diagram of SeReNo V2 AQM Node
Fig 3 contains three sets of sensors The PCB design and completely assemble functional O-AQM node is presented in figure 4 given below.
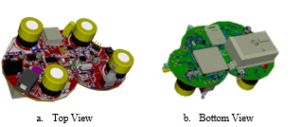
Figure 4: Two 3D Layouts of SeReNo V2 AQM Node
Three SeReNo V2 nodes with GAM and AQI-EE as improved firmware were deployed in QU for outdoor testing. The deployment was focused on the resolution of six key improvements mentioned in the abstract and literature review through proposed GAM and AQI-EE for six months, i.e. QU Greenhouse exhibited in figure 5 below.
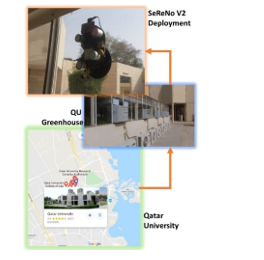
Figure 5: SeReNo V2 Deployment in QU to utilize the GAM
This deployment was for six months and all the data was collected from Ubidots IoT platform as CSV files for further processing. The first month was stability assessment of GAM and AQI-EE firmware and the remaining 5 months were the measurement campaign.
5. Real-time AQI Estimation Engine (AQM-EE)
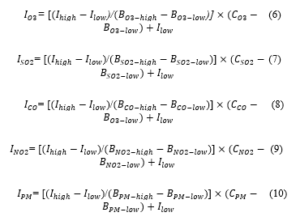
An AQI magnitude is estimated from 5 critical air variables or termed as pollutants, i.e. PM2.5, O3, NO2, SO2, and CO. The critical variable with the maximum AQI magnitude is termed as the “principle pollutant” and entire computation revolves around its significant figures among all the critical air variables. Let Ip be the index of the principal pollutant; Cp as the rounded-off concentration of pollutant p; BP-high as the breakpoint greater or equal to Cp; BP-low as the breakpoint less than or equal to Cp; Ihigh is the AQI corresponding to BP-high; Ilow is the AQI corresponding to BP-low. The AQI is generically estimated as:
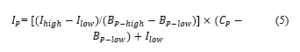
Every pollutant was formulated in using equation (5) and given by in equations (6 to 10).
Furthermore, the standard AQI evaluation template for a specific region provided by EEA as Common Air Quality Index (CAQI) and US EPA as AQI were adapted in this AQM-EE and given as a cumulative state chart given below in figure 6 and 7.
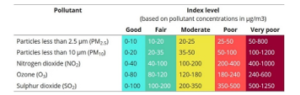
Figure 6: CAQI EEA AQI Cumulative State Chart
The SeReNo V2 was successfully able to give real-time AQI-EE estimations that have plenty of environmental, metrological, and health applications and significance.
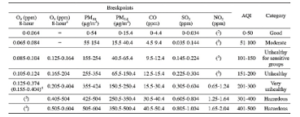
Figure 7: US EPA AQI Cumulative State Chart
The EPA rated sensors produced the results in thresholds of the chart in figure 6.
The AQM-EE uses 5 KPIs to evaluate the performance of GAM given as:
5.1. Energy Efficiency:
The instantaneous energy consumed by node EN for a minute is the sum of 60 secs for the product of supply voltage VDC, instantaneous current Ii, and time Ti given in equation 11.
![]()
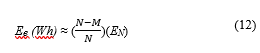
The difference between the maximum rated power consumption of node and minimum instantaneous power consumption in terms of watt-hour is termed as energy efficiency or E-Efficiency symbolized as Ee and given by:
5.2. Cross-Sensitivity Computation Error:
The cross-sensitivity computation error is the average of the total difference in a sensor’s reaction to other gases being measured.
![]()
It is used as the correction factor and must be in the range defined by the vendor.
5.3. Typo-graphic Error:
The difference in the GPS coordinates by GPS and AGPS was termed as typo-graphic or GPS error, presented in equation below:
![]()
The acceptable value for this error was marked as 20 meters for precise AQM.
5.4. The ratio of Magnitude EBAT/EN or Instantaneous Capacity:
The ratio of instantaneous system battery energy EBAT in watt-hour (Wh) and instantaneous node energy EN in watt-hour (Wh) was termed the instantaneous capacity magnitude CMAG of the node with current operations given as:
![]()
For long haul AQM, the CMAG must be greater than 1 to ensure at least 1-hour autonomous operation.
5.5. Improved Warm-Up Time of Gas Sensors:
The start-up warm-up time is mandatory for the gas sensors to acquire chemical equilibrium with the atmosphere in which they are used. The warm-up time was improved by putting all the micro-controller, GPS, and GSM modules to sleep and then get active based on the gradient as mentioned in section 3.
6. Results and Discussion
After the long haul deployment of six months, the data results obtained were displayed on the Ubidots IoT platform as exhibited in figure 7.
The eleven real-time variables were exhibited in Figure 8 sending data through GSM model QuecTel M10. The application of GAM enabled only meaningful data to be sent to the cloud that made time-series more non-linear as only gradients impacted values were being transmitted. The following plots of individual variables give more insights of GAM in SeReNo V2.
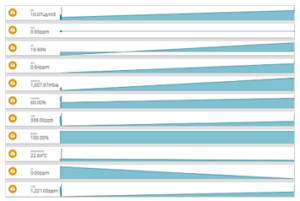
Figure 8: The SeReNo2 IoT Dashboard at Ubidots IoT
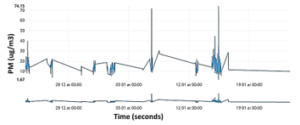
Figure 9: Illustration of Particulate Matter data due to GAM
Figure 9 explained the real-time measurement of PM from December 22, 2019, to January 22, 2020. The max of 74.15 µg/m3 was observed on January 17, 2020, and a minimum of 1.67 µg/m3 on December 27, 2019.
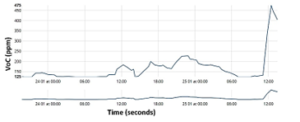
Figure 10: Illustration of VoC and Impact of GAM at 12:00 PM
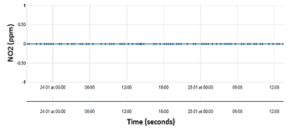
Figure 11: Illustration of Nitrogen Dioxide data due to GAM
In figure 10, it is ambient that amount of VoCs increased significantly due to day time traffic and air pollution in the atmosphere. This the special behavior common in all the days for 6 months.
In figure 11, it is eloquent that NO2 being extremely hazardous stayed zero and was transmitted to cloud whenever there was a signature of cross-sensitivity and time-series for NO2 was also non-linear.
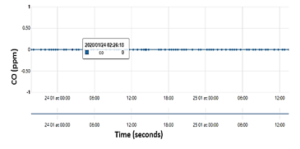
Figure 12: Illustration of Carbon Monoxide data due to GAM
In figure 12, it was observed that CO being hazardous was also observed as a non-linear time-series and the same as NO2 had cross-sensitivity signatures.
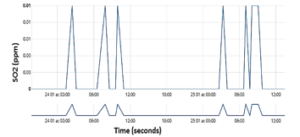
Figure 13: Sulphur Dioxide Signatures in Atmosphere
In figure 13, nominal magnitudes of SO2 were observed in the atmosphere due to plenty of gas processing plants that flare H2S and rest is preserved by Sulphur recovery units (SRUs).
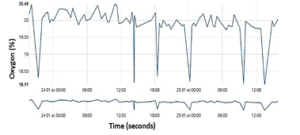
Figure 14: Presence of Oxygen Traces in Air
The SeReNo V2 node was initially equipped with an O2 sensor that was later on replaced by the O3 sensor for 2 years. The breathing conditions were favorable due to the measured average of 19.3 O2 in the air as obvious from figure 14.
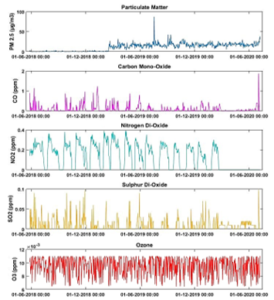
Figure 15: SeReNoV2 Total Deployment Data for EPAs recommended measurement
The first deployment of the SeReNoV2 node was 1.5 years to validate the autonomous operational capabilities as presented in figure 15 at the maximum sampling rate for pollutants and outdoor gases. This deployment was from June 1, 2018, to January 1, 2020.
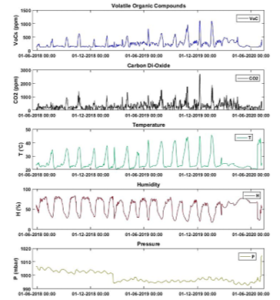
Figure 16: SeReNoV2 Total Deployment Data for EPAs Environmental Variables
In figure 16, the core 5 environmental variables, VoC, CO2, temperature, humidity, and pressure can be observed during the entire deployment tenure.
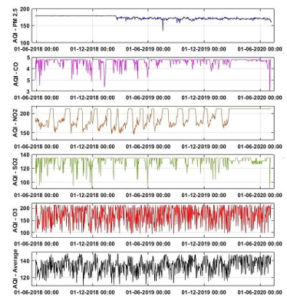
Figure 17: SeReNoV2 Estimation of real-time Discrete and Cumulative AQI
The AQI-EE key performance indicators (KPIs) were estimated for the programmed GAM on SeReNo V2 were the major contributions that enabled all the outcomes presented in figures 17 to 19. 80 meters typographic error can be observed in figure 18.
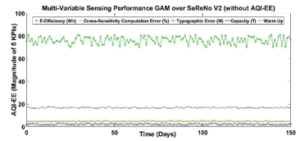
Figure 18: The GAM without AQI-EE KPIs for 5 months
The warm-up time of 18 minutes of electrochemical gas sensors was due to the average humidity of 63%. The warm-up time of electrochemical gas sensors is ideally 2 to 7. The cross-sensitivity error of 5% is normal. The Ee is near 0.8~1% is due to the extremely low power design on SeReNoV2.
The AQI-EE KPIs for GAM efficiency on SeReNo V2 can be observed in these recent 6 months deployment with 5 months of KPI assessment. The correlation of GPS and AGPS minimized typographic error to 3.5 meters. The cross-sensitivities error was also reduced to 2.7~4.8%. The Ee is aligned with the electrochemical gas sensors’ operational instances. The capacity has improved to 1.4%. A significant reduction in warm-up times was observed due to the PM-SLEEP variable. Lastly, the measure data size with respect to power energy efficiency was mapped and significant amounts of data were observed even at very low power consumption as a landmark for future research.
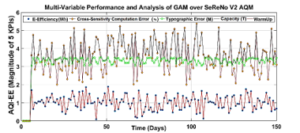
Figure 19: The GAM KPIs for SeReNo V2
7. Conclusion
A gradient-ware urban air quality index estimation multi-variable sensing IoT system was developed. The existing SeReNoV2 nodes were improved with the proposed system. The gradient-aware model and air quality estimation engine contributed to a significant and noticeable reduction in data processing for real-time AQI computation, electrochemical sensors warm-up times, cross-sensitivity errors, geo-location typographic-errors, and improved energy efficiency. The results can be summarized in four key milestones for accurate estimation of urban AQI estimation: 1) implemented gradient-aware sensing model as non-linear time series vector compensating the commutative anomalies in gases and environmental variables measurements; 2) the energy efficiency mechanism was able to keep the node up for 1.5 years constantly without any external charging source; 3) reduced warm times due to the proposed instantaneous power condition, and 4) precise estimation of AQI recommended air quality chart principal parameters. These novel air quality system results demonstrated the potential to handle redundancy in sensing time-triggers and non-linear timers as well.
Conflict of Interest
The authors declare no conflict of interest.
Acknowledgment
This publication was made possible by NPRP grant # 10-0102-170094 from the Qatar National Research Fund (a member of Qatar Foundation). The statements made herein are solely the responsibility of the authors.
- I.F. Akyildiz, W. Su, Y. Sankarasubramaniam, E. Cayirci, “A survey on sensor networks,” IEEE Communications Magazine, 40(8), 102–114, 2002, doi:10.1109/MCOM.2002.1024422.
- M. Abderrahim, H. Hakim, H. Boujemaa, F. Touati, “A Clustering Routing based on Dijkstra Algorithm for WSNs,” in 2019 19th International Conference on Sciences and Techniques of Automatic Control and Computer Engineering (STA), 605–610, 2019, doi:10.1109/STA.2019.8717279.
- M. Vinyals, J.A. Rodriguez-Aguilar, J. Cerquides, “A Survey on Sensor Networks from a Multiagent Perspective,” The Computer Journal, 54(3), 455–470, 2011, doi:10.1093/comjnl/bxq018.
- F. Touati, H. Tariq, M.A. Al-Hitmi, A. Ben Mnaouer, A. Tahir, D. Crescini, “IoT and IoE prototype for scalable infrastructures, architectures and platforms,” International Robotics & Automation Journal, 4(5), 319–327, 2018, doi:10.15406/iratj.2018.04.00144.
- M. Abderrahim, H. Hakim, H. Boujemaa, F. Touati, “Energy-Efficient Transmission Technique based on Dijkstra Algorithm for decreasing energy consumption in WSNs,” in 2019 19th International Conference on Sciences and Techniques of Automatic Control and Computer Engineering (STA), 599–604, 2019, doi:10.1109/STA.2019.8717210.
- P. Temdee, R. Prasad, Communications for Context-Aware Applications, 65–96, 2018, doi:10.1007/978-3-319-59035-6_4.
- F. Touati, H. Tariq, D. Crescini, A.B. Manouer, “Design and Simulation of a Green Bi-Variable Mono-Parametric SHM Node and Early Seismic Warning Algorithm for Wave Identification and Scattering,” in 2018 14th International Wireless Communications & Mobile Computing Conference (IWCMC), 1459–1464, 2018, doi:10.1109/IWCMC.2018.8450277.
- N. Zaghdoud, W.H. Alouane, H. Boujemaa, F. Touati, “Secure Performance of AF and DF Relaying in Cooperative Noma Systems,” in 2019 19th International Conference on Sciences and Techniques of Automatic Control and Computer Engineering (STA), 614–619, 2019, doi:10.1109/STA.2019.8717242.
- H. Taheri, P. Neamatollahi, O.M. Younis, S. Naghibzadeh, M.H. Yaghmaee, “An energy-aware distributed clustering protocol in wireless sensor networks using fuzzy logic,” Ad Hoc Networks, 10(7), 1469–1481, 2012, doi:https://doi.org/10.1016/j.adhoc.2012.04.004.
- H. Lin, D. Bai, D. Gao, Y. Liu, “Maximum data collection rate routing protocol based on topology control for rechargeable wireless sensor networks,” Sensors, 16(8), 2016, doi:10.3390/s16081201.
- M. Abderrahim, H. Hakim, H. Boujemaa, F. Touati, “Multihop transmission strategy using dijkstra algorithm to improve energy efficiency in WSNs,” in Lecture Notes in Computer Science (including subseries Lecture Notes in Artificial Intelligence and Lecture Notes in Bioinformatics), Springer International Publishing: 97–107, 2018, doi:10.1007/978-3-030-02849-7_9.
- T. Khan, M.A. Shah, K. M., “Communications, Applications, Technology and Beyond: A Surveyon Smart Grid,” Sindh University Research Journal-SURJ, 48(3), 651–656, 2016.
- H. Tariq, A. Tahir, F. Touati, M.A.E. Al-Hitmi, D. Crescini, A. Ben Manouer, “Geographical area network-structural health monitoring utility computing model,” ISPRS International Journal of Geo-Information, 8(3), 2019, doi:10.3390/ijgi8030154.
- U. Asghar, F. Touati, D. Crescini, A. Galli, A. Ben Mnaouer, “Development of Highly Efficient Multi-invariable Wireless Sensor System Design for Energy Harvesting,” 2018.
- A. Abdaoui, F. Touati, H. Tariq, A. Ben Mnouar, “A smart rig for calibration of gas sensor nodes: Test and deployment,” DTS 2020 – IEEE International Conference on Design and Test of Integrated Micro and Nano-Systems, (i), 18–20, 2020, doi:10.1109/DTS48731.2020.9196182.
- H. Luo, W. Li, X. Wu, “Design of indoor air quality monitoring system based on wireless sensor network,” IOP Conference Series: Earth and Environmental Science, 208, 12070, 2018, doi:10.1088/1755-1315/208/1/012070.
- V. Choudhary, J.H. Teh, V. Beltran, H.B. Lim, “AirQ: A Smart IoT Platform for Air Quality Monitoring,” in 2020 IEEE 17th Annual Consumer Communications & Networking Conference (CCNC), 1–2, 2020, doi:10.1109/CCNC46108.2020.9045550.
- G. Camprodon, Ó. González, V. Barberán, M. Pérez, V. Smári, M.Á. de Heras, A. Bizzotto, “Smart Citizen Kit and Station: An open environmental monitoring system for citizen participation and scientific experimentation,” HardwareX, 6, e00070, 2019, doi:https://doi.org/10.1016/j.ohx.2019.e00070.
- F. Touati, C. Legena, A. Galli, D. Crescini, P. Crescini, A. Ben Mnaouer, “Environmentally powered multiparametric wireless sensor node for air quality diagnostic,” Sensors and Materials, 27(2), 177–189, 2015, doi:10.18494/sam.2015.1056.
- H. Tariq, A. Abdaoui, F. Touati, M.A.E. Al-Hitmi, D. Crescini, A.B. Mnaouer, “An Autonomous Multi-Variable Outdoor Air Quality Mapping Wireless Sensors IoT Node for Qatar,” in 2020 International Wireless Communications and Mobile Computing (IWCMC), 2164–2169, 2020, doi:10.1109/IWCMC48107.2020.9148392.
- N. Castell, F.R. Dauge, P. Schneider, M. Vogt, U. Lerner, B. Fishbain, D. Broday, A. Bartonova, “Can commercial low-cost sensor platforms contribute to air quality monitoring and exposure estimates?,” Environment International, 99, 293–302, 2017, doi:https://doi.org/10.1016/j.envint.2016.12.007.
- H. Tariq, F. Touati, M.A.E. Al-Hitmi, D. Crescini, A.B. Manouer, “Design and Implementation of Information Centered Protocol for Long Haul SHM Monitoring,” in 2019 IEEE International Conference on Design & Test of Integrated Micro & Nano-Systems (DTS), 1–7, 2019, doi:10.1109/DTSS.2019.8915286.
- H. Tariq, F. Touati, M.A.E. Al-Hitmi, D. Crescini, A. Ben Mnaouer, “A real-time early warning seismic event detection algorithm using smart geo-spatial bi-axial inclinometer nodes for Industry 4.0 applications,” Applied Sciences, 9(18), 1–25, 2019, doi:10.3390/app9183650.
- A. Abdaoui, S.H.M. Ahmad, H. Tariq, F. Touati, A.B. Mnaouer, M. Al-Hitmi, “Energy Efficient Real time Outdoor Air Quality Monitoring System,” in 2020 International Wireless Communications and Mobile Computing (IWCMC), 2170–2176, 2020, doi:10.1109/IWCMC48107.2020.9148229.