
Elasticity Based Med-Cloud Recommendation System for Diabetic Prediction in Cloud Computing Environment
Volume 5, Issue 6, Page No 1618-1633, 2020
Author’s Name: Karamath Ateeq, Manas Ranjan Pradhana), Beenu Mago
View Affiliations
School of Information Technology, Skyline University College, Sharjah, UAE
a)Author to whom correspondence should be addressed. E-mail: manas.pradhan@skylineuniversity.ac.ae
Adv. Sci. Technol. Eng. Syst. J. 5(6), 1618-1633 (2020); ![]() DOI: 10.25046/aj0506193
DOI: 10.25046/aj0506193
Keywords: Diabetes, Data Mining, Cloud Computing, Medical Cloud, Prediction, Fuzzy Clustering, Neural Network, Genetic Algorithm, Recommendation System

Export Citations
Day to day huge medical data have been accumulating for diabetic diseases. The complexity of storing, processing ,analyzing and predicting the data related to diabetics is not so easy for healthcare professionals .The prediction of accurate results also has the limitation due to scale of data increasing worldwide for patients, symptoms and test results .In this paper ,it has been tried to considered the diabetic related data storage on cloud and adopt integrated computational algorithms of datamining for better prediction system to various diabetic types(Type 1, Type 2 and Gestational).Though many computational prediction model and recommended system have been proposed by many researchers ,the proposed model has the novelty of considering the elasticity in data analysis due to frequent data changes of patients due to diabetic test time to time. In this work, Elasticity based Med-Cloud Recommendation System (EMCRS) is proposed for predicting the diabetic disease types and providing recommendations for the patients diagnosed with diabetes. Moreover, elastic resource allocation mechanism is proposed to provide cloud resources an on-demand basis to EMCRS.Various computational algorithms have been used for different proposed to make EMCRS to predict results as compared other existing system. The Adaptively Toggle Genetic Algorithm (ATGA) is applied for elastic resource allocation while increase in the number of data sets. ATGA has taken toggle genetic algorithm that shifts between Roulette Wheel Selection Operator. Hybrid Classification and Clustering Algorithm (HC2A) is used for classifying and clustering the diseased patients as Type 1, Type 2 and Gestational Diabetic patients. Fuzzy C Means clustering based attribute weighting (FCMAW) was used for classifying the diabetic data set. The accuracy of the system tested on Pima Indian Diabetic Dataset (PID) and US Diabetic Dataset (USD) from UCI website which is approximately 98% classification accuracy.
Received: 14 August 2020, Accepted: 05 November 2020, Published Online: 25 December 2020
1. Introduction
Diabetes is a chronic disease that begins with the failure of pancreas. The pancreas fails to produce sufficient insulin required by the body [1]. The internal changes prompt to an increased concentration of glucose in the blood. It is a condition of high blood glucose level in diabetic patients. It can cause either Type I or Type II diabetes. Type I is known as insulin dependent diabetes, which occurs when there is lack of insulin production. Type II diabetes is non-insulin dependent which is caused by the ineffective use of insulin by human body. This will result in excess
body weight and physical inactivity. An earlier prediction or recommendation system is needed to save the patients from the risk of diabetes. In such a condition, Data Mining is suggested and found to be a better diagnostic tool which can be used by the medical practioners too.
Data Mining is the process of selecting, exploring and modeling large amounts of data [2], [3]. This process has become an increasingly pervasive activity in all areas of medical science research. Data mining has resulted in the discovery of useful hidden patterns from massive databases. Consequently, data mining tools are now being used for clinical data. The bottle neck
in data analysis is now raising the most appropriate clinical questions and using proper data and analysis techniques to obtain clinically relevant answers [4]. But as the accumulated data is increasing abundantly, Data Mining algorithm alone is not enough to retrieve hidden pattern from the data.
In order to improve the existing algorithm performance, the computing and storage resources are insufficient in traditional data mining environment. In order to overcome the resource challenges, now day’s resources are utilized on-demand elastic manner with the development of Cloud Computing [5]. National Institute of Standards and Technology (NIST) defines [6] “Cloud Computing is a model for enabling convenient, on-demand network access to a shared pool of configurable computing resources (eg., networks, servers, storage, applications, and services) that can be rapidly provisioned and released with minimal management effort or service provider interaction”.
The main features of cloud computing are on-demand self-service, broad network access, resource pooling, rapid elasticity and measured service. Cloud computing has three service models such as Infrastructure as a Service (IaaS), Platform as a Service (PaaS) and Software as a Service (SaaS). It also has four deployment models such as public cloud, private cloud, hybrid cloud and community cloud. Elasticity is used to utilizing the cloud computing resources (Storage, Virtual machines, Servers, Platforms, network) in an elastic way based on the workload requirement. Elasticity manages the ability to increase or decrease the cloud system resources. Elasticity is defined by NIST [7], “Rapid elasticity: Capabilities can be elastically provisioned and released, in some cases automatically, to scale rapidly outward and inward commensurate with demand. To the consumer, the capabilities available for provisioning often appear to be unlimited and can be appropriated in any quantity at any time.”
Elastic resource allocation is completed with the help of proper workload prediction and scheduling which are used to improve the performance of the cloud system. There are no existing algorithms that focus on workload prediction with elasticity in cloud computing environment [8]-[10].
In this research work, an Elastic Medical Cloud Recommendation System is proposed for diabetic classification, where Adaptively Toggle Genetic Algorithm is applied for the Elastic Resource Allocation. HC2A is involved to classify the diabetes patients and in case of diseased patients, they are clustered into three types and the recommendation system is suggested based on the cluster.
The remaining work of the paper is formed as follows. Related works are presented in section 2. In section 3, the proposed algorithm is explained. Results and discussions are presented in section 4. Section 5 shows the conclusion and future directions of the work.
2. Related Works
One of the important feature in cloud computing is elasticity which provides resources in an on-demand elastic manner for cloud users and providers. In [11]the authors concentrated energy consumption in cloud computing resources with the support of elasticity. In [12] the authors designed a CBIHCS (Cloud Based Intelligent Health Care Service) for supervising user health data for diabetic detection and proposed simple heuristic for dynamic resource elasticity.
Resource scaling methods are explained by in [13] based on the queuing models. It contains database level, application level and storage level. Each levels were analyzed with the parameters such as throughput, resource utilization rate and response time. Based on the results to scale applications in cloud environment, they recommended the elastic cloud resource allocation algorithm. In [14] authors proposed an improvised genetic approach for effective cloud resource allocation by maintaining vertical elasticity in cloud IaaS environment. They concentrated on vertical elasticity which focuses virtual machines allocation on cloud servers based on the workloads to improve resource allocation. The Enhanced Genetic algorithm concentrated only on cloud IaaS environment.
In [15], the scaling techniques of elastic resource management were classified as reactive or predictive imminent. Based on the workload requirements the system react without pre-planning in reactive imminent. In predictive imminent, the workload predicts the requirement of cloud servers that are allocated to handle the workload. In [16] it is proposed a cloud based framework with minimum resource setting for monitoring and diagnosis the PD (Parkinson’s Disease). The framework used cloud database, voice data and FBANN (Feedforward Backpropagation based Artificial Neural Network) classifier in cloud platform.
The role played by evolutionary algorithms and Clustering algorithms in Medical Data Mining is incredible. K means algorithm was used in [17] to remove noisy data and Genetic Algorithm was applied to find the optimal set of features. Finally Support Vector Machine (SVM) was used for classifying the diabetic patients. The proposed method has obtained an accuracy of about 96.71%. Fuzzy C Means Algorithm (FCM) [18] was used to determine the small clusters in Diabetic data set and Outlier detection method was applied for classification. The accuracy was 93%. Attribute Weighting method [19] called Fuzzy C Means clustering based attribute weighting (FCMAW) was used for classifying the diabetic data set. This method reduced the variance within the attributes and improves the classification accuracy. It was done by transforming the non-linear separable datasets to linearly separable datasets. FCM was applied to find the center of the attributes and the dataset is weighted according to the ratios of the means of attributes to centers of theirs attributes. Then SVM and KNN classifiers were applied to classify the dataset. The accuracy of the method was 84.38%.
3. Proposed Work
3.1. The system design
In order to get maximum benefit from cloud computing, Cloud providers designed the architecture and deployment model. Various cloud architectures are designed by different cloud service providers. The conceptual diagram of cloud architecture is shown in Figure 1. Cloud service providers provide services to cloud users through internet and datacenter. Cloud servers contains memory utilization vector, processing unit and storage. Virtualization in cloud is to run multiple VMs on a single server and sharing these cloud resources among multiple cloud users. Based on the workloads, the VMs are allocated to process the data as per the command of elastic resource manager.
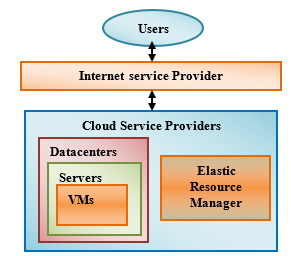
Figure 1: Conceptual diagram of Cloud Computing Architecture
In this work, the task of the ERM (Elastic Resource Manager) has been concentrated with the goal of elastic resource allocation for improving the resource utilization. ERM is responsible for VMs scheduling, Monitoring VMs and Workloads. Figure 2 explains the proposed framework of EMCRS and Figure 3 explains the flows of the proposed EMCRS for diabetic disease prediction.
3.2. The Elastic Resource Manager
The Elastic Load Manager task is to generate the schedule for the allotment of VM to the available cloud servers with the objective to improve the resource utilization. VM handler is responsible for handling VM queue which contains the user requests information. The scheduling algorithm brings the user request from VM queue and assigns it to the scheduler.
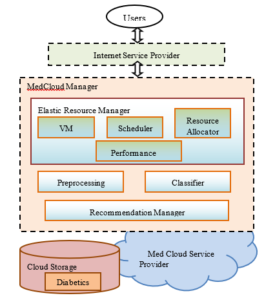
Figure 2: Framework for Elasticity based Med-Cloud Recommendation System
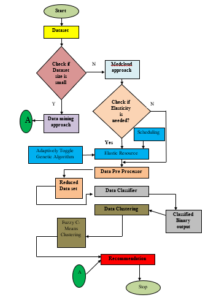
Figure 3: The EMCRS for predicting Diabetes
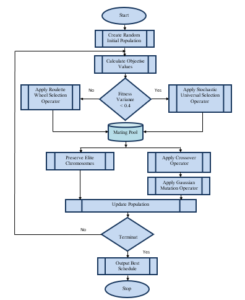
Figure 4: The flow of Adoptively Toggle Genetic Algorithm
3.3. Pseudocode of ATGA (Adaptively Toggle Genetic Algorithm)
Step 1: Begin
Step 2: Generate initial population with randomly generated chromosomes
Step 3: Calculate the objective Values for each chromosome in the current population
Step 4: Observe the fitness distribution of current population based on the fitness variance
Step 5: If the fitness variance is below 0.4
Step 6: Apply the Stochastic Universal Sampling Selection operator
Step 7: Else
Step 8: Apply the Roulette Wheel Selection operator
Step 9: End If
Step 10: Store the parent chromosomes in mating pool
Step 11: Store the best chromosomes from the current population as elite chromosomes
Step 12: Apply the crossover operator for generating offspring chromosomes
Step 13: Apply the Gaussian mutation operator to adaptively mutate genes
Step 14: Update the current population with the offspring chromosomes
Step 15: If termination condition is not reached
Step 16: Go to Step 3
Step 17: Else
Step 18: Output Best Chromosome
Step 19: End If
Step 20: End
3.3.1. Flow chart Adaptively Toggle Genetic Algorithm
The flow chart of adaptively toggle genetic algorithm is presented in figure 4.
3.3.2. Working Principle of Adaptively Toggle Genetic Algorithm
Even though it is a successful tool, many phenomena can affect the performance of Genetic Algorithm and such an important factor is the parameter settings of Genetic Algorithm. Most of the existing research works related to Genetic Algorithm were carried out with static parameter settings. But, inherently the Genetic Algorithm supports self-learning, parallelism and dynamism. Hence, this research work got the insight to improve the Genetic Algorithm by utilizing the adaptive nature of genetic operators. The core idea behind the development of the proposed Adaptively Toggle Genetic (ATG) algorithm is that to intelligently manipulate the selector operator and to adaptively control the mutation operator in order to enhance the performance of the algorithm. So, the two key operations of the proposed ATG algorithm are as follows.
• Toggle the selection operator
• Adaptively change the mutation probability
3.3.2.1. Toggle the selection operator
As selection operator is one of the crucial operators for the convergence of the Genetic Algorithm, the selector operator must be careful chosen and designed in order to make the best individuals to be survived in the successive generations. Various selection operators are already available, but the before applying the selection operators, the characteristics and suitability of them must be analyzed. In this research work, two selection operators are taken namely, roulette wheel selection and stochastic universal sampling selection operators. Though roulette wheel selection operator is the most commonly used selection operator in Genetic Algorithm, it fails when the fitness values of chromosomes in the population are highly scattered. This is due to the state that the high portion of the roulette wheel is assigned to the fittest chromosome where all the other chromosomes only obtain least sectors of the wheel. Therefore, the roulette wheel may provide biased output and it may lead to the premature convergence state. Hence, the proposed ATG algorithm calculates the fitness variance of the population at first and then it determines which selection operator to use at the current iteration of the algorithm. If the fitness variance is high the stochastic universal sampling selection is used, otherwise the roulette wheel selection is used. In this way, the proposed ATG algorithm intelligently toggles between the two selection operators and helps to conquer the premature convergence problem.
3.3.2.2. Adaptively change the mutation probability
The main task of the mutation operator is to provide exploitation in the search space. Further, it can also help to promote the gene diversity in the gene population. But, when the value of mutation probability is set as a constant, it may disturb the solutions in the global convergence state. Thus, the mutation probability value must be changed according to the convergence state of the algorithm. Hence, the mutation probability value in the proposed ATG algorithm is calculated based on the Gaussian curve as a function of the current iteration. In this way, the proposed ATG algorithm can escape from the local optima by adaptively changing the mutation probability value.
Therefore, the two frequent problems associated with Genetic Algorithm namely the local optimum and premature convergence are eliminated by the proposed ATG algorithm through the dynamic switching between selection operators and adaptive control of mutation operator with additional benefits. With help of ATG algorithm, the scheduler optimally allocates the virtual machines for processing the user requests. The user queries are processed for performing the classification task using the proposed HC2A algorithm.
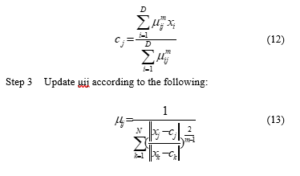
3.4. Proposed Algorithm for Classification
The HC2A is proposed to classify the diabetic patient data set. The Framework works in three phases as Pre-Processing Phase, Classification Phase and Clustering Phase. Figure 5 explains the flow of the proposed HC2A, In the Pre-Processing Phase, the Genetic-Relative Reduct (G-RR) Algorithm is applied to remove the noisy data and eliminate the irrelevant data. The output at this phase will be the reduced data set. The attributes are classified as Conditional and Decision Attributes. At the initial state the variable R is initialized to null value. And the variable best is assigned to 0. The best value is stored temporarily in another variable tmp and R is stored in T.
The consistency of the data set is checked after removing every attributes. If the decision table is consistent, the attributes is removed and the reduced data set is stored. If the classification accuracy of the Conditional Attributes obtained is greater than the classification accuracy of the Decision attributes (RU(X) (C)>X(D)), then the first Generation of Offspring is constructed. The obtained attributes are selected and then mutation and crossover operations taken place.
Input: Diabetic Data Set
Step 1 Start
Step 2 Load Diabetic dataset
Step 3 Initialize the parameters ( R, ) )
Step 4 Call Genetic – Relative Reduct Algorithm
Step 5 Check for Reduced Data set
Step 6 If the data set is reduced
Go to Step 7
else
Go to step 3
Step 7 Initialize the attributes
Step 8 Apply Modified Particle Swarm Optimization – Neural Network Algorithm
Step 9 Check for maximum number of epoch
Step 10 Calculate error and accuracy
Step 11 If the error is minimized
Go to Step 12
else
Go to step 7
Step 12 Apply Fuzzy C Means Clustering Algorithm
Step 13 Check if the output is clustered and ready to suggest the recommendation system
Step 14 If the clustered output is ready
Go to step 15
Else
Go to step 12
Step 15 Stop
Output: Clustered output for the recommendation system
The obtained Reduct set is stored in T. The Decision Attributes which are best are stored in the variable best . The obtained reduced set is stored in R. The process goes on repeating until the optimal data set is obtained. The obtained output is Reduct Set R. After obtaining the optimal data set, the algorithm terminates.
Step 1: Start
Step 2: R=
Step 3: best = 0
Step 4: do
Step 5: tmp = best
Step 6: T=R
Step 7: for x in (C-R)
Step 8: If RU(X) (C)>X(D)
Step 9: Construct the First Generation
Step 10: Selection
Step 11: Crossover
Step 12: Mutation
Step 13: T=RU{X}
Step 14: best = c(D)
Step 15: R=T
Step 16: Until best == tmp
Step 17: Return R
Step 18: end
The next phase is classification phase. In this phase, Modified Particle Swarm Optimization – Neural Network (MPSO-NN) Algorithm is employed to classify the dataset. This phase optimizes the reduced data set and classifies it.
Step 1: Initialize the population
Step 2: Evaluate the fitness of the attribute
Step 3: For each attribute, find the maximum fitness and compare it with the best found so far
Step 4: Pbesti is equal to the location of maximum fitness function
Step 5: Compare Fitness evaluation with population overall Pbest
Step 6: If particle best is greater than gbest, then reset gbest(i) is equal to the current Pbest’s array index and value
Step 7: Calculate Convergence factor
Step 8: Calculate Inertia weight
Step 9: Update velocity and position and new population is generated
Step 10: Adjust acceleration
Step 11: If the data set is optimized
Go to Step 12
else Go to Step 2.
Step 12: Choose the initial weight
Step 13: If the error is minimum
Go to step 21
else
Go to Step 14
Step 14: Apply the optimized dataset to the network
Step 15: Calculate output for every neuron through hidden layer(s) to output layer
Step 16: Calculate Error value at the output layer
Step 17: Update the weight and bias at the output layer
Step 18: Calculate the Error value at the hidden layer
Step 19: Update the weight and bias at the hidden layer
Step 20: Check if the maximum number of epochs reaches
If yes
Go to Step 21
else
Go to Step 14
Step 21 Evaluate the network performance
Step 22: Classified output
At the preliminary stage, the population is initialized and the fitness of the population is calculated. The maximum fitness of each particles is compared with the best found so far as given in (1).
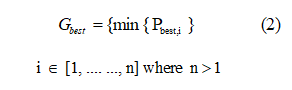
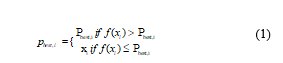 The Pbesti obtained will be equal to the location of the maximum fitness function. The fitness evaluation is then compared with the population’s overall best as in (2).
The convergence factor is calculated as
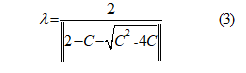 where C=C1-C2
C1 is the cognitive learning parameter and C2 is the social collaboration parameter. The C1 and C2 always lie between 0 and 2. Then the inertia value is calculated as given in (4). The inertia value provides the balance between the exploration and exploitation. Generally, the inertia value lies between 0.8 and 1.2. Lower value of inertia component speeds up the convergence of swarm to optima. Higher values encourage the exploration of entire search space.

After the reduced data set is optimized, then the optimized data set is fed as input to Multi-Layer Perceptron Network. Back propagation learning is used to train the network. The output for very neuron is calculated in the hidden unit and output unit. It is calculated as
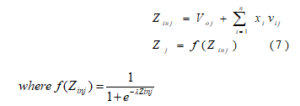
The sigmoid activation function is applied in every layer. The number of neurons in the hidden layer is fixed by
![]()
where Nh is the number of hidden neurons in the hidden layer. Ni and No represent the number of neurons in the input layer and output layer. The error at the output layer is calculated using (9) and the weight and bias are updated using (10).
![]()
![]()
If the maximum number of epochs is reached and the error is minimized the training process is stopped, and the classified output and results are taken. The final output from this framework will be classified as binary output 0 or 1.
In Clustering Phase, the data with value 0, that is the non-diabetic patients are ignored and the diabetic patients with binary value 1 is again clustered using FCM to cluster the diabetes patients into three types as Type 1, Type 2 and Gestational Diabetes. Fuzzy C-Means (FCM) is a clustering method that allows each data point to belong to multiple clusters with varying degrees of membership. The objective function to minimize the FCM is:
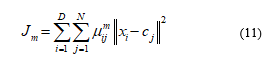
where
D is the number of data points.
N is the number of clusters.
m is fuzzy partition matrix exponent for controlling the degree of fuzzy overlap, with m > 1. Fuzzy overlap refers to how fuzzy the boundaries between clusters are, that is the number of data points that have significant membership in more than one cluster.
xi is the ith data point.
cj is the center of the jth cluster.
μij is the degree of membership of xi in the jth cluster. For a given data point, xi, the sum of the membership values for all clusters is one.
FCM performs the following steps during clustering:
Step 1 Randomly initialize the cluster membership values, μij.
Step 2 Calculate the cluster centers:
Step 4 Calculate the objective function, Jm.
Step 5 Repeat steps 2–4 until Jm improves by less than a specified minimum threshold or until after a specified maximum number of iterations.
Table 1: Confusion matrix for MPSO-ANN – PID
| 0 | 1 | |
| 0 |
558 72.66 |
80 10.42 |
| 1 |
60 7.81 |
70 9.11 |
Table2: Confusion matrix for GA-RR+MPSO-ANN- PID
| 0 | 1 | |
| 0 |
612 79.69 |
40 5.99 |
| 1 |
50 6.51 |
60 7.81 |
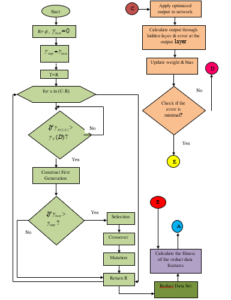
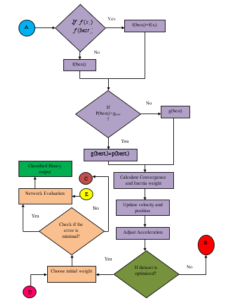
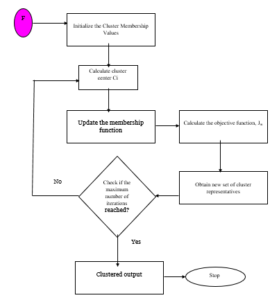
Figure 5: The work flow of HC2A
4. Experimental Setup
The proposed hybrid algorithm is implemented in Matrix Laboratory (MATLAB). The source code developed are run on system with Inter ® i5 with 8 GB RAM. The dataset required for experimentation is taken from the University of California (UCI) Website [20], [21].
5. Results and Discussion
The framework is implemented on Cloudsim and Matlab. The metrics like Sensitivity, Specificity, Precision or Positive Predictive Value (PPV), Negative Predictive Value, False Positive Rate (FPR), False Negative Rate and Accuracy is used to evaluate the performance of the network with different number of neurons. Sensitivity is also called as True Positive Rate which measures the proportions of positivies that are correctly identified. Specificity is defined as the measure of proportions of negatives that are correctly identified. It is also denoted as True Negative Rate.Table 3: Comparison of results obtained using different algorithms for PID
| Techniques | Sensitivity | Specificity | Precision | NPV | FPR | FNR | Accuracy |
| MPSO-ANN | 0.90 | 0.47 | 0.87 | 0.54 | 0.53 | 0.09 | 0.81 |
| GA-RR+MPSO-ANN | 0.92 | 0.60 | 0.94 | 0.55 | 0.40 | 0.07 | 0.87 |
| GA-RR+MPSO-ANN+FKM | 0.99 | 0.51 | 0.93 | 0.88 | 0.49 | 0.01 | 0.92 |
| HC2A | 0.99 | 0.94 | 0.99 | 0.94 | 0.06 | 0.005 | 0.98 |
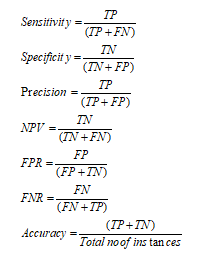
where,
TP- True Positive
FN- False Negative
FP- False Positive
TN- True Negative
Pima Indian Diabetes (PID) Data Set is taken from UCI to evaluate the performance of the proposed algorithm. It consists of a total of 8 attributes and one output class A total of 768 instances are taken for experimentation. Table 1 depicts the results obtained using different algorithms. The proposed algorithm after scheduling using the ATGA has given more accuracy when compared with other algorithms.
The proposed HC2A is compared with Modified Particle Swarm Optimization – Artificial Neural Network (MPSO-ANN) Algorithm [22], Genetic Algorithm-Relative Reduct Algorithm combined with MPSO-ANN GA-RR+MPSO-ANN) Algorithm [23], GA-RR and MPSO-ANN combined with Fuzzy K-Means Clustering (GA-RR+MPSO-ANN+FKM). Table1, 2, 4 & 5 explains the Confusion Matrix obtained for different algorithms.
Below Table 3 shows the results that compares different algorithms for PID. Table 4 below shows the confusion matrix results.
Table 4: Confusion matrix for GA-RR+MPSO-ANN+FKM – PID
| 0 | 1 | |
|
0 |
558 72.66 |
80 10.42 |
|
1 |
60 7.81 |
70 9.11 |
The Table 5 below shows the results of Confusion Matrix for HC2A- PID.
Table 5: Confusion Matrix for HC2A- PID
| 0 | 1 | |
|
0 |
558 72.66 |
80 10.42 |
|
1 |
60 7.81 |
70 9.11 |
The sensitivity rate for PID is 0.99 with the proposed algorithm. The sensitivity rate is increased since ATGA is applied for scheduling. The prediction accuracy is increased to 98%. The other metrics which are used to measure the performane of the proposed framework also supports the algorithm in classifying the diabetes disease. Figure 6 explains the results obtained by using the different algorithms.

Figure 6: Performance of different algorithms
Table 6: Confusion Matrix for MPSO-ANN – USD
| 0 | 1 | |
|
0 |
7000 70 |
431 4.31 |
|
1 |
1569 15.69 |
1000 10 |
Table 7: Confusion Matrix for GA-RR+ MPSO-ANN – USD
| 0 | 1 | |
|
0 |
8115 81.15 |
987 9.87 |
|
1 |
513 5.13 |
385 3.85 |
This algorithm is again experimented with US diabetes data set (USD) collected from UCI. This data set consists of 10000 instances, with 54 attributes and one output classes. The promising results obtained supports the proposed framework in classifying the diabetes data set even when the number of data set increases, since the ATGA is applied for scheduling the Cloud Server. The results obtained are tabulated in Table 10. Confusion Matrix for MPSO-ANN, GA-RR+MPSO-ANN, GA-RR+MPSO-ANN+FKM and HC2A is given in tables 6,7,8 and 9. Figure 7 gives the performance of different algorithms on USD. Figure 8 compares the performance of the algorithm on PID and USD based on Accuracy. It was observed and evident that the proposed Framework which comprises the ATGA and GA-RR+MPSO-ANN+FCM is most suitable for diabetes prediction even with increase in the number of data set.
Table 8: Confusion Matrix for GA-RR+ MPSO-ANN+FKM – USD
| 0 | 1 | |
|
0 |
8563 85.63 |
643 6.43 |
|
1 |
357 3.57 |
437 4.37 |
Table 9: Confusion Matrix for HC2A – USD
| 0 | 1 | |
|
0 |
9015 60.15 |
115 1.15 |
|
1 |
77 0.77 |
793 7.93 |
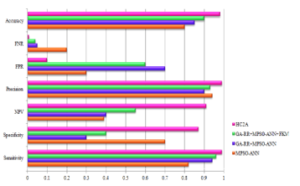
Figure 7: Performance comparison of different algorithms – USD Data set
The below table 10 shows the Comparison of results that obtained using different algorithms for USD.
Table 10: Comparison of results obtained using different algorithms for USD
| Techniques | Sensitivity | Specificity | Precision | NPV | FPR | FNR | Accuracy |
| MPSO-ANN | 0.82 | 0.70 | 0.94 | 0.39 | 0.30 | 0.20 | 0.80 |
| GA-RR+MPSO-ANN | 0.94 | 0.30 | 0.90 | 0.40 | 0.70 | 0.05 | 0.85 |
| GA-RR+MPSO-ANN+FKM | 0.96 | 0.4 | 0.93 | 0.55 | 0.60 | 0.04 | 0.90 |
| HC2A | 0.99 | 0.87 | 0.99 | 0.91 | 0.10 | 0.008 | 0.98 |
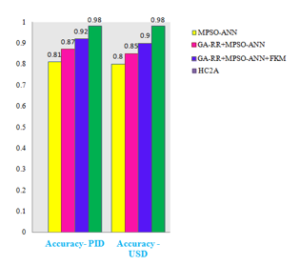
Figure 8: Comparison of performance of different algorithms in PID and USD Data sets based on Accuracy
6. Conclusion
Elasticity-based Med Cloud Recommendation System(EMCRS) is proposed for diagnosing the diabetes disease and providing recommendation for the diabetic patients. This framework is implemented on Cloud and hence the resource sharing is made more comfortable. Adaptively Toggle Genetic Algorithm is applied to allocate the cloud resources in elastic manner. In the proposed algorithm when huge spikes of data occur, the classification process and clustering is handed over to virtual manager to scale the data across virtual machines while maintaining the security features of medical data. The proposed algorithm focuses on workload prediction with elasticity in cloud environment, in case of scaling conditions which is a unique feature of the algorithm. Hybrid Classification and Clustering algorithm is applied to classify and cluster the diabetic patients. The accuracy of about 98% is acquired for both PID and USD datasets. Performance metrics taken for evaluation also explores the effectiveness of EMCRS. Hence, it is evident that the proposed recommendation system is well suited for diabetic prediction. The limitation of the algorithm is the level of security on cloud data. The framework can be enhanced to predict and classify other types of financial and industrial data in future.
- P.G. Jiménez, J. Martín-Carmona, E.L. Hernández, “Diabetes mellitus,” Medicine (Spain), 13(16),883-890,2020, doi:10.1016/j.med.2020.09.010.
- V. Singh, K. Kumar, “Data Mining and Knowledge Management”, International Research Journal of Engineering and Technology, 4(2),200-209, 2017.
- V. Hedau, P. Pant, K. Sharma, “Material Selection Using Association Rule Mining,” International Journal of Advanced Research in Computer Science, 7(3), 230-234,2016.
- M.S. Janani and M.P. Saravana, “Data Mining On Diabetics”, International Journal of Innovative Science, Engineering & Technology, 1(10), 129-134, 2014.
- P. Barham, B. Dragovic, K. Fraser, S. Hand, T. Harris, A. Ho, R. Neugebauer, I. Pratt, A. Warfield, “Xen and the art of virtualization”, in: Proceedings of the 19th ACM Symposium on Operating Systems Principles, SOSP 2003, Bolton Landing, NY, USA, 2003, doi:10.1145/945445.945462.
- P. Mell, T. Grance,”The NIST definition of cloud computing”, Technical Report, National Institute of Standards and Technology, Information Technology Laboratory, 2011, doi:10.1016/b978-0-12-804018-8.15003-x.
- M. Armbrust, A. Fox, R. Griffith, A.D. Joseph, R. Katz, A. Konwinski, G. Lee, D. Patterson, A. Rabkin, I. Stoica, M. Zaharia,”A view of cloud computing”, Communications of the ACM, 53(4),50–58, 2010, doi:10.1145/1721654.1721672.
- P. Mell, T. Grance, “The NIST Definition of Cloud Computing”, Tech. rep., U.S. National Institute of Standards and Technology (NIST), Special Publication 800-145, 2011.
- M. Durairaj, P. Kannan, “A study on Virtualization Techniques and Challenges in Cloud Computing”, International Journal of Scientific &Technology Research, 3(11), 147-151, 2014.
- B. Jennings, R. Stadler, “Resource Management in Clouds: Survey and Research Challenges,” Journal of Network and Systems Management, 23(3),567–619 ,2015, doi:10.1007/s10922-014-9307-7.
- R. Buyya, R. Ranjan, R.N. Calheiros, “InterCloud: Utility-oriented federation of cloud computing environments for scaling of application services,” In: Hsu CH., Yang L.T., Park J.H., Yeo SS. (eds) Algorithms and Architectures for Parallel Processing. ICA3PP 2010. Lecture Notes in Computer Science,. Springer, Berlin, Heidelberg, 6081, 19-24, 2010, https://doi.org/10.1007/978-3-642-13119-6_2.
- P.D. Kaur, I. Chana, “Cloud based intelligent system for delivering health care as a service,” Computer Methods and Programs in Biomedicine, 113, 346–359, 2014, doi:10.1016/j.cmpb.2013.09.013.
- D.A. Bacigalupo, J. Van Hemert, X. Chen, A. Usmani, A.P. Chester, L. He, D.N. Dillenberger, G.B. Wills, L. Gilbert, S.A. Jarvis, “Managing dynamic enterprise and urgent workloads on clouds using layered queuing and historical performance models,”Simulation Modelling Practice and Theory, 1-30, 2011, doi:10.1016/j.simpat.2011.01.007.
- M. Durairaj, P. Kannan, “Improvised Genetic Approach for an Effective Resource Allocation in Cloud Infrastructure,” International Journal of Computer Science and Information Technologies, 6(4), 4037-4046, 2015, doi:ISSN: 0975-9646.
- T. Lorido-Botrán, J. Miguel-Alonso, J.A. Lozano, “Auto-scaling Techniques for Elastic Applications in Cloud Environments,” Technical Report: EHU-KAT-IK-09-12, University of the Basque Country, 1-44,2012.
- K.A. Al Mamun, M. Alhussein, K. Sailunaz, M.S. Islam, “Cloud based framework for Parkinson’s disease diagnosis and monitoring system for remote healthcare applications,” Future Generation Computer Systems, 66, 36–47, 2017, doi:10.1016/j.future.2015.11.010.
- T. Santhanam, M.S. Padmavathi, “Application of K-Means and genetic algorithms for dimension reduction by integrating SVM for diabetes diagnosis,” Procedia Computer Science, Elsevier, 47, 76-83, 2015, doi:10.1016/j.procs.2015.03.185.
- K. Vembandasamy, T. Karthikeyan, “Novel outlier detection in diabetics classification using data mining techniques,” International Journal of Applied Engineering Research, 11(2),1400-1403, 2016.
- K. Polat, “Intelligent Recognition of Diabetes Disease via FCM Based Attribute Weighting”, World Academy of Science, Engineering and Technology, International Journal of Computer and Information Engineering, 10(4), 783-787, 2016. doi.org/10.5281/zenodo.1124023.
- D. Sisodia, D.S. Sisodia, “Prediction of Diabetes using Classification Algorithms,” in Procedia Computer Science, 132, 1578-1585, 2018, doi:10.1016/j.procs.2018.05.122.
- W. Chen, S. Chen, H. Zhang, T. Wu, “A hybrid prediction model for type 2 diabetes using K-means and decision tree,” in Proceedings of 8th IEEE International Conference on Software Engineering and Service Science (ICSESS), Beijing, 386-390,2017 doi: 10.1109/ICSESS.2017.8342938.
- K. Ateeq, G. Ganapathy, “The novel hybrid Modified Particle Swarm Optimization-Neural Network (MPSO-NN) Algorithm for classifying the Diabetes”, International Journal of Computational Intelligence Research, 13(4), 595-614, 2017.
- K. Ateeq and G. Ganapathy, “A Hybrid Genetic-Relative Reduct Algorithm for Pre-Processing the Diabetic Dataset”, International Journal of Advanced Research in Computer Science, 8(1), 60-64, 2017.