NemoSuite: Web-based Network Motif Analytic Suite

Adv. Sci. Technol. Eng. Syst. J. 5(6), 1545–1553 (2020);
 DOI: 10.25046/aj0506185
Biological networks represent biological systems, and various graph analysis algorithms have been applied to solve various real-world problems. Network motif analysis, as one of network analyses, is detecting frequently and uniquely over-occurring subgraph patterns in a network. The detection process requires high computational resources, and various tools have been developed to provide efficient solutions. However, they still lack extensible output options and easy accessibility, which restricts substantial scale of experiments for many biological applications. Therefore, we provide NemoSuite (Network Motif in a Suite) as a web-interactive tool for detection and analysis of network motifs. Including both of network-centric and motif- centric approaches, it is a greatly accessible tool emphasizing on efficiency, usability, and extensibility.
1. Introduction
Systems biology focuses more on the interconnections between molecules, such as DNA, RNA, or proteins, than individual components. Biological systems are often represented as biological networks, including protein-protein interaction (PPI), metabolic, or gene-regulatory networks. Biological networks, which model the data in -ome level or in ecosystem level, show individual molecules as graph nodes and their interactions as edges. Researchers applied various graph analysis algorithms to understand biological systems in networks, and we are focusing on network motif analysis as one of graph algorithms. Here, we present an online program extending an original work presented in 2019 IEEE International Conference on Bioinformatics and Biomedicine (BIBM) [1], which introduces NemoMapPy as an online tool to detect network motifs.
Network motifs are defined as statistically over-recurring subgraph patterns in a network, which are assumed to have biological significance in biological systems. They are defined in line with “sequence motifs” that are playing a key role in analyzing DNA/RNA or protein sequences with the goal of, for example, controlling the translation of the encoding mRNA, characterizing protein families, detecting DNA binding sites, or controlling tumor suppressor gene expression.
Analysis of network motifs have applied to various applications such as predicting protein-protein interactions [2], determining protein functions [3], detecting breast-cancer susceptibility genes [4], investigating evolutionary conservation [5, 6], and discovering essential proteins [7, 8]. Furthermore, a broad spectrum of network motif applications has been explored: “motif clustering” [9], “motif themes” [10], “relative graphlet frequency distances” [11], “motif modes” [12], and “MotifScores” [13].
However, currently existing tools lack the easy accessibility, and flexible scalability, which restrict their range of applications, and thereupon cause some amount of faithlessness on the analysis [14]. Most tools are unable to collect instances of network motifs and lack of functionality, usability, and extensibility. Therefore, we provide NemoSuite (Network Motif in a Suite) to resolve these problems: it includes Nemo and NemoMapPy programs. Nemo program implements a network-centric approach using NemoLib [15, 16]. NemoMapPy implements NemoMap [17] algorithm which is one of the motif-centric methods.
The contributions of NemoSuite include the followings: (1) As a web-interactive graphical user interface (GUI) program, it provides easily accessible tools with great efficiency and usability; (2) It provides various output results based on users’ choice, which will explore network motif analysis to various real-world applications; (3) It provides both network-centric and motif-centric tools. As far as the authors’ knowledge, NemoSuite is the first program providing both network-centric and motif-centric methods as an web-interactive, and GUI format.
The rest of the paper starts providing the review of various detection algorithms and tools in Section 2. Thereafter, Section 3 describes NemoSuite, followed by experiments and results in Section 4, and Section 5 respectively, and conclusion in the last section.
2. Related Works
2.1. Network Motif
Recent survey of network motifs showed that there are different types of network motifs [18]. Originally, Milo et al. [19] introduced network motifs as the “patterns of interconnections occurring in complex networks at numbers that are significantly higher than those in randomized networks” in 2002. After discovering the underrepresented patterns could also delineate some features of networks, ‘anti-motifs’ are defined as the subgraphs with significantly less frequencies in the input network compared in a random pool [20]. On the other hand, ‘colored-motifs’ are introduced as the network motifs in multi-label networks such as metabolic, social or traffic networks [21]. Additionally, Parida proposed ‘maximal-motif’ as the network motifs with maximal nodes and edges in a given size
[22].
However, as we focus on biological networks, we use the original network motifs in this work, whose mathematical definition follows. A network motif M is a connected subgraph of size k which can be found frequently and uniquely in an input network G. To determine the uniqueness, P-value (Eq. (1)) or Z-score (Eq. (2)) of the recurrence of M is calculated within a huge pool of randomly generated graphs.
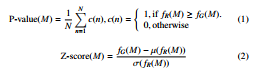
Here, N refers to the number of random graphs, and fG(M) is the frequency of M in the input G while fR(M)is the frequency of
M in the random network R. µ(fR(M)) is the mean of frequencies of M in the random networks and σ(fR(M)) is the standard deviation of frequencies of M in the random networks. For a fair comparison, the random graphs are generated given the same degree sequences as the original graph. In general, a subgraph with P-value less than 0.01 or Z-score greater than 2.0 is considered as a network motif after compared with 1,000 random networks [23].
2.2. Algorithms
Grow and Kellis classified various algorithms of discovering network motifs into network-centric and motif-centric approaches [24]. The former method first searches all possible patterns from the input graph, then determines which patterns are network motifs through a statistical testing, whereas the latter approach outputs the number of occurrences of the given query pattern in the input network without statistical testing results.
Various algorithms and software programs implement networkcentric approach, which include MAVisto [25], MFinder [26], Kavosh [27], NemoFinder [28], NetMODE [29], QuateXelero [30],
Motif-Discovery[31], MotifNet [32], ESU algorithm[33], and FANMOD program [34]. Network-centric approach, requiring an input network and the size of motif to search, involves enumerating nonisomorphic k-size subgraph patterns in the original network. It then compares the frequency of each pattern in a number of generated random graphs. The uniqueness of each pattern is determined based on the P-value or Z-score. This approach is specifically useful if the goal is to determine which pattern is a network motif. However, enumeration process limits the size of detectable motifs due to the time-consuming process of scanning for every nodes and edges of the network. Consequently, network-centric algorithms using exhaustive enumeration of k-size subgraphs in the network does not exceed size 8 nodes [24]. Larger size of network motifs can be detected if searched approximately .
Table 1: It shows the number of non-isomorphic patterns in undirected or directed graphs increases exponentially with the size of pattern, courtesy of [23].
Focusing on detecting larger size of motifs, Grochow and Kellis introduced a motif-centric approach (GK method), which finds the frequency of each pattern in a given query set by mapping each query graph to all possible location in the input graph [24]. GK method, MODA[35], FASCIA [36], ISMAGS[31], ParaMODA[37], and NemoMap [17] are implementing this motif-centric approach. This approach was able to find motifs of up to 15 nodes with symmetrybreaking technique to significantly reduce isomorphic testing. One disadvantage is that it assumes that the user has pre-knowledge of what patterns are network motifs in the target graph as a set of query patterns have to be provided. Otherwise, this approach is not straightly applicable to finding network motifs. In fact, no algorithms or tools have described how to provide the query set. Therefore, if the goal is to find which pattern is significantly frequent than others, the user has to provide all possible k-size subgraph patterns as a query set to compare, which can suffer heavily since full list of all possible variations of k-size subgraphs grows exponentially with
- k. Table 1 shows the exponential growth of pattern variations of ksize subgraphs up to 10 nodes, and in the worst-case scenario the application would have to iterate over 341,247,400,399,400,000,000 of 10-node patterns many of which might not even exist in the target graph.
Table 2: Summary of network-centric and motif-centric approaches.
|
Table 2 summarizes various aspects of these two approaches. Although both the network-centric and motif-centric approaches have drawbacks, each approach can be respectively applied to different problems with appropriate goals. If the goal is determining which patterns will be network motifs in a target graph, then networkcentric approach is appropriate. Motif-centric method would work better for a pattern matching. Therefore, we aimed to provide a tool with both approaches to maximize the usability and efficiency.
2.3. Tools
There are various tools that follow network-centric or motif-centric approaches. After careful review of the tools [18, 38, 39], we found out that most tools are out-dated, dependent on operating systems or other external tools, restricted output options, inaccessible, or lack of usability. As shown in Table 3, we tested the following tools such as mFinder, FANMOD, Kavosh, QuateXelero, Fascia, ISMAGS, MotifNet, and Motif-Discovery, because others are unable to locate, unable to install, out-dated, incompatible with current security setting, or inexecutable.
mFinder, FANMOD, Kavosh, and QuateXelero are network-
centric based tools that accept a text file as an input graph, the size of network motifs, and the number of random graphs to generate. While others require a list of edges in the text graph file, Kavosh and QuateXelero additionally require the number of nodes at the first line in the file. Before running these programs, however, since each node should be labelled as an integer, non-integer labels should be converted to integer labels. They provide outputs consisting of each pattern’s frequency, and its Z-score or P-value so that users can determine which patterns are network motifs. When we design our program, NemoSuite, we set FANMOD program as an example, since it is a GUI-based program, efficient, with additional filtering options, and can provide the set of instances as well. MotifNet, as a web-program, also succeeds FANMOD, taking two files (edge list and node list), the size of network motif, and the number of random graphs. However, it requires the user to submit the work in a queue, which seemed discontinued the service currently, as we never got the results back. Motif-Discovery, as a cytoscape[31] plug-in, can read string-labelled nodes, visualize the network, and provide the frequency and Z-score for each pattern. Unfortunately, since the Z-scores are significantly different from the ones by other tools, it is unclear how to determine network motifs.
Fascia and ISMAGS are motif-centric based motif discovery tools. Fascia requires two text files. One is the input graph and the other is a query graph. The input graph file should contain the number of nodes, the number of edges, and the list of edges where the node ID’s are integers. A query text file is a list of edges. As a command-based program, it provides the number of occurrence of the query pattern in the input network. On the other hand, ISMAGS is cytoscape plug-in, which can visualize the input network. In this work, we excluded other tools including MODA, since we failed to install or run them properly.
Table 3 lists the tools, approach, year of publication, the input options, the output options, interface, and shortcomings. In general, current available tools lack of visualization, usability, easy accessibility, and comprehensive results. To overcome the shortcomings of other tools, we provide NemoSuite as a comprehensive and efficient web-interactive program.
3. Methods: NemoSuite
We developed ‘NemoSuite’ (Network Motif in a suite) to provide a unified access to network motif analysis including networkcentric and motif-centric approaches. NemoSuite consists of two separate programs: ‘Nemo’ and ‘NemoMapPy.’ Nemo program employs a network-centric approach using a NemoLib [15, 16] that improves ESU (Enumerate SUbgraphs) algorithm [33]. NemoMapPy program follows a motif-centric method by implementing NemoMap [17] algorithm in Python and Flask framework. Figure 5 shows the NemoSuite homepage with Nemo and NemoMapPy program pages. The program is available at https://bioresearch.css.uwb.edu/biores/NemoSuite/.
Table 3: Network motif detection tools are compared based on their approach (network-centric vs. motif-centric), shortcoming, year, input, output, and interface options.
|
3.1. Nemo
Nemo, as shown in Figure 5(b), follows a network-centric approach which includes the steps of enumeration, random graph generation, and statistical analysis. The user should select an input file (see Fig 1 (a) for the file format), along with the directness, the size of motif and the number of random graphs to generate. Nemo program works on both directed and undirected graphs, and the input graph’s node can be represented as string or integer. There are three output options: NemoCount, NemoProfile, and NemoCollection, whose formats are introduced by Kim and Haukap [40], and illustrated in Figure 1 (b).
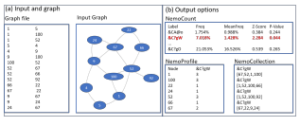
Figure 1: Nemo: (a) shows the input file format with visualized graph on the right; (b) shows the three output options including NemoCount, NemoProfile, and NemoCollection.
‘NemoCount’ is a default output format which lists the patterns of each detected subgraphs, along with its frequency in the input graph, average frequency in the random graphs, then finally shows its statistical results so that the user can determine which pattern is a network motif. Each pattern is labeled with g6 format which is used to identify isomorphic graphs in the Nauty program [41]. ‘NemoProfile’ option returns two files. One is a file of NemoProfile that contains two dimension of matrix of N rows and M columns, where N is the number of nodes and M is the number of network motifs. For example, from the Figure 1 (b), the node ‘100’ is found in three instances of the motif &C?gW, and the node ‘67’ belongs to two instances of the same motif. Wang and Kim showed that NemoProfile can be used as a data feature to detect essential genes [42]. Another file is a SubgraphProfile, which is an extended NemoProfile containing not only motifs but also non-motifs in the column. If none of patterns are network motifs, this option provides SubgraphPrifle only. Likewise, ‘NemoCollection’ also provides two files: NemoCollection and SubgraphCollection. While NemoCollection provides the set of network motif instances as a file, SubgraphCollection provides instances of all subgraph patterns.
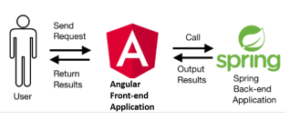
Figure 2: Block diagram for Nemo program.
Nemo program is using an angular application for the front-end, and a spring application for the back-end as shown in Figure 2. The front-end uses the angular framework, which takes advantage of the Model-View-Controller (MVC) pattern. Developers can easily display the data and the model from the back-end and control the model with the ‘appcomponent.’ Also, it can be easily deployed with angular. The back-end uses the Spring framework, which produces RESTful APIs. With this simple and intuitive design, developers can easily update modules for additional purposes. Nemo program also has high maintainability with the REST architecture style. Developers can fix any defected part if any, and restart the Spring application on the server while the client application remains untouched. Figure 3 shows the overall architecture of the program.
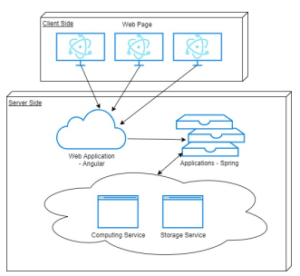
Figure 3: Descriptive architecture of Nemo program.
3.2. NemoMapPy
NemoMapPy implements a motif-centric approach which requires an input file, and a query pattern. While other motif-centric tools do not provide statistical results, NemoMapPy provides the frequency and statistical results of the query pattern in the input graph if the number of random graphs are entered, so that whether this pattern is a network motif can be determined with its P-value or Z-score.
NemoMapPy, as an online tool, refined and upgraded the features of NemoMap [17] that improved the performance of ParaMODA [37], which also increased the efficiency of the motifcentric algorithm introduced by Grochow and Kellis (GK) [24], and MODA program [35]. In fact, NemoMap improved the performance of ParaMODA, MODA and GK method by modifying the symmetry-breaking method. It removed the need of maintaining a list of all mappings to prevent duplicate occurrences. It also reduced some of symmetry-breaking conditions, thereafter, contributes on optimizing space and computational time. NemoMap has been proven to be more efficient than ParaMODA, MODA and GK in most cases, exception with some simple query patterns.
NemoMapPy ported NemoMap with additional features on the web [1], and was implemented in Python 3 with the Flask web framework [43]. As a consequence, NemoMapPy can accept streaming text inputs as well as file uploading. The query pattern can be provided as a text input, file uploading, or g6 format. Since Nemo program provides g6 format for detected pattern, the g6 format helps a quick transition from Nemo to NemoMapPy.
Figure 4 illustrates the overall architecture of NemoMapPy. Nginx [44] is used in the first layer, which is a reverse proxy for Gunicorn [45] that redirects incoming requests to Gunicorn with remarkable performance. Gunicorn is a WSGI server which allows multiple applications to run side-by-side in the same process. It handles the load balancing for a program, distributes incoming requests, and communicates with the Flask services accordingly. The back-end of NemoMapPy program is developed by python Flask framework, which takes advantages of simplicity and flexibility. It is convenient for developers to deploy or undeploy it from the server, and the simplified usability make Flask program faster to debug. Here we focused on providing an easy and accessible interface with multiple input options so that users can use NemoMapPy in a variety of situations.
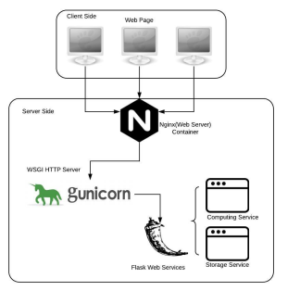
Figure 4: Descriptive architecture of NemoMapPy program
Initially, NemoMapPy only worked on undirected graph and the input file should have integer-labeled vertices [1]. Also, it only provided the frequency of the query pattern as a result. Here, we improved the initial NemoMapPy by adding the following features. (1) NemoMapPy now works both on directed and undirected graphs; (2) the vertices can be integer or string; (3) the query pattern’s statistical significance is provided along with its frequency; (4) the input format of query graph pattern has three options. Input text, a file, or g6 format; and (5) the instances of the query pattern is provided as a file.
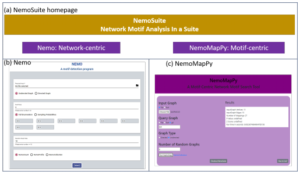
Figure 5: NemoSuite: (a) is the homepage view of NemoSuite program; (b) is the homepage of Nemo program with network-centric method; (c) shows the homepage for
NemoMapPy with motif-centric method.
4. Experiments
NemoSuite is an online network motif detection program with both of network-centric and motif-centric methods. It is designed to satisfy the following functional and non-functional requirements.
Functional Requirements
- The user can use the program with any web browser.
- The user can upload the data file, which is an undirected or directed graph.
- The user can use the data file with string or integer type of nodes.
- The user can use both programs to detect the frequency of network motifs (NemoCount).
- The user can use both programs to obtain the instances of network motifs (NemoCollection).
- The user can use the Nemo program to obtain the network motif profile (NemoProfile).
Non-functional Requirements
- The returned results should be clear and easy to understand.
- The running time should be reasonably fast based on the size of the input data.
- The program works for any devices that have access to the internet and have a web browser.
In other words, as a web program, NemoSuite provides easy accessibility for users to detect network motifs, and apply them for various real-world problems. With additional features, the program provides good usability, functionality and computational efficiency. In the following section, we provide results of the comparison of NemoSuite with other programs to demonstrate its computational efficiency and good usability.
We compared Nemo with FANMOD [34] program, since both follow the motif-centric ESU algorithm in essence. Also, after reviewing all other tools, we found FANMOD is efficient and the most usable program among all others. Therefore, we compared Nemo program with FANMOD to evaluate the accessibility, usability, functionality and computational efficiency.
NemoMapPy is implementing a motif-centric approach, which is provided by Grochow and Kellis (GK), called GK method. Unlike network-centric methods, few programs are available that follow GK method, such as, MODA [35], ParaMODA, Fascia [36], ISMAGS[31] and NemoMap. They are available as source codes, cytoscape plug-in, or executable programs. However, the standalone MODA program is out-dated and had many restrictions on running the program, ISMAGS is cytoscape plug-in, and Fascia is a parallel and command-based program. Therefore, we compared NemoMapPy with NemoMap for its efficiency, assuming its easy accessibility and good usability are self-demonstrated with its web-interactive features.
5. Results and Analysis
5.1. Nemo vs. FANMOD
As a web program, Nemo program can be launched with any webbrowser. Therefore it is easy to access, and easy to use. FANMOD program is a stand-alone GUI (graphical-user-interface) program that can be downloaded from a website and it can be installed in Windows, Mac, and Linux operating systems. While both programs have good accessibility, Nemo has a better accessibility as the user can use it anytime and anywhere as long as there is an internet connection.
Nemo and FANMOD programs have good usability too. Usability measures “the capacity of a system to provide an environment for the users to perform the tasks safely, effectively, and efficiently [46].” With Nemo and FANMOD, network motifs are easily detected given an input graph, the size of motif, and the number of random graphs to generate. FANMOD has more options for the random graphs, and the user can see the progress of the task. However, Nemo program performs faster than FANMOD and has more input and output options.
Table 4: Input graph files used for testing
| Type | biological | collaboration | social | |||
| File | Y2k | Y11k | MIPS | CA-
GrQc |
CA-
HepTH |
|
| #vertex | 988 | 2401 | 4545 | 5241 | 9875 | 4545 |
| #edge | 2455 | 11000 | 12317 | 14484 | 25973 | 12317 |
We tested the performance of Nemo and FANMOD program with three biological networks, two collaboration networks, and one social network. The detail features of testing networks are described in Table 4. When we tested the run-time for network motif detection with different graphs, the size of network motif is set as four, and the number of random graphs as 100. All tests are performed in Windows OS. Table 5 and Figure 6 provide the comparison results.
Table 5: Nemo vs FANMOD run-time (rounded in seconds) comparison on the size of input graph
| Y2k | CA-
GrQc |
CA-
HepTH |
Y11k | MIPS | ||
| Nemo | 24 | 54 | 201 | 205 | 517 | 551 |
| FANMOD | 72 | 248 | 607 | 561 | 2,189 | 2,859 |
We can observe that Nemo runs relatively stable as the network size grows, while the run-time of FANMOD program increases abruptly. For the Y11k and MIPS networks, Nemo program runs roughly 5 times faster than FANMOD program.
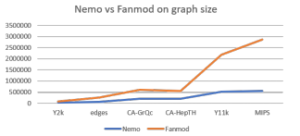
Figure 6: Graph of runtime vs. input graph size between Nemo and FANMOD in millisecond(ms)
We also tested the performance of two programs based on the size of motifs. To save time, we used Y2k data with only 10 number of random graphs, and used Windows OS.
Table 6: Nemo vs FANMOD run-time (in seconds) comparison on the size of motif
| 3 | 4 | 5 | 6 | |
| Nemo | 0.1 | 2.4 | 60.8 | 1,580.5 |
| FANMOD | 0.3 | 7.6 | 208.5 | 6,946.9 |
Table 6 and Figure 7 provide the results. We can observe that Nemo program runs consistently faster than FANMOD program, although the run-time of both programs still increases steeply with the increment of the size of motifs.
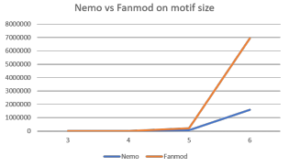
Figure 7: Graph of runtime vs. motif size between Nemo and FANMOD in millisecond(ms)
Through various experiments, we could see that Nemo program provides better accessibility, functionality, usability and computational efficiency than FANMOD program.
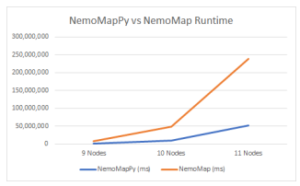
Figure 8: Graph of runtime vs. query graph size between NemoMapPy and
NemoMap
5.2. NemoMapPy vs. NemoMap
We tested the efficiency of NemoMapPy by comparing with the NemoMap, as NemoMap is known the fastest program with motifcentric approach [17] in most of cases, when not considering parallelization. We tested NemoMapPy with a graph of 1,018 nodes and 1,331 edges, the query graphs that has 9, 10, 11 nodes with average complexity. The complexity of query graph was measured in node-to-edge ratio. We obtained NemoMap source code from the authors of [17] and compiled with Visual Studio 2017. We compared the performance with run-time.
The testing environment was on a desktop computer in Windows OS. In summary, NemoMapPy is approximately 70% faster than NemoMap on the graphs with average complexity and average density, as shown in Table 7, and Fig. 8.
Table 7: NemoMapPy vs NemoMap run-time (in seconds) Comparison
| Query Graph | 9 Nodes | 10 Nodes | 11 Nodes |
| NemoMapPy | 1,728,213 | 9,923,137 | 51,904,930 |
| NemoMap | 8,599,994 | 48,674,827 | 239,088,982 |
| % Reduction | 79.90% | 79.61% | 78.29% |
| # Mappings | 13,882,459 | 251,584,995 | 1,070,991,776 |
6. Conclusion
In this paper, we present NemoSuite that provides a combination of easy accessibility, usability, functionality, extensibility, and efficiency that the current network motif detection software programs lack. More specifically, we believe NemoSuite contribute greatly to development of network motif detection programs in the following reasons.
As a web-interactive program, it is easily accessible, and highly usable tool with great efficiency. The various input and output options enable for the users to apply the results to various real-world problems. It is also the first tool that provides both of networkcentric and motif-centric approaches. We also demonstrated that NemoSuite is substantially designed to meet the functional and nonfunctional requirements, and showed its computational efficiency by comparing with other available tools.
Currently, NemoSuite includes Nemo and NemoMapPy programs to represent network-centric and motif-centric methods. Source codes of both programs are available in public github:
Nemo is available at https://github.com/lytbfml/Nemolib App and NemoMapPy at https://github.com/zicanl/NemoMapPy. We plan to add more online tools implementing recent algorithms such as QuateXelero [30], and utilize distributed computing to improve its efficiency further. Additional future works include adding more utility programs such as motif-visualization, graph file conversion, and generating random networks with various methods.
Conflict of Interest
The authors declare no conflict of interest.
Acknowledgment
We thank the Computing and Software Systems, School of STEM, at the University of Washington Bothell for the support of this research.
- P. Mar, W. Kim, “NemoMapPy: Motif-centric network motif search on a web,” in 2019 IEEE International Conference on Bioinformatics and Biomedicine (BIBM), 1226–1228, 2019.
- I. Albert, R. Albert, “Conserved network motifs allow protein-protein interac- tion prediction.” Bioinformatics, 20(18), 3346–3352, 2004.
- J. Chen, W. Hsu, M. L. Lee, S.-K. Ng, “Labeling network motifs in protein interactomes for protein function prediction,” Data Engineering, International Conference on, 0, 546–555, 2007.
- Y. Zhang, J. Xuan, B. G. de los Reyes, R. Clarke, H. W. Ressom, “Network motif-based identification of breast cancer susceptibility genes,” in 2008 30th Annual International Conference of the IEEE Engineering in Medicine and Biology Society, 5696–5699, IEEE, 2008.
- G. C. Conant, A. Wagner, “Convergent evolution of gene circuits,” Nature genetics, 34(3), 264–266, 2003.
- S. Wuchty, Z. N. Oltvai, A.-L. Barabasi, “Evolutionary conservation of motif constituents in the yeast protein interaction network,” Nature genetics, 35(2), 176–179, 2003.
- W. Kim, “Prediction of essential proteins using topological properties in GO- pruned PPI network based on machine learning methods,” Tsinghua Science and Technology, 17(6), 645–658, 2012.
- W. Kim, M. Li, J. Wang, Y. Pan, “Essential Protein Discovery based on Net- work Motif and Gene Ontology,” in Proceedings of IEEE Bioinformatics and Biomedicine, 470–475, 2011.
- R. Dobrin, Q. K. Beg, A.-L. Barabasi, Z. N. Oltvai, “Aggregation of topolog- ical motifs in the Escherichia coli transcriptional regulatory network,” BMC Bioinformatics, 5, 10, 2004.
- L. Zhang, O. King, S. Wong, D. Goldberg, A. Tong, G. Lesage, B. Andrews, H. Bussey, C. Boone, F. Roth, “Motifs, themes and thematic maps of an in- tegrated Saccharomyces cerevisiae interaction network,” Journal of Biology, 4(2), 6, 2005.
- N. Przulj, D. G. Corneil, I. Jurisica, “Modeling interactome: scale-free or geometric?” Bioinformatics, 20(18), 3508–3515, 2004.
- W.P. Lee, B.-C. Jeng, T.-W. Pai, C.-P. Tsai, C.-Y. Yu, W.-S. Tzou, “Differen- tial evolutionary conservation of motif modes in the yeast protein interaction network,” BMC Genomics, 7(1), 89, 2006.
- Z.-R. Xie, M.-J. Hwang, “An interaction-motif-based scoring function for protein-ligand docking,” BMC Bioinformatics, 11(1), 298, 2010.
- A. S. Konagurthu, A. M. Lesk, “On the origin of distribution patterns of motifs in biological networks,” BMC Systems Biology, 2(1), 1–8, 2008.
- A. Andersen, W. Kim, NemoLib: A Java Library for E_cient Network Motif Detection, 403–407, Bioinformatics Research and Applications: 13th International
Symposium, ISBRA 2017, Honolulu, HI, USA, May 29 – June 2, 2017, Proceedings, Springer International Publishing, Cham, 2017, doi: 10.1007/978-3-319-59575-7 42. - W. Kim, Z. A. Brader, “NemoLib: Network Motif Libraries for Network Motif Detection and Analysis,” in Z. Cai, I. Mandoiu, G. Narasimhan, P. Skums,
X. Guo, editors, Bioinformatics Research and Applications, 327–334, Springer International Publishing, Cham, 2020. - S. Yu, Y. Feng, D. Zhang, H. D. Bedru, B. Xu, F. Xia, “Motif discovery in networks: A survey,” Computer Science Review, 37, 100267, 2020, doi: https://doi.org/10.1016/j.cosrev.2020.100267.
- M. R., S. Shen-Orr, S. Itzkovitz, N. Kashtan, D. Chklovskii, U. Alon, “Network Motifs: Simple Building Blocks of Complex Networks,” Science, 298(5594), 824–827, 2002.
- R. Milo, S. Itzkovitz, N. Kashtan, R. Levitt, S. Shen-Orr, I. Ayzenshtat, M. Shef- fer, U. Alon, “Superfamilies of Evolved and Designed Networks,” Science, 303(5663), 1538, 2004, doi:10.1126/science.1089167.
- V. Lacroix, C. G. Fernandes, M. F. Sagot, “Motif search in graphs: application to metabolic networks,” IEEE/ACM transactions on computational biology and bioinformatics, 3(4), 360–368, 2006, doi:10.1109/TCBB.2006.55[doi].
- L. Parida, “Discovering Topological Motifs Using a Compact Notation,” Jour- nal of Computational Biology, 14(3), 300–323, 2007.
- B. H. Junker, F. Schreiber, Analysis of Biological Networks, Wiley, 2008.
- J. A. Grochow, M. Kellis, “Network motif discovery using subgraph enumera- tion and symmetry-breaking,” in Proceedings of the 11th annual international conference on Research in computational molecular biology, RECOMB’07, 92–106, Springer-Verlag, Berlin, Heidelberg, 2007.
- F. Schreiber, H. Schwobbermeyer, “Mavisto: a tool for the exploration of network motifs,” Bioinformatics, 21, 3572–3574, 2005.
- N. Kashtan, S. Itzkovitz, R. Milo, U. Alon, “Efficient sampling algorithm for estimating sub-graph concentrations and detecting network motifs,” Bioinfor- matics, 20, 1746–1758, 2004.
- Z. Kashani, H. Ahrabian, E. Elahi, A. Nowzari-Dalini, E. Ansari, S. Asadi, S. Mohammadi, F. Schreiber, A. Masoudi-Nejad, “Kavosh: a new algorithm for finding network motifs,” BMC Bioinformatics, 10(1), 318, 2009.
- J. Chen, W. Hsu, M. Lee, S. Ng, “NeMoFinder: Dissecting genome-wide protein-protein interactions with meso-scale network motifs,” Proceedings of the 12th ACM SIGKDD international conference on Knowledge discovery and data mining, New York, NY, 106–115, 2006.
- X. Li, D. S. Stones, H. Wang, H. Deng, X. Liu, G. Wang, “NetMODE: Net- work Motif Detection without Nauty,” PLoS ONE, 7(12), e50093, 2012, doi: 10.1371/journal.pone.0050093.
- S. Khakabimamaghani, I. Sharafuddin, N. Dichter, I. Koch, A. Masoudi-Nejad, “QuateXelero: An Accelerated Exact Network Motif Detection Algorithm,” PLOS ONE, 8(7), 1–15, 2013, doi:10.1371/journal.pone.0068073.
- P. Shannon, A. Markiel, O. Ozier, N. S. Baliga, J. T. Wang, D. Ramage, N. Amin, B. Schwikowski, T. Ideker, “Cytoscape: A Software Environment for Integrated Models of Biomolecular Interaction Networks,” Genome research, 13(11), 2498–2504, 2003.
- I. Y. Smoly, E. Lerman, M. Ziv-Ukelson, E. Yeger-Lotem, “MotifNet: a web- server for network motif analysis,” Bioinformatics, 33(12), 1907–1909, 2017.
- S. Wernicke, “Efficient Detection of Network Motifs,” IEEE/ACM Trans.Comput.Biol.Bioinformatics, 3(4), 347–359, 2006.
- S. Wernicke, F. Rasche, “FANMOD: a tool for fast network motif detection,” Bioinformatics, 22, 1152–1153, 2006.
- S. Omidi, F. Schreiber, A. Masoudi-Nejad, “MODA: An efficient algorithm for network motif discovery in biological networks,” Genes and Genetic Systems, 84(5), 385–395, 2009.
- G. M. Slota, K. Madduri, “Fast Approximate Subgraph Counting and Enumer- ation,” in 2013 42nd International Conference on Parallel Processing, 210–219, 2013, doi:10.1109/ICPP.2013.30.
- S. Mbadiwe, W. Kim, “ParaMODA: Improving motif-centric subgraph pattern search in PPI networks,” in 2017 IEEE International Conference on Bioinfor- matics and Biomedicine (BIBM), 1723–1730, 2017, doi:10.1109/BIBM.2017. 8217920.
- A. Masoudi-Nejad, F. Schreiber, Z. R. Kashani, “Building blocks of biological networks: a review on major network motif discovery algorithms,” IET systems biology, 6(5), 164–174, 2012, doi:10.1049/iet-syb.2011.0011[doi].
- D. Jain, R. Patgiri, “Network Motifs: A Survey,” in M. Singh, P. Gupta, V. Tyagi, J. Flusser, T. O¨ ren, R. Kashyap, editors, Advances in Computing and Data Sciences, 80–91, Springer Singapore, Singapore, 2019.
- W. Kim, L. Haukap, “NemoProfile: Effective representation for network mo- tif and their instances,” in 12th International Symposium on Bioinformatics Research and Applications (ISBRA), 2016.
- B. McKay, “Practical graph isomorphism,” Congr Numer, 30, 45–87, 1981.
- Y. Wang, W. Kim, “Identification of Essential Genes with NemoProfile and Various Machine Learning Models,” in Z. Cai, I. Mandoiu, G. Narasimhan, P. Skums, X. Guo, editors, Bioinformatics Research and Applications, 319–326, Springer International Publishing, Cham, 2020.
- A. Ronacher, “Flask,” https://flask.palletsprojects.com, 2010.
- W. Reese, “Nginx: The high-performance web server and reverse proxy,” Linux J., 2008(173), 2008.
- B. Chesneau, “gunicorn,” https://gunicorn.org/, 2009.
- J. Y. Lee, J. Y. Kim, S. J. You, Y. S. Kim, H. Y. Koo, J. H. Kim, S. Kim, J. H. Park, J. S. Han, S. Kil, H. Kim, Y. S. Yang, K. M. Lee, “Development and Usability of a Life-Logging Behavior Monitoring Application for Obese Patients,” Journal of Obesity & Metabolic Syndrome, 28(3), 194–202, 2019, doi:10.7570 3.194.