
A Software-Defined Network Approach for The Best Hospital Localization Against Coronavirus (COVID-19)
Volume 5, Issue 6, Page No 1537-1544, 2020
Author’s Name: Bilal Babayigit1, Eda Nur Hascokadar2,a)
View Affiliations
1Department of Computer Engineering, Erciyes University, Kayseri, 38039, Turkey
2Graduate School of Natural and Applied Sciences, Erciyes University, Kayseri, 38039, Turkey
a)Author to whom correspondence should be addressed. E-mail: edahsckdr@gmail.com
Adv. Sci. Technol. Eng. Syst. J. 5(6), 1537-1544 (2020); ![]() DOI: 10.25046/aj0506184
DOI: 10.25046/aj0506184
Keywords: Software-Defined Network, Multi-Controller Placement, Genetic Algorithm, COVID-19, Pandemic Hospital

Export Citations
Traditional networks have difficulty in meeting the technological developments and the continuous increase in the size of data to be processed. Software-Defined Network (SDN) approach has emerged as an alternative to traditional networks. SDN separates the control and data planes from each other and manages the network over the control plane with flexibility and cost advantages. In networks with large data flow, SDN with multiple controllers will be useful to manage the network because a single controller may cause network interruptions and data loss. After deciding on the use of multiple controllers in the SDN approach, problems are encountered with the number of controllers that should be used and the placement of these controllers. Due to the increase in the coronavirus epidemic that has affected the whole world in recent months, the need for pandemic hospitals has increased. However, considering the establishment costs of pandemic hospitals, it will not be possible to establish these hospitals in every desired location in the impact area. For this reason, positioning pandemic hospitals at more strategic points will provide these hospitals with a wider coverage area and more functionality at lower costs. In this paper, a genetic algorithm-based SDN is presented for pandemic hospital localization. The number of coronavirus infected people of each city in Turkey is taken into consideration as well as the city distances in the ULAKNET data set within the Topology Zoo database. For the best localization of pandemic hospitals, the Dijkstra algorithm is used to best cover the cities where the coronavirus epidemic is at a minimum distance from the cities. In this paper, the number of controllers is set as 10, and the experimental results are given with maps and graphics.
Received: 31 August 2020, Accepted: 04 December 2020, Published Online: 25 December 2020
1. Introduction
This paper is an extension of work originally presented in 2019 4th International Conference on Computer Science and Engineering (UBMK) [1]. In this study, firstly, the coronavirus coefficients of the cities on a certain date are added to the data file of [1] in addition to the coordinates of each city in the Ulaknet data set within the Topology Zoo database. Secondly, the fitness function values are obtained by dividing the coronavirus coefficients of the cities in the selected solution set by the arithmetic averages, as well as the algorithm used to find the minimum distances of the incoming solution clusters to other cities. In this way, while developing random solutions during Genetic Algorithm (GA) generations, solution clusters at the minimum distance to cities are found based on Dijkstra Algorithm (DA), and the solution set with cities with a high number of coronaviruses become the optimum solution set. The aim is to find the locations of pandemic hospitals that are close to the cities on the map, have a high coronavirus coefficient, and best cover cities that need hospitals.
With the continuous development of information technologies, the Internet has turned into a complex and large-scale infrastructure that profoundly affects people’s working and lifestyle [2]. However, the complexity of the traditional network makes the networks difficult to manage. SDN resolves these issues based on the principle of separating the data layers. SDN enables easy management of the traditional network seperating data and control planes. By this way, SDN provides many benefits such as simplifying network management, improve network utilization efficiency, support network innovation, reduce network delays.
As the network structure expands, a single controller SDN architecture may be difficult to manage a comprehensive network. To increase the scalability and reliability of the network and to avoid a single point of failure, there is a need for a logically centralized [3], physically distributed multi-controller network architecture. In multi-controller architecture, the Controller Placement Problem (CPP) is encountered. With CPP, the number and location of the controllers have a large impact on end-to-end latency reduction and network performance within the network.
2. Related Works
CPP has been intensely studied in the literature. Papers [4-16] explain the different CPP problems in detail for the proper single controller or multiple distributions of controllers and clarify the benefits of SDN.
In [4], the authors present as a solution to CPP and minimize the response delays for a large-scale network using a hybrid GA-PSO algorithm. Using the hybrid algorithm, the best position is obtained in a shorter time compared to GA.
In [5], the authors solve the distributed controllers’ placement problem and apply different scenarios in CPP for the distribution of the network load.
CPP with different aspects such as transmission delay, control plane utilization, and controller workload distribution are studied in [6]. A hybrid gradient descent optimization method with GA is implemented in two different network scenarios and effectively established the balance between the use of the control plane and the network response time.
In [7], the authors examine different controller placement models and their accuracies. Other goals of the study include maximizing the controller capacity, reliability, flexibility while minimizing the network latency, deployment cost, and energy consumption. Concerning CPP, the authors present a feature selection technique adopted in the literature to illustrate the search methods used by the controller placement models.
In [8], the authors present a hierarchical K-median algorithm for CPP. Also, by dividing the large number of single-controller network SDN, they attempt to provide efficient control of the area. They also consider the load balancing.
In [9], the authors consider the packets among the controllers and switches for wide area networks, argue that it is important to reduce the propagation delay. They propose a new approach called the Cluster-Based Network Division Algorithm (CNPA). CNPA divides the network into subnets in steps to shorten the propagation delay between the controller and the controller can place the associated switches to a sub-network. They aim at minimizing the network latency, maximizing reliability and durability, minimizing distribution cost and energy consumption. The solutions are searched for CPP with different purposes. They focus on cooperation between controllers for CPP, cost awareness with the use of multiple controllers, and increasing the number of parameters to be based on optimization.
In [10], the authors review the CPP, and analyze the solution techniques and their limitations. The solution techniques are generally based on objective functions. In obtaining the optimum solutions, various factors such as propagation latency between switches and controllers and constraints such as the capacity of controllers and switches are considered.
In [11], the authors present a cost-effective real-time monitoring and recording system to combat the crime committed on the Internet using SDN architecture. In [12], the authors implement a small scale and low-cost SDN design. The performance of two different load balancing algorithms (Round Robin and Dijkstra) is investigated in [13] using round-trip times for addressing the SDN load balancing problem.
In [14], the authors examine the factor of controllers’ load into the problem of the controller placement. For this, they define the Capacitated Controller Placement Problem (CCPP). The evaluation shows that the new strategy can significantly reduce the number of required controllers and reduce the load of the maximum-load controller.
In [15], the authors propose a new mathematical model for the CPP in SDNs. The goal of the model is to minimize the cost of the network while considering different constraints. The simulation results show that the model can be used to plan small scale SDN.
In [16], a new expansion model is presented to introduce the network operators plan and to update the SDN infrastructure. For a given network design and switches, the model finds how many, where and which controllers to install to (re-)design the topology of the new network.
The coronavirus also called COVID-19 or SARS-CoV-2, is one of the worst pandemics in recent history [17]. Especially, in recent months, the financial and the social impacts of the COVID-19 pandemic on our lives and economies are very destructive. To stop the spread of COVID-19, billions of people need a vaccine for coronavirus. Many research teams in companies and researchers in universities try to develop vaccines against COVID-19. But it might not be physically possible to make enough vaccine for everyone and optimistically it could be available in 2 year-time but as scientists say it will be a while before the vaccine is as useful as hoped. To this end, governments take measures such as buy blood test kits, rules for wearing masks and social-distancing, flexible working hours, online schools, severe lockdowns, etc. to slow down the spread of COVID-19. Apart from these and besides, governments need effective resource management and coordination. Especially, the key challenges where to place the pandemic hospitals and what should be the number of pandemic hospitals to be placed in a city should be effectively addressed by governments.
The main contribution of this paper is the introduction and evaluation of an SDN-based approach for the best hospital localization against COVID-19. We propose and explain a GA with the DA method that considers the number of coronavirus patients of cities to reduce the insertion end-to-end delay controller. The proposal uses the ULAKNET data set for Turkey and provides the most appropriate placement for the pandemic hospitals. We experimentally show the controllers are located at the closest distance to all other cities and close to the places where the coronavirus outbreak is common, thus reducing the end-to-end delay significantly. Our approach can be used to analyze, validate, and to evaluate the localization of the countries’ pandemic hospitals’ demand. If more data support is satisfied especially at the level of villages, towns, cities, and districts better prediction models can be obtained.
3. Technical Concepts
3.1. Software-Defined Network (SDN)
SDN is a new networking paradigm emerging to improve the performance of existing network architecture [18]. SDN, by separating the control plane from the data plane, the switches become simple forwarding devices. Network control of SDN is provided with the help of a controller or controllers with logical management in the control layer. Controller, applications, network policy, network configuration, topology management, finding connections, is responsible for the process flow table entry. SDN architecture data, consisting of control and application layers. The communication between the layers is carried out by North and Southbound interfaces. The basic architecture of SDN is shown in Figure 1.
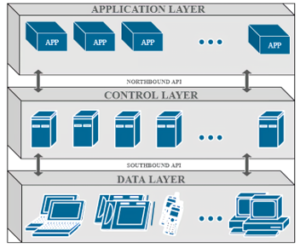
Figure 1: The Basic SDN Architecture
3.2. Multiple Controller Placement Problem
A single controller in the control layer of the SDN architecture may not be sufficient in large-scale networks. There are disadvantages such as a single checkpoint being a single point of failure, bottleneck, and delay in response time. A multi-controller structure is recommended to solve such problems in SDN. After deciding the number of controllers, the significant challenges of multi-controller SDNs to be addressed to increase performance are determining the locations of controllers and determining the number of controllers per module by evaluating the latency.
3.3. Genetic Algorithm (GA)
GA has three steps (selection, crossover, mutation) to have a successful gene. GA process starts with randomly selected individuals. After creating the initial population, it is necessary to determine the fitness function value of each individual. The value of the fitness function is directly proportional to the proximity to the solution according to the type of problem. The higher the fitness function value, the higher the chance of an individual to survive and to reproduce. Individuals that have high fitness function values are selected for crossover. In crossover step, two individuals are selected as a parent and then one or more individuals are produced using different types of crossover operators such as one-point, multi-point, uniform, etc. Then mutation is applied in a probabilistic manner to enrich the gene pool. After these steps, a new population is produced. This procedure is repeated until a specified termination condition is satisfied. The block diagram of GA is given in Figure 2.
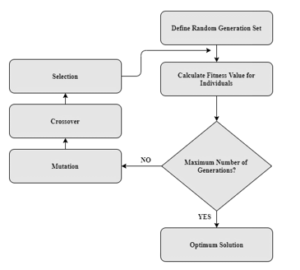
Figure 2: Genetic Algorithm Block Diagram
3.4. Dijkstra Algorithm (DA)
DA is one of the most commonly used algorithms for the shortest path searching. The purpose of DA is to find the shortest distance between nodes in a graph [19]. It uses the greedy search principle as it aims to find the most suitable solution at every step while searching for solutions to the problems it applies to. The input of the DA is the weighted graphs and its output is the shortest path from the origin node to each vertex in the graph.
4. Experiments
In this paper, the hospital placement problem for the coronavirus epidemic affecting the whole world is solved in the SDN infrastructure (see Figure 3) by applying GA and DA approach. In addition to the coordinates of the cities, the coronavirus parameter of each city is added to the ULAKNET database file used.
The ULAKNET data set for Turkey in the Topology Zoo database [20] shown in Figure 4 is used. The study is carried out with Python codes on a machine with Linux based Ubuntu 16.04 operating system, 8 GB RAM, and Core i7, 2.0 GHz processor. The Pycharm platform is used as a compiler for the Python codes.
First, a fixed node map for Turkey using latitude and longitude values in ULAKNET data sets is illustrated in Figure 5. In Figure 5, each city is also represented by a number. For example, 74 number is assigned for İstanbul. The data for İstanbul is as follows:
<node id=”74″>
<data key=”d29″>1</data>
<data key=”d30″>41.01384</data>
<data key=”d31″>Turkey</data>
<data key=”d32″>Red Colour</data>
<data key=”d33″>74</data>
<data key=”d34″>28.94966</data>
<data key=”d35″>Istanbul</data>
</node>
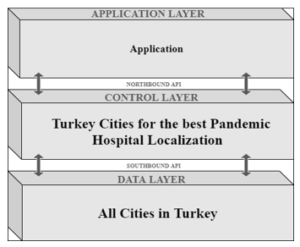
Figure 3: The SDN-based Structure Used for the Best Pandemic Hospital Localization
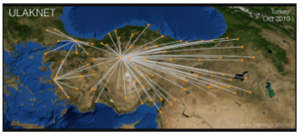
Figure 4: ULAKNET Turkey Map
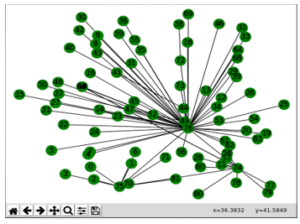
Figure 5: ULAKNET Turkey Map Before the Placement of Multi-Controllers
According to the coordinate data of the cities, the minimum distances of each city to other cities are calculated with DA. A distance matrix obtained for each city is shown in Figure 6.
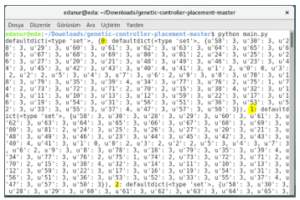
Figure 6: A City Distance Matrix
The number of coronavirus patients is assumed as the coronavirus coefficient of a city. So, the corresponding coronavirus coefficients are added for each city and are shown in Figure 7. The coronavirus patients’ data of the cities of Turkey given in Figure 7 are the patients of the date 03/04/2020 [21]. For example, the city number 74 corresponds to Istanbul, and 76 corresponds to Ankara while the coronavirus coefficients of Istanbul and Ankara are 12231 and 860, respectively.
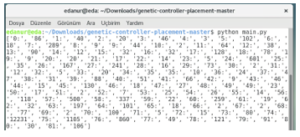
Figure 7: The Coronavirus Matrix of the Cities of Turkey
The parameter setting of GA are listed in Table 1 and the flowchart for the hospital placement problem is presented in
Figure 8.
Table 1: GA parameter setting used in the simulations
| Parameters | Value |
| Individuals in the Population | 100 |
| The Number of Controllers (Hospitals) | 10 |
| Parent Percentage | 0.1 |
| Mutation Rate | 0.05 |
| Random Selection Rate | 0.01 |
| The Number of Generations (Iterations) | 1000 |
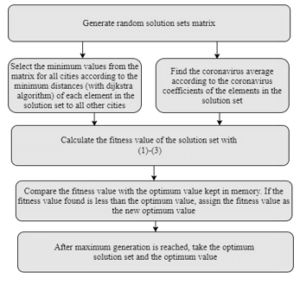
Figure 8: Flowchart for the Hospital Placement Problem
Using the parameters listed in Table 1, 100 random 1×10 solution clusters are created. The randomly generated solutions are illustrated in Figure 9.
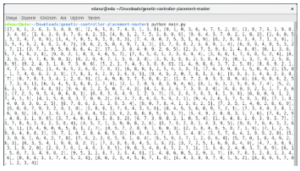
Figure 9: Random Startup Solutions
The fitness of each the random solution sets is calculated using the fitness function. The fitness function has two purposes:
- Choosing solution clusters at minimum distances to cover all cities on the map,
- Choosing solution sets that have higher coronavirus coefficients.
The fitness values of all cities are calculated according to the distance matrix created for each city according to the DA. The city in the random solution set that has a minimum distance from all other cities is selected. After calculating the optimum distance to all cities according to the minimum values in the solution set, the average of the distance from the solution set to all cities is calculated.
For the algorithm used in the simulation: n is the number of the controller (number of pandemic hospitals to be established) and set as 10. xi is the solution set where i = 1, 2, 3, …, 10. h is the weighted graph of cities. f (x, h) is the Dijkstra function. A is the calculated value of the selected solution set with the shortest distances to all other cities. L_Opt and G_Opt are variables for Local Optimum and Global Optimum, respectively.
Equation (1) shows the arithmetic mean of the coronavirus coefficients of the elements in the solution set and (2) takes the average of the values produces according to which of the elements in the selected solution set for each city in the graph of the cities is closest. (2) calculates for the 100 solution sets. After (1) and (2) are calculated, the local optimum value of the selected solution set is obtained by dividing (1) by (2) and (3).

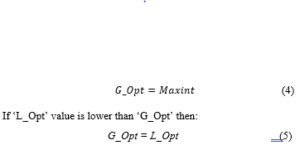
Initially, a global optimum value is defined by (4). In each iteration, the global optimum value is compared with the value in (3). If the value in (3) is better than the global optimum value, the new global optimum value will now be that value (5).
The aim of the study is to reach the optimum value when the average distance is minimum and the coronavirus arithmetic average is maximum. Thus, two criteria are taken into consideration for the establishment of pandemic hospitals:
- Solution clusters that are close to the cities on the map and will cover the maximum number of cities
- Solution clusters consisting of cities with a high number of coronavirus and needing hospitals more
Each experiment is run for 1000 iterations. After maximum iteration is reached, the optimum solution set and optimum value are taken. 30 experiments are conducted in the study. The best fitness values obtained of the 30 experiments are shown in
Table 2. The number of the experiment and the solution set (cities) obtained during the experiment are also listed in the first and the second column of the Table 2.
The iterations and the convergence graph of the 9th experiment is shown in Figures 10 and 11, respectively. The proposed algorithm is converged faster, as iterations proceed the output gets closer to the optimum value at every iteration.
Each number in the solution set that gives the global optimum value corresponds to a city and represents the most suitable cities for the construction of pandemic hospitals. In Figure 12, the cities obtained from the 9th experiment, which gives the most optimum solution set in Table 2, are shown on the map obtained from the ULAKNET data set within the Topology Zoo database. According to the results we have obtained, the pandemic hospitals that should be placed in the cities [74, 57, 8, 28, 0, 39, 15, 74, 18, 45]. The names of these cities obtained are as follows:
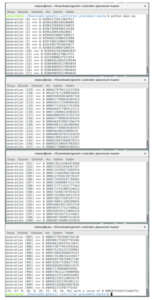
Figure 10: The Optimum Solution for the 9th Experiment
Table 2: The Experimental Results
|
Exp. No
|
Cities | Best Fitness Value |
| 9 |
[74, 57, 8, 28, 0, 39, 15, 74, 18, 45] |
0.0002672554771464751 |
| 12 |
[79, 24, 37, 76, 40, 1, 74, 75, 58, 39] |
0.0003217251423851137 |
| 1 |
[76, 74, 57, 58, 74, 38, 28, 39, 75, 40] |
0.0003219547001035476 |
| 14 |
[60, 42, 39, 49, 12, 40, 74, 24, 76, 33] |
0.00032287621623980107 |
| 21 |
[65, 10, 24, 76, 74, 75, 13, 44, 63, 58] |
0.0003229917768039527 |
| 11 |
[28, 57, 24, 43, 75, 45, 38, 19, 76, 74] |
0.00032310742011823983 |
| 5 |
[51, 74, 52, 62, 53, 57, 58, 38, 7, 76] |
0.0003235352480868282 |
| 8 |
[74, 24, 63, 57, 40, 3, 42, 76, 79, 59] |
0.0003235708226569537 |
| 28 |
[74, 40, 58, 24, 76, 7, 57, 54, 75, 34] |
0.0003238789470047675 |
| 17 |
[24, 58, 18, 75, 76, 37, 40, 7, 74, 39] |
0.00032415194841603587 |
| 18 |
[18, 75, 7, 57, 58, 37, 44, 74, 24, 74] |
0.00032422337693777505 |
| 20 |
[76, 74, 60, 74, 14, 2, 22, 40, 57, 78] |
0.00032422337693777505 |
| 10 |
[44, 18, 76, 34, 58, 5, 74, 74, 30, 34] |
0.0003243383497664764 |
| 22 |
[76, 24, 74, 74, 27, 37, 38, 58, 75, 57] |
0.0003245685402205335 |
| 13 |
[75, 60, 74, 39, 30, 40, 57, 27, 24, 74] |
0.0003247990576496674 |
| 29 |
[18, 40, 67, 63, 24, 81, 64, 25, 74, 76] |
0.00032491443919767794 |
| 19 |
[64, 38, 24, 75, 76, 74, 62, 16, 39, 50] |
0.0003249690401117191 |
| 15 |
[74, 24, 40, 49, 16, 59, 11, 2, 76, 7] |
0.0003250861038869755 |
| 7 |
[75, 76, 39, 74, 24, 57, 46, 49, 7, 63] |
0.00032526107622384904 |
| 30 |
[57, 24, 75, 58, 40, 74, 76, 7, 27, 74] |
0.0003258893348427155 |
| 23 |
[74, 39, 49, 57, 68, 38, 7, 75, 76, 58] |
0.00032590791780073814 |
| 2 |
[76, 58, 35, 74, 37, 57, 75, 60, 17, 27] |
0.00032623346296820944 |
| 24 |
[7, 1, 27, 74, 76, 75, 39, 24, 58, 40] |
0.0003263054392941361 |
| 16 |
[74, 39, 40, 60, 57, 38, 74, 75, 34, 27] |
0.00032708917158037114 |
| 6 |
[24, 81, 0, 57, 37, 41, 74, 74, 39, 75] |
0.0003281787392685552 |
| 3 |
[58, 75, 67, 76, 55, 31, 74, 7, 39, 60] |
0.00032819733296483107 |
| 26 |
[76, 52, 60, 76, 24, 27, 23, 74, 58, 7] |
0.00032819733296483107 |
| 4 |
[58, 9, 76, 57, 49, 39, 61, 79, 74, 63] |
0.0003696841205081152 |
| 27 |
[27, 37, 39, 57, 39, 80, 74, 76, 51, 7] |
0.00037254145084697076 |
| 25 |
[39, 58, 17, 75, 76, 75, 57, 7, 40, 24] |
0.0005330035817840696 |
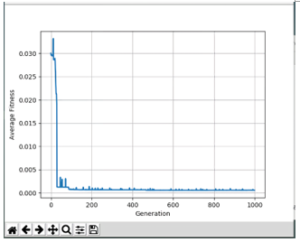
Figure 11: The Convergence Graph of the 9th Experiment
74: İstanbul;
57: Kocaeli;
8: Çanakkale;
28: Bilecik;
0: Denizli;
39: Ordu;
15: Hatay;
74: İstanbul;
18: Erzurum;
45: Kayseri
and demonstrated in the SDN structure in Figure 13. The observation is that in the solution set, there are two Istanbul cities. This corresponds Istanbul needs two pandemic hospitals. However, the capital Ankara is not in the obtained cities. But 24 of 30 experiments obtained Ankara. The cities are not obtained based on their economic, social, and cultural levels. The values obtained from the experiments should be evaluated together with the results obtained from the algorithm of all cities in the solution set, not as a single city.
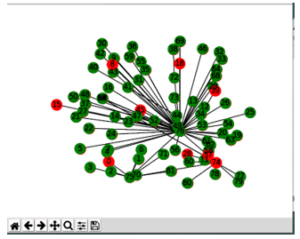
Figure 12: The Best Hospital Localization
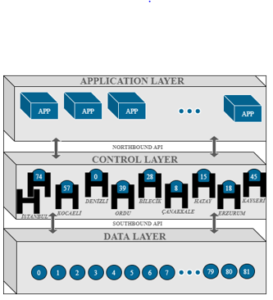
Figure 13: The Obtained Cities for the Pandemic Hospitals in the SDN Structure
5. Conclusion and Future Study
In this paper, we have studied the placement of the pandemic hospitals which should be established against the coronavirus. As it is not possible to establish the pandemic hospitals in every desired location due to the high cost of setting up the pandemic hospitals, the placement of the pandemic hospitals is of great importance. To solve the pandemic hospital placement problem, in this paper, an SDN-based solution has been proposed by applying a GA with DA method according to the distance and coronavirus parameters to the maps obtained from the ULAKNET data set. From the experimental results, the hospital location found has the closest distance to cover all cities in the selected data set and in places where there is a high coronavirus. Ten pandemic hospitals are placed with maximum coverage.
We need more data at the level of villages, towns, cities, and districts. But now, data for coronavirus in many countries of the World are still limited and even it is very difficult to get the shared data of the countries. Such better data will help us to achieve better prediction models as future work.
Conflict of Interest
The authors declare no conflict of interest.
Acknowledgment
We would like to thank the Erciyes University Scientific Research Projects Coordination Unit (ERU/BAP). This work is supported by the Erciyes University Scientific Research Projects Coordination Unit (ERU/BAP) under project codes FYL-2019-9299.
- B. Babayiğit, B. Ulu, E.N. Hasçokadar, “Solving multi-controller placement problem in software defined networks with a genetic algorithm,” in 2019 4th International Conference on Computer Science and Engineering (UBMK), Samsun, Turkey, 666–670, 2019, doi: 10.1109/UBMK.2019.8907199.
- J. Lu, Z. Zhang, T. Hu, P. Yi, J. Lan, “A survey of controller placement problem in software-defined networking,” IEEE Access, 7, 24290–24307, 2019, doi: 10.1109/ACCESS.2019.2893283.
- Z. Guo, R. Liub, Y. Xuc, A. Gushchind, A. Walide, “STAR: Preventing flow-table overflow in software-defined networks,” Computer Network, 125, 15–25, 2017.
- L. Liao, V.C.M. Leung, “Genetic algorithms with particle swarm optimization based mutation for distributed controller placement in SDNs,” in IEEE Conference on Network Function Virtualization and Software Defined Networks (NFV-SDN), 1-6, 2017, doi: 10.1109/NFV-SDN.2017.8169836.
- N. Mouawad, R. Naja, S. Tohme, “Optimal and dynamic SDN controller placement,” in 2018 International Conference on Computer and Applications (ICCA), 1-9, 2018, doi: 10.1109/COMAPP.2018.8460361.
- V. Huang, G. Chen, Q. Fu, E. Wen, “Optimizing controller placement for software-defined networks,” in International Conference on Cloud Computing and Big Data, Macau, China, 224-232, 2019.
- I.O. Adebayo, M.O. Adigun, P. Mudali, “Feature selection strategies for the controller placement problem in SDNs: A Review,” in 2018 International Conference on Advances in Big Data, Computing and Data Communication Systems (icABCD), Durban, South Africa, 1-5, 2018, doi: 10.1109/ICABCD.2018.8465404.
- H. Kuang, Y. Qiu, R. Li , X. Liu, “A hierarchical K-Means algorithm for controller placement in SDN-based WAN architecture,” in 2018 10th International Conference on Measuring Technology and Mechatronics Automation (ICMTMA), Changsha, 263–267, 2018, doi: 10.1109/ICMTMA.2018.00070.
- G. Wang, Y. Zhao, J. Huang, W. Wang, “The controller placement problem in software defined networking: a survey,” IEEE Network, 31(5), 21-27, 2017, doi: 10.1109/MNET.2017.1600182.
- A.K. Singh,S. Srivastava, “A survey and classification of controller placement problem in SDN,” International Journal of Network Management, 28(3), 1-25, 2018, doi:10.1002/nem.2018.
- B. Babayigit, S. Karakaya, “Cost-effective logging using SDN architecture,” in International Conference on Advanced Technologies, Computer Engineering and Science , Karabuk, Turkey, 2018.
- B. Babayigit, S. Karakaya, B. Ulu, “An implementation of software defined network with Raspberry Pi,” in 2018 IEEE 26th Signal Processing and Communications Applications Conference, Izmir, Turkey, 1-4, 2018, doi: 10.1109/SIU.2018.8404546.
- B. Babayigit, B. Ulu, “Load balancing on software defined networks,” in 2nd International Symposium on Multidisciplinary Studies and Innovative Technologies, ISMSIT 2018 , Kizilcahamam, Ankara, Turkey, 1-4,2018, doi: 10.1109/ISMSIT.2018.8567070.
- G. Yao, J. Bi, Y. Li, L. Guo, “On the capacitated controller placement problem in software defined networks,” IEEE Communications Letters, 18(8).1339-1342, 2014, doi: 10.1109/LCOMM.2014.2332341.
- A. Sallahi, M. St-Hilaire, “Optimal model for the controller placement problem in software defined networks,” IEEE Communications Letters, 19(1), 30-33, 2015, doi: 10.1109/LCOMM.2014.2371014.
- A. Sallahi, M. St-Hilaire, “Expansion model for the controller placement problem in software defined networks,” IEEE Communications Letters, 21(2), 274-277, 2017, doi: 10.1109/LCOMM.2016.2621746.
- www.who.int/covid-19, Access Date: June 2020.
- Y. Zhang, L. Cui, W. Wang, Y. Zhang, “A survey on software defined networking with multiple controllers,” Journal of Network and Computer Applications, 103, 101-118, 2018.
- E. W. Dijkstra, “A note on two problems in connexion with graphs,” Numerische Mathematik, 1(1), 269–271, Dec 1959. [Online]. Available: https://doi.org/10.1007/BF01386390
- Topology Zoo. www.topology-zoo.org. Access Date: June 2020.
- https://ajansspor.com/haber/hangi-ilde-ne-kadar-corona-virus-vakasi-var-vefat-sayilari-362702, Access Date: June 2020.