
Implementation of a Journalist Business Intelligence in Social Media Monitoring System
Volume 5, Issue 6, Page No 1517-1528, 2020
Author’s Name: Abba Suganda Girsanga), Sani Muhamad Isa, Natasya, Megga Eunike Cristilia Ginzel
View Affiliations
Computer Science Department, BINUS Graduate Program – Master of Computer Science, Bina Nusantara University, Jakarta, 11480, Indonesia
a)Author to whom correspondence should be addressed. E-mail: agirsang@binus.edu
Adv. Sci. Technol. Eng. Syst. J. 5(6), 1517-1528 (2020); ![]() DOI: 10.25046/aj0506182
DOI: 10.25046/aj0506182
Keywords: Journalist, Social Media, Business Intelligence, Monitoring

Export Citations
The need to update the news at this time is very important. Journalists have responsibilities as their job. Apart from conveying the correct news to the public, they must also deliver it quickly. Journalists who are tasked as news seekers must always be updated about the latest news that is viral, therefore a journalist must be fast and reliable in finding news sources. With this research, it can help journalists work in finding news sources by utilizing public information from Twitter, as one of social media platforms. Social media is considered a source of public information that can involve everyone. In previous research, a system has been created to collect tweets from several news accounts on Twitter which are then grouped into various themes based on cosine similarity. Continuing from the results of previous research, this research obtained data from crawlers stored in the database server can be displayed in the form of a report on a business intelligence application dashboard using a data warehouse. Thus, there is some information that can be used to make decisions. This information includes how much news engagement is, how active users are in commenting, trending posts categories, etc. The results of the research will show how much news is generated based on users who actively like, comment and share news on news accounts that are on Twitter. These results will be used as a reference by journalists to cover live news that is viral.
Received: 12 November 2020, Accepted: 10 December 2020, Published Online: 21 December 2020
1. Introduction
Along with technological developments, the distribution and exchange of information are becoming faster and kept growing. Social media is the answer towards conveying information quickly in effective and efficient ways, reaching many people. It is an open media that grants access to all people all over the world, regardless of age, occupation, or social level. Social media such as Twitter, Facebook, MySpace, YoutTube, Flickr, and others have been growing at a tremendous rate and the adoption rate of such media has been skyrocketing, which in turn, has delivered astronomical numbers of users in less than 10 years [1].
Through social media, people can create or participate in the making of every content that can be shared and discussed. The freeness and openness which social media offers were very different and more convenient, compared to other media.
In 2012, six years after Twitter got launched, Twitter had already 140 million active users and was still growing. There were 340 million tweets uploaded in a day [2], which creates a high possibility that social media will give a significant impact on gaining and reaching a lot of worthy news from a lot of people. Aware of this opportunity, we realize the worthy news that is obtained can give a huge impact to journalism. But in this case, social media will require a monitoring system to find out the latest news, which is currently discussed in society through social media. Therefore, journalists will be able to find the latest news effectively and efficiently. Monitoring directly through social media will also help journalists to understand the bigger picture of the latest trending news. The story can be told in many different points of view and also accompanied by several other people’s opinions. Of course, social media also has the possibility of spreading false information or hoax news, but this is where the role of journalists is needed. Journalists can help the public to identify and inform the true version of the news or news that is trending.
Social media will become a bridge to connect journalism with public stories and opinions which contain worthy news. There is little doubt that social media has an important role to play in the future of journalism and that it has functioned to be the source of ideas and information [3].
2. Related Work
Social media technology takes many forms, including internet forums, weblogs, social blogs, microblogging, wikis, podcasts, photos or images, videos, ratings and social bookmarking. By applying a set of theories in the areas of media research (social presence, media wealth) and social processes (self-presentation, self-disclosure) Kaplan and Haenlein created classification schemes for different types of social media in their article Business Horizons published in 2010. According to Kaplan and Haenlein there are six types of social media collaborative projects, blogs, content communities, social networking sites, virtual game worlds, and virtual social worlds [4].
Social media has vast growth and clearly matters for society [5]. After interviews with 53 digital journalists, some public Figureures, extra media organizations, opinion leaders, and others in social media were shown to affect news production [6] Journalists use social media to find story leads and to share their work with audiences, which has made journalism more interactive [7].
As one of social media platform, Twitter can be seen as a modern version of person-on-the-street interviews, or even a journalistic stand-in for actual polling. While this was never a reliable way of gauging public opinion, the fact that Twitter makes these vox populi searchable and embeddable vastly reduces the effort that it takes to collect and call upon them. Its use has proliferated to the point that journalists see Twitter as a reliable source of news [5]. An online survey for US journalists with participation of 212 journalists, shows that journalists who use Twitter, potentially causing them to dismiss information that many of their colleagues identify as newsworthy [8].
Investigation in 2012, presidential primary which was the first presidential election where Twitter was used as candidate and party reactions for what was broadcasted in news media, which makes Twitter become a field of new sources for journalistic content [9]. On London Olympic 2012, @London2012 account served as the official account of London Olympic and became another news source for journalistic [10]. Austria’s national selection campaign proved that Twitter feeds significantly increase the parties agenda-building power, compared with the impact of parties’ news releases [8].
Analyzing the content of tweets in Twitter has also been done outside the journalistic view however performing a similar function. In the context of promoting biking, hashtags become the key point of Natural Language Processing (NLP) tools implementation of the study. Generally, NLP refers to the process of understanding how each word correlates to each other to produce a certain meaning, from the text grammar [11]. In this study, selected hashtags are determined in the first place to assemble the dataset associated with bike commuting. By performing data cleaning to the raw data from Twitter, the tweet frequency could be deduced by a text mining process. To further infer the meaning behind the tweets, sentiment analysis is conducted to determine the polarity of opinions regarding biking. The results show a majority of positive remarks. Biking communities and other related instances could then benefit from the result of the analysis to generate ideas in stimulating more people to bike by understanding the past biking motivations [12]. This also further elaborates how Twitter is a major platform to gain insights on the public’s interests.
Another example of tweet classification, is used to analyze user feedback and its impact on a business. The analysis was based on influential term groups that are determined specifically for each different type of business. Then the relationship between the content of tweets and real-world outcomes could be established [13].
Processing data from Twitter means relying towards short texts as tweets only consist of very brief messages. This might be one of the causes of inaccuracy when making inference or classification based on tweets. Researchers on the study of Arabic Twitter users classification also concerned about the issue when performing classification using Twitter data [14]. There are several methods that could be implemented in reducing that by selecting the appropriate method. One of them would be a support vector machine or known as SVM (Support Vector Machine) [15]. In terms of NLP, SVM is one of the machine learning models that is often used. Category classification is the main purpose of SVM implementation [11]. In relation to journalism, trending topics can be classified using SVM. Another study has implemented SVM in classifying tweets into real news or rumour. The consideration that took part in the classification includes the content of the tweet, information about the user that posted the tweet and like numbers [16].
With the same context of this paper, a research has been done on news classification [17]. The news are classified based on religion, business, entertainment, law, health, motivation, sports, government, education, politics and technology as the chosen topics. Although different machine learning approaches are implemented in the research, overall, Naive Bayes Multinomial (NBM), as one of the algorithms for classifying texts, achieved the best performance with 77.47% of accuracy. However, the result of the news data classification only focuses on segmenting the news and does not further provide insight for news trend analysis.
By making use of the data from social media, trend analysis can be done further with the implementation of business intelligence through designing the data warehouse. The process of designing the data warehouse has been introduced in a study which consists of data preprocessing with the objective to clean the data obtained from two social media, Facebook and Twitter altogether, then determining the facts and dimension [18]. Dimension tables are results of denormalization and fact tables consist of the keys that lead to each dimension, along with fact attributes [19]. In that study specifically, before facts and dimensions are determined, as there are two origins from where the data is being collected, data mapping should be performed in ensuring a valid integration of data. The next step would be the transform and load process to complete the whole Extract, Transform and Load (ETL) procedure before proceeding into the data warehouse.
Another research involving the integration of business intelligence on social media analytics has been explored in the case of brand personality analysis [20]. The details about the brand followers, tweets related to the brand, reviews from the employee of the respective brand, tweets posted by the brand
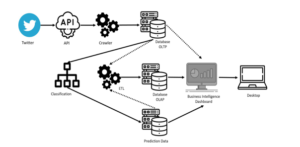
Figure 1: Business Intelligence Architecture
themselves comprise the dataset used in the research. Classification of the data into five brand personality categories supports the analysis on the chosen brands. The researchers suggested that decision making strategies can be improved with a sufficient business metrics measurement, in this context, gained from the activities associated with the brand on social media. This result could be achieved as trends are provided within social media data and useful for many types of organization [21]. Hence, classification of social media data incorporated with business intelligence could present more insight for enhancement in business strategies.
3. Proposed Method
In this research, a Business Intelligence application will be built into the architecture shown in Figure 1.
The following steps should be taken to develop the system as shown on the image above:
3.1. Data collection
At this data collection stage, there are processes including:
- Collecting data from selected Social Media Platforms such as Twitter through the Social Media Application Programming Interface (API) available on each platform.
- Data retrieval will be carried out periodically by crawlers who have been created with the Social Media API Token input which is useful for authentication and authorization in data retrieval.
- Thus, the results of data retrieval will be saved on the database as raw data.
3.2. Content Analysis
At this stage of content analysis there is an intermediate process including:
- Retrieving data for content analysis from each data on each Social Media platform.
- The data taken is then processed for text classification using SVM into 10 news categories.
- The results of text processing will be stored in the database as analysis data.
3.3. Data warehouse process
At this stage of the data warehouse process, there are processes including:
- Retrieving data for the ETL process that comes from the results of content analysis (in the content analysis database) and the results from the crawler (in the raw data database).
- The data that has been loaded will then be carried out by ETL, such as counting comments, posts, likes, and so on.
- Data resulting from the ETL process is then stored in the data warehouse.
3.4. Client Side
On the client side, there are several processes that are carried out so that the application dashboard can be accessed by users, including:
- API is used as a bridge between applications and data (both raw data and finished data in the data warehouse)
- The application will request data to the API by inputting the API Token as authorization and authentication, so that with this API people are not able to access data directly.
4. Analysis Results
4.1. Setting Variables
There are some variables used in this study as shown Table 1. In Figure 2 shown the ERD (Entity Relationship Diagram) from the transaction database of the scrapping system or can be called OLTP (Online Transaction Processing), before ETL (Extract, Transform, Load) process.
Table 1: Setting Parameter
| Variable | Value | Description |
| Number of Twitter Account | 10 | Kompascom, Detikcom, BeritaSatu, MediaIndonesia, Tempo.co, BreakingNews, TMCPoldaMetro (Traffic Management Center Polda Metro), MNCNewsChannel (Media Nusantara Citra News Channel), TribunIndonesia and CnnIndonesia |
| Duration | 20 days | Ranges from 27th November 2020 – 17th December 2020 |
| Batch | 8/days | Each batch has a three-houred range |
| Threshold Cosine | 0.7 | For measuring similarity of two comments |
| Threshold number comments | 10 | If number comments more than 10, it can be considered as top news |
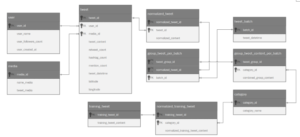
Figure 2: ERD
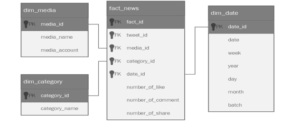
Figure 3: Star Schema
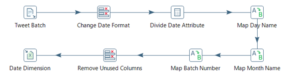
Figure 4: Date Dimension
4.2. ETL Process
In Figure 2 shown the Star Schema from OLAP (Online Analytical Processing), after ETL (Extract, Transform, Load) process. During the tweet extraction, when the time has entered the new batch, the datetime is directly inserted into the database in the server using a Python script. In order to generate the date dimension as shown in the star schema, the date obtained from the tweet extraction which started from 27th November to 17th December 2020 and shown as Tweet Batch data in Figure 3, is processed further using Pentaho. In Pentaho, the datetime format requires conversion as an error is encountered on the existing datetime from the database. Afterwards, the datetime is then divided into days, week, month, year, and batch. Week and year are represented in numbers, whereas days and month are mapped to their corresponding names. Batch itself is obtained from the hour of date, where it is then mapped into batch numbers ranging from 1 to 8. Date dimension is finally created after removing unused columns that are only used for processing purposes but not necessarily needed in the date dimension.
4.3. Performance Analysis
Each three hours, called a batch, data is evaluated. The batches are at 0-3, 3-6, 6-9, 9-12, 12-15, 15-18 and 21-24 having eight batches in total for each day as shown in Table 2. Table 3 showed tweets distribution for each category after classification with SVM. Table 4 showed the top three categories in each batch on the first day of extraction.
Table 2: Batch Time Detail
| Batch | Created |
| Time | |
| 1 | 00.01-03.00 |
| 2 | 03.01-06.00 |
| 3 | 06.01-09.00 |
| 4 | 09.01-12.00 |
| 5 | 12.01-15.00 |
| 6 | 15.01-18.00 |
| 7 | 18.01-21.00 |
| 8 | 21.01-24.00 |
Table 3: Tweets Distribution
| Category | Number of news |
| Economy | 11 |
| Health | 10 |
| Entertainment | 4137 |
| Culinary | 0 |
| Lifestyle | 317 |
| Automotive | 11 |
| Politics | 1991 |
| Sport | 0 |
| Technology | 284 |
| Travel | 0 |
| Total | 6761 |
Table 4: Distribution Top News in First Day
| Day | Batch (Time) |
Number top news (Based on Shares) |
| Day 1 | Batch 1 | Entertainment, Politics, Automotive |
| Batch 2 | Politics, Entertainment, Lifestyle | |
| Batch 3 | Entertainment, Life, Politics | |
| Batch 4 | Entertainment, Politics, Lifestyle | |
| Batch 5 | Politics, Entertainment, Automotive | |
| Batch 6 | Politics, Entertainment, Automotive | |
| Batch 7 | Entertainment, Poliis, Technology | |
| Batch 8 | Politics, Entertainment, Lifestyle |
After all the data has been loaded to the data warehouse consisting of three dimensions, the data stored is transformed into a business intelligence dashboard. Figure 5, 6, 7, and 8 were shown as an overview and example of a business intelligence dashboard. Some insights that were taken based on chart analytics in the business intelligence dashboard in Figure 5, 6, 7, and 8 will be discussed further. Figure 5 and 6 shows the first part of the business intelligence dashboard which contains some analytics with higher quality information retrieval than Figure 7 and Figure 8, such as Total Number of Like, Comment and Share, Number of Share by Batch and Category, Number of Like, Comment, and Share by Category and Media, etc.
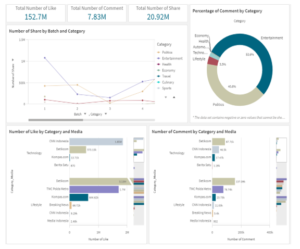
Figure 5: Business Intelligence Dashboard I
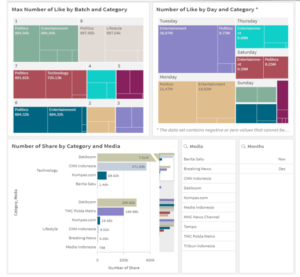
Figure 6: Business Intelligence Dashboard II
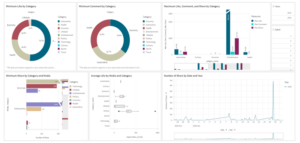
Figure 7: Business Intelligence Dashboard III
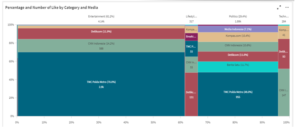
Figure 8: Business Intelligence Dashboard IV
![]()
Figure 9: Total Number of Like, Comment, and Share
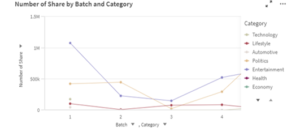
Figure 10: Number of Share by Batch and Category
Figure 9 shows a detailed screenshot on the total number of likes, comments and shares from the whole dataset. They represent the amount of engagement involved in Twitter for the specific period in 20 days. From the description in Figure 8, it could be seen that the total number of comments have the lowest value compared to the other two. This indicates how less frequently users leave replies on tweets they are interested in, whereas users mostly are prone to leave likes on a tweet as it requires less effort. Shares in another case require a moderate effort and in Figureure 10, it shows that entertainment is leading in batch 1. Data presentation in terms of batches, allows journalists to observe more about what kind of news attracts engagement of the public in specific time of day. Hence, it could provide understanding of what content type is at peak on certain hours, as well as how active users are participating in sharing information.
In terms of percentage, users have commented the most on tweets related to entertainment, politics and lifestyle. Considering the COVID-19 pandemic outbreak that started since the last month of 2019 and is still ongoing, the circumstances have impacted people’s lifestyle, one of them would be staying at home more. This resulted in Twitter users behavior which is exploring more regarding something fun despite being mostly at home, as represented by the entertainment category in the top first position in terms of comment percentage shown in Figure 11. Politics category with a close comment percentage, is positioned second. During the specific chosen time period of tweet extraction, there are several political issues that users are intrigued about, leading to higher interest in the topic. On the other side, the least percentage of comment is obtained from the economy category, indicating that the critical economic condition in the present is either quite a sensitive issue or nothing very significant, resulting in a fewer interaction between social media users.
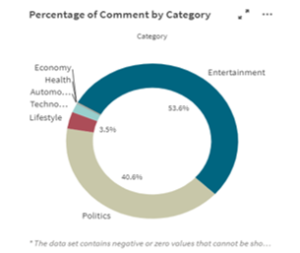
Figure 11: Percentage of Comment by Category
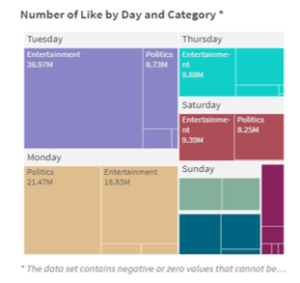
Figure 12: Number of Like by Day and Category
On a larger scale, the data can be further observed in terms of days. If batches tend to be very specific, days would display more generic data. This kind of data functions to assist and give insight on users’ engagement routines. From Figure 12, on a daily basis, mostly weekdays, Twitter users frequently like tweets related to entertainment. This indicates that the users’ daily interest is mostly fixed to the entertainment category. Hence, journalists can create more opportunities in searching for news that are able to raise high engagement from the public by being aware of entertainment updates during the specific period.
Number of likes within the politics category as shown in Figure 13 represented a quite unbalanced trend among the listed media. High engagement on politics category only appears to be most applicable for TMC Polda Metro, but specifically not much for Breaking News. There are two factors that allow this to occur: the number of tweets posted on that category or the attention that the tweet is able to acquire (by providing a more engaging tweet although the content is similar that triggers further response from other users, etc). Obviously if there are more tweets posted on the category, they will record a higher number of likes. However, this does not bring the possibility of having fewer tweets related to the category on the specific media, but still obtaining numerous likes down to the drain, as long as the tweets conform to the preferences of the users. In this case, Breaking News seems not to be focusing on the politics category. However, on the other side, it could be seen that most media did not cover much about the economy category. Based on this analysis, for more references regarding potential news on a specific category, journalists might be able to learn from the top media with the greatest number of likes, as the engagement towards a certain category does not apply to every media.
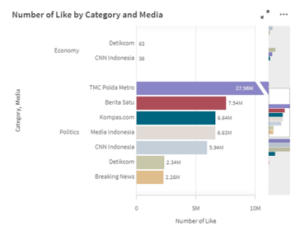
Figure 13: Number of Like by Category and Media
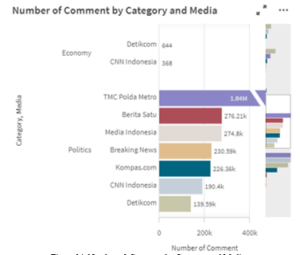
Figure 14: Number of Comment by Category and Media
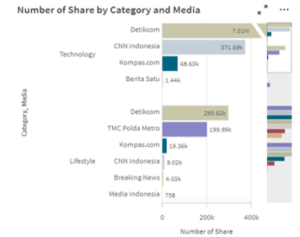
Figure 15. Number of Share by Category and Media
In Figure 14, it showed there is a significant difference between two categories for some media. The top Five Media and the others media in terms of the politics category, which was TMC Polda Metro, Berita Satu, Media Indonesia, Breaking News, and Kompas.com had the most commented tweet, which means people are more likely to reply and retweet these top five media. It also can be seen that at the certain time, there was no critical news related to the economy category. Comments can serve as discussion boards with unlimited sources and participants, limited by the need to validate information. Hence, journalists can dig and validate further information from the candidate news through comments. The comments will help provide more insight into news. If there was some big or high-quality news that occurred and uploaded to Twitter, it is speculated that the number of comments will be a balanced number for each media, either it will be a large amount of number or some range amount of number. Therefore, journalists can identify how worthy the news is but in more efficient and effective ways.
In Figure 15 can be seen the number of shares by category and media which can help decide trending news to look furthermore. Categories with a balanced number of shares in the chart have a bigger probability of containing a good quality and worthy of sharing news. With a lot of people sharing or retweeting the tweet, it concluded the news is well-known by a large number of both segmented users and other users on Twitter. Then, it will be useful for journalists to catch up nowadays trending topics in every category that is available.
Maximum like, comment, and share for each category will represent the most trending category discussed in society which can be seen in Figure 16. Showing the quantity data of the maximum engagement will be useful for journalists in defining the standard quality of news in the trending category news. At a certain time, Politics was the top trending category with 891.82k number of likes, 50.25k number of comments, and 394.71k number of shares. Therefore, when Politics hits the top trending in another certain time, the engagement’s amount can be compared to gain comparison and insight. Over time, journalists can define the average of maximum engagement of the trending category which contains high-quality tweets that are worthy of sharing especially as news. Meanwhile, the lower limits of maximum engagement can also be defined by these circumstances. Hence, journalists will be able to choose the best quality of news in the category and process the news.
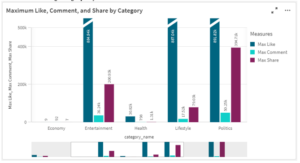
Figure 16. Maximum Like, Comment, and Share by Category
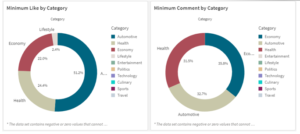
Figure 17: Minimum Like, Comment by Category
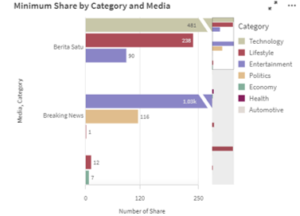
Figure 18: Minimum Share by Category and Media
Figure 17 and Figure 18 shows minimum count data of likes, comments, and shares by Category and Media which are able to help choose and exclude the certain category with the smallest percentage of likes and comments or smallest number of shares. With the standard defined, furthermore, the process of choosing the category and news will be easier. On the other hand, a big number of percentage and amount define that the certain category news was one of trending topics. In Figure 17 the entertainment category in Berita Satu minimum likes was 90, it can be seen there a large number difference to compare with the technology category. It concluded Berita Satu is not the right media to find entertainment news.
5. Conclusion
With processed and presented data at the dashboard, journalism will be helped a lot, for viral news information, through batch, date, day, news’s category, news media and others. Through many data mining and other processes, Twitter was proven capable of providing and helping journalists with news sources and conveying the correct news to the public in effective and efficient ways. This process will help and give the journalism world a solution for effective, efficient, and unlimited news sources.
Conflict of Interest
The authors declare no conflict of interest.
Acknowledgments
This work is supported by the Directorate General of Strengthening for Research and Development, Ministry of Research, Technology, and Higher Education, Republic of Indonesia, as a part of Penelitian Dasar Unggulan Perguruan Tinggi Research Grant to Binus University titled “Sistem Penugasan Jurnalis Berdasarkan Trafik Media Sosial” or “Journalist Assignment System Based on Social Media Traffic” with contract number: 25/E1/KPT/2020, 225/SP2H/LT/DRPM /2019, 088/LL3/PG/2020, 039/VR.RTT/IV /2019.
- H.S.N. Al-Deen, J.A. Hendricks, Social Media: Usage and Impact, 307, 2012.
- T. Team, Twitter turns six, Twitter Blog, 21–23, 2012.
- W. Stassen, “Your news in 140 characters: exploring the role of social media in journalism,” Global Media Journal African Edition, 4(1), 116–131, 2011, doi:10.5789/4-1-15.
- S.C. McGregor, L. Molyneux, Twitter’s influence on news judgment: An experiment among journalists, Journalism, 21(5), 597–613, 2020, doi:10.1177/1464884918802975.
- S.C. Lewis, L. Molyneux, “A decade of research on social media and journalism: Assumptions, blind spots, and a way forward,” Media and Communication, 6(4NewsandParticipationthroughandbeyondProprietary), 11–23, 2018, doi:10.17645/mac.v6i4.1562.
- P. Ferrucci, Networked: Social media’s impact on news production in digital newsrooms, Newspaper Research Journal, 39(1), 6–17, 2018, doi:10.1177/0739532918761069.
- P. Pradhan, N. Kumari, “A study on Journalistic use of Social Media,” Amity Journal of Media & Communication Studies, 8(1), 49–59, 2018.
- J. Seethaler, G. Melischek, Twitter as a tool for agenda building in election campaigns? The case of Austria, Journalism, 20(8), 1087–1107, 2019, doi:10.1177/1464884919845460.
- B.A. Conway, K. Kenski, D. Wang, “The Rise of Twitter in the Political Campaign: Searching for Intermedia Agenda-Setting Effects in the Presidential Primary,” Journal of Computer-Mediated Communication, 20(4), 363–380, 2015, doi:10.1111/jcc4.12124.
- E.L. Frederick, L.M. Burch, M. Blaszka, A shift in set: Examining the presence of agenda setting on twitter during the 2012 london olympics, Communication and Sport, 3(3), 312–333, 2015, doi:10.1177/2167479513508393.
- P.M. Nadkarni, L. Ohno-Machado, W.W. Chapman, “Natural language processing: An introduction,” Journal of the American Medical Informatics Association, 18(5), 544–551, 2011, doi:10.1136/amiajnl-2011-000464.
- S. Das, A. Dutta, G. Medina, L. Minjares-Kyle, Z. Elgart, “Extracting patterns from Twitter to promote biking,” IATSS Research, 43(1), 51–59, 2019, doi:10.1016/j.iatssr.2018.09.002.
- S. Lim, C.S. Tucker, “Mining Twitter data for causal links between tweets and real-world outcomes,” Expert Systems with Applications: X, 3(July), 100007, 2019, doi:10.1016/j.eswax.2019.100007.
- A. Alabdullatif, B. Shahzad, E. Alwagait, “Classification of Arabic Twitter Users: A Study Based on User Behaviour and Interests,” Mobile Information Systems, 2016(January 2016), 2016, doi:10.1155/2016/8315281.
- F. Kateb, J. Kalita, “Classifying Short Text in Social Media: Twitter as Case Study,” International Journal of Computer Applications, 111(9), 1–12, 2015, doi:10.5120/19563-1321.
- A. Zubiaga, A. Aker, K. Bontcheva, M. Liakata, R. Procter, “Detection and resolution of rumours in social media: A survey,” ArXiv, 51(2), 2017.
- J.E. Sembodo, E.B. Setiawan, M.A. Bijaksana, “Automatic tweet classification based on news category in Indonesian language,” 2018 6th International Conference on Information and Communication Technology, ICoICT 2018, (May), 389–393, 2018, doi:10.1109/ICoICT.2018.8528788.
- I. Moalla, A. Nabli, L. Bouzguenda, M. Hammami, “Data warehouse design from social media for opinion analysis: The case of Facebook and Twitter,” Proceedings of IEEE/ACS International Conference on Computer Systems and Applications, AICCSA, 0, 2016, doi:10.1109/AICCSA.2016.7945627.
- M. Golfarelli, D. Maio, S. Rizzi, “The dimensional fact model: A conceptual model for data warehouses,” International Journal of Cooperative Information Systems, 7(2–3), 215–247, 1998, doi:10.1142/s0218843098000118.
- Y. Hu, A. Xu, Y. Hong, D. Gal, V. Sinha, R. Akkiraju, “Generating Business Intelligence Through Social Media Analytics: Measuring Brand Personality with Consumer-, Employee-, and Firm-Generated Content,” Journal of Management Information Systems, 36(3), 893–930, 2019, doi:10.1080/07421222.2019.1628908.
- C.A. Pushpam, J.G. Jayanthi, “Overview on Data Mining in Social Media,” International Journal of Computer Sciences and Engineering, 5(11), 147–157, 2017, doi:10.26438/ijcse/v5i11.147157.