Handling Priority Data in Smart Transportation System by using Support Vector Machine Algorithm

Adv. Sci. Technol. Eng. Syst. J. 5(6), 1422–1427 (2020);
 DOI: 10.25046/aj0506172
In an intelligent transportation system (ITS), time is a big challenge since processing a huge amount of data in a short time is very difficult, especially when the processed data is heterogeneous, consisting of a mixture of emergency data, normal data, and noise. In an ITS, an ambulance is one of the priority vehicles, and the data sent by the ambulance to the infrastructure and other vehicles must be treated first because if the ambulance does not receive a status of road from the infrastructure in time, it could take the wrong road or takes a road where there is a traffic jam has a high chance of arriving late, which could put the patient’s life in danger. Prioritizing treatment of this type of data has become paramount and vital in such cases. This paper proposes modifying the big data process to include handling the intelligent transport system’s urgent data type. We will add a classification step that allows us to classify the data according to the priority degree. We use the SVM algorithm of machine learning because it has given good results concerning data classification.
1. Introduction
Nowadays, it seems that every city is trying to become a smart city. To make a city smarter, life necessities (water management, waste management, transport, and security) and technology need to be transformed into smart services. A simple definition of a smart city is an environment in which citizens can live smoothly and easily by developing their various facilities and making them smart [1].
In smart cities, sensors will be placed all around the city, and they will generate continuous data. The analysis of such data will be very helpful for the city with the potential to be smarter. As we will have many sensors installed in the city, we will have a very large amount of data generated called Big DATA, and big data is a very large amount of data and data that can come from different sources in different shapes and forms. In the intelligent transportation that will be our case study, data will be generated from sensors placed in the city and sensors placed in the car (traffic light, Lidar camera, etc.). Those sensors will generate a mass of data that will be analyzed to help the car to become autonomous on the one hand and on the other hand to make the ride a joyful experience in addition to reducing the rate of accidents on the road.
As mentioned before, the data will be generated from different sensors located in the city and the sensors placed in the vehicle. In addition to these data, we will also have another type of data circulating in the network, namely the data exchanged between the Road-Side Units and between the latter and the vehicles and between the vehicles and the network data. So the challenge will be which data should be processed first, which data should have a higher priority; we will answer these questions in the present article, which is an extended version of the work presented in [1] where we propose to make a change on big data analysis process to handle priority data.
In the first section of this paper, we will briefly review the intelligent transportation system we will define the autonomous vehicle, explore the sensors embedded in it. We will see the Vehicular Adhoc Network (VANET) and the type of communication in VANET network. In section three, we will define big data in smart transportation. We will apply the principle of classification of transportation data to see different types of data collected by sensors. In the fourth section, we will explain our contribution by explaining the case study and the different steps of the proposed process. We will also define the machine learning algorithm used. In the final section, we will present the experimental result, and we conclude our work.
2. Autonomous vehicle
An autonomous vehicle is defined as a vehicle with the capacity to detect the surrounding environment to drive without human intervention. The autonomous vehicle depends on sensors, a Cloud platform, advanced algorithms, Machine learning systems, and efficient CPUs to operate algorithms. Thanks to the sensors integrated into the vehicle as shown in figure 1, it can generate a map of its environment. The camera and the LiDar are the eyes of the vehicle. They detect traffic lights, obstacles, traffic signs; all this data is processed by an algorithm which allows reading the traffic lights and the traffic signs, to avoid obstacles and to trace the path of the vehicle, and finally to send instructions to the accelerators to accelerate or to brake depending on the existence of obstacles in the path.
2.1. Sensors
Car manufacturers have integrated several sensors into the vehicle, as shown in figure 1 so that it becomes autonomous and can move around safely by detecting obstacles and reading signal lights. For a vehicle to be able to see and understand its environment, at least eight cameras are placed in the vehicle in addition to the LiDar to detect obstacles as well as RADAR, GPS to determine the location of vehicles over and above authors sensors.
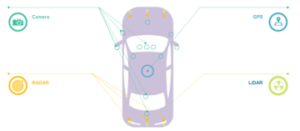
Figure 1: sensors in autonomous vehicle
2.2. VANET network
Vehicle Ad-hoc Networks (VANETs) emerged as one of the most relevant scientific research areas as they focused on supporting intelligent navigation and safe driving. It represents a specific type of MANET network that allows inter-node communication and organizes its communication system without any dependency on any other infrastructure. VANET is an intelligent building block of transport systems since vehicles interact with each other and infrastructure [2]. The high mobility of the nodes is one of the most relevant features of the VANET network vehicles are moving continuously in many directions and at varying speeds. The topology of the vanet network changes rapidly due to the fact that the vehicle can join or leave a cluster of vehicles in a very short time [3].Owing to the two above-mentioned features, combined with climate change and traffic congestion, vehicles can frequently become disconnected from the network. VANET has no energy or storage problems [4–6], unlike MANET networks, where energy constraint is a challenge. Besides having an unlimited network size since it has no geographical limits.The vehicles are referred to be communication nodes in VANET. To make communication possible between vehicles, the vehicle must be equipped with an On-Board Unit (OBU), and along the road, we must install the Roadside Unit (RSU).
The RSU is installed along the road based on the IEEE 802.11p radio technology to establish dedicated short-range communication (DSRC). It allows establishing local connectivity to the moving vehicle. It can also be used to communicate with other network devices in other infrastructure networks [7].
OBU is a device installed onboard the vehicle it allows to make a connection with the RSU, and with other OBUs via a wireless link IEEE 802.11p [8] The OBU gathers data from the sensors in the car, namely the Global Positioning System (GPS), the Event Data Recorder (EDR) and obtains the input power from the vehicle’s battery [7].
2.3. Communication in Vanet
In the vanet network, Vehicles communicate with each other and with the infrastructure via three modes of communication
V2V: In V2V communication mode, a vehicle can directly communicate with other vehicles within the same range; for this mode, the architecture is decentralized. It is very efficient to transmit information on road safety services, but due to the changing speed and mobility of the nodes [7, 9] permanent connections between vehicles cannot be guaranteed.
V2I: In this mode of communication, the exchanges of information are between the vehicle and the infrastructure (RSU, antenna, satellite). The V2I mode offers a better use of the common resources,besides the connection status, which is more stable in this mode than V2V communication [7, 9, 10].
V2X means communication between vehicle and X where X can be a vehicle, a pedestrian, infrastructure, network, etc… In this diverse ecosystem, vehicles will communicate with other vehicles, with infrastructures such as traffic lights, pedestrians using smartphones, and data centers via cellular networks using short-range wireless signals [9].
3. Big data in smart transportation
In a smart city, an enormous amount of data will be generated by an intelligent transportation system (ITS). An autonomous vehicle driving around the city generates more than 25 gigabytes of data per hour. The sensors integrated into the vehicle (camera, GPS, Lidar, etc.) continuously generate information that is processed and sometimes sent to other vehicles or the infrastructure. Besides this data, there is also the data generated by the road infrastructure: RSUs (Road-Side Unit), traffic signs, traffic lights, and parking spaces.
All transport components are nowadays equipped with intelligent sensors that generate and send data continuously, e.g. a sensor is installed in a parking space and periodically sends the status of the space either it is empty or not. In addition to this data, there is also the data from the VANET network used for communication. [11, 12].
Figure2 resumes the data in a smart transportation system (ITS). Cars have to manage much larger amounts of data than ever before. Processing this data quickly and transparently is now and will continue to be one of the main challenges for car manufacturers in the future.
4. Taxonomy of data in a smart transportation system
Before classifying the data, we must know the sources of the data. In fact, in an intelligent transport system, the data generated and collected may come from a variety of sources:
- Data shared between vehicles.
- Data shared between the vehicle and the infrastructure
- The environmental data (climate)
- The data generated by the sensors placed on board the vehicles
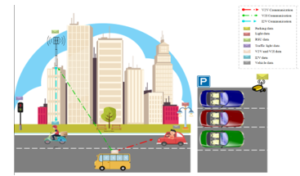
Figure 2: Communication and data type in ITS
Based on data collected from an intelligent transportation system and the taxonomy carried out in [1, 13], the data in an intelligent transportation system can be classified into three categories: the APP-level data, network-level data, and environmental data as shown in figure 3. APP-level data is the data generated by sensors installed in the ITS equipment (traffic light, etc) and the sensors integrated into the vehicles. The Network-level data is the data generated by the network that manages the communication between vehicles and road infrastructure besides the vehicles themselves (VANET network). The last type of data is environmental data.
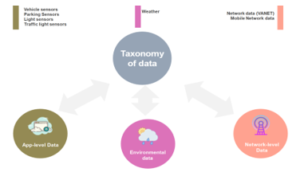
Figure 3: Taxonomy of data in ITS
5. Proposed Method
As the volume of data generated by the various intelligent transport equipment is large, processing has become vital. For a vehicle to move safely, it is necessary to collect, analyze, and transmit the information in short-time. When processing this data, the problem is to determine which data has the highest priority and needs to be processed first. To solve this problem, we propose to make a change in the Big data analysis process. Usually, the process of big data consists of the following steps: data collection, cleaning, analysis, and, finally comes the step of data interpretation[14]. However, to identify the data with the highest priority, we have added a step before the cleaning step, which will be the ordering and classifying step, and we will detail in the next sections.
5.1. Case study
In the intelligent transport system, we have several types of data that are assigned a priority. We are interested in the data shared between vehicles and RSUs, and our case study is as follows:
These RSUs will receive a large amount of data; amongst this data are the critical data that is of a higher priority than others. For instance, in the case of an accident on the road, or a fire engine trying to reach the scene of the incident, the messages sent by these vehicles have a higher priority than those sent by other vehicles, as shown in figure 4. In an intelligent transportation system, it must be able to broadcast information messages to alert road users about the accident on the road and advise them to change or turn back, as well as be able to alert the hospital through notifications, so it will send an ambulance if there is injury. The challenge here is the large number of messages received by the RSUs. The question we ask ourselves in this situation is how can we process this data and come out with the ordered data from the most critical to the least important. Figure 4 represents our case study;
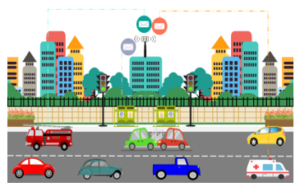
Figure 4: Case Study emergency data
We have three vehicles that have priority over the other vehicles, which are the fire engine, the accident vehicle and finally the ambulance. The messages received by these vehicles must be processed first to avoid causing traffic problems and other more serious consequences, such as loss of life.
5.2. Critical Data
To process the priority data, we must first determine the type of vehicles given priority [15]. In our case study, we have already listed three of them, and we add to them the police vehicles. Therefore, to process the priority data, we propose the following process.
First of all, it is necessary to collect the data received by the different vehicles and then apply a classification algorithm that allows us to determine the classes to which they belong. For this purpose, we have two levels of priority that are shown in figure five.
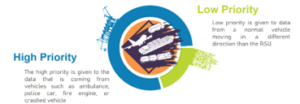
Figure 5: Levels of data priority in ITS
After the data classification step, we will have the possibility to know the data with priority, to process them first. The same process can be applied to the vehicles that will receive the data from other vehicles and the RSU data, and the data generated by the different sensors inside the vehicle. In the case of a vehicle traveling through the city at a given speed, if an accident occurs on its way, the priority must be given to the information of the change of path and the information of the change of the geolocalization map, whereas in the case of the ambulance, the alert must be given so that it passes first and requests the other vehicles in its area to clear the way.
5.3. Data packet
The communication that takes place between the infrastructure and the vehicle is communication managed by the RSU and the OBU. In an intelligent transportation system, the RSU is installed at the roadside to provide a local connection to the vehicle in motion, although it can also be used to communicate with other network devices in other infrastructure networks [7]. RSU uses short-range communication (DSRC), which is based on IEEE 802.11p radio technology. The RSU communicates to the OBU continuously. The main function of the OBU is to connect to the RSU or another OBU via the IEEE 802.11p wireless link [8]. Besides, the OBU gathers information from sensors embedded in the vehicle (e.g. Global Positioning System (GPS), Event Data Recorder (EDR)) and gets input power from the battery vehicles [16]. The packet from OBU to RSU contains the following fields OBU_ID, TIME_STAMP, POSITION, SPEED, DIR, ACC, VEHICLE_TYPE, DUTY_FLAG [15]. The table 1 represents an explanation of the fields.
Table 1: fields of the packet send between the OBU and the RSU
| Fields | Explanation |
| OBU_ID | Contains the vehicle ID |
| TIME_STAMP | It is the time when the frame was sent. |
| POSITION | Is the position of the vehicle the value f position is gathered from the GPS sensor |
| SPEED | Is the speed of the vehicle |
| DIR | It is the direction of the vehicle. |
| ACC | Acceleration |
| VEHICLE_TYPE | Is the type of vehicle (Ambulance, fire engine, etc …) |
| DUTY_FLAG | Contains information if there is an accident or the vehicle is on duty |
The values of the fields above are calculated from GPS sensors that allow them to obtain directly the position, the speed, and the time. We can deduce the value of DIR from the GPS, the other values that identify the vehicle such as the id and the vehicle type are gathered from the latter.
5.4. Proposed algorithm
5.4.1. Support Vector Machine (SVM)
The SVM is a machine learning algorithm that belongs to the family of supervised learning algorithms. SVM can solve regression and classification problems besides outlier detection. The SVM algorithm can be used to classify linear and non-linear data. Therefore, it can carry out classification in a non-linear way using the kernel trick [3, 17].The SVM can be used to detect network intrusion [18] and spoofing attacks [19]. In [20], the author have used security messages to identify classes and types of attacks using SVM and KNN algorithms. In [20], the author noticed that KNN works better than SVM in some cases. When SVM has a reduction in performance, it is when the training base of both algorithms contains attacks that had extreme levels of misconduct and only a few attacks that were common errors. Also, judging the accuracy of recall, they found that SVM and KNN yield better results in some types of attacks, and SVM outperforms KNN in some attacks. In [21], the author have conducted an experiment on Support Vector Machine (SVM) and Feed Forward Neural Network (FFNN) to design intelligent IDSs that can detect two types of attacks, which are grey hole attacks and Rushing Attacks [21]. It is noted that FFNN-based IDSs could better detect malicious vehicles with lower false-negative alarm rates than SVM-based IDSs. However, the performance of SVM is much faster than FFNN. The choice of SVM algorithms was based on the comparative study conducted in [3] found that SVM is an algorithm that can handle multidimensional data and does not need much memory, and can detect outliers because the outlier detection is very important since the outliers can make false the classification model. Also, SVM can be used for both the separable and non-linearly separable data and work very well with a higher dimension. Besides, by using SVM we can replace the feature engineering, which is a very hard step for exploring data by kernelization.
5.5. Kernels
The SVM algorithm works by using a kernel technique to classify non-linear data, it maps data from the lower dimension data to the higher one and separates them with an optimal hyperplane. Therefore the kernel trick can help to transform non-linear problems into linear separable problems[17].
There are three types of kernel functions that are commonly used: linear kernel, Polynomial kernel, and Radial Basis Function Kernel (RBF). To choose which one to use, the SVM algorithm uses cross-validation to test several combinations of the kernel function and picks the one that gives the best results.

§ Linear kernel: The linear kernel is commonly used to classify text and is also utilized in situations where the data is linearly separable. This means that the data may be separated with only one line. A linear kernel is generally faster to train due to the only optimization of the C regularization parameter.
§ Polynomial Kernel(poly): The polynomial kernel is widely used for processing natural language (NLP). The standard degree is d = 2 (quadratic), since higher degrees over-adjust NLP problems.
§ Radial Basis Function Kernel (RBF): The radial basis function kernel is the most used in SVM. This is because it has a localized and finite response along the whole x-axis. as well as being used when we have no previous knowledge of the data.
6. Experimental results
Our research results and their explanations, are presented in this section. First, we explain the methodology of our experiment and discuss the experimental result of using the SVM algorithm.
6.1. Methodology
Before starting the cleaning step, we will apply a classification algorithm to determine the type of data e.g, whether it is high-priority data or not.
The proposed process is schematically depicted in figuresix. Firstly, vehicles send every second packet, which is described in section 5.3. Each packet is read by the Machine Learning algorithm, which is the support vector machine (SVM) algorithm that we have chosen for this purpose. It has to classify data into two types see section 5.2. The classification is based on three criteria: the type of vehicle (e.g. ambulance, fire engine, police vehicle, accident vehicle, normal vehicle), the vehicle’s direction, and finally, the duty flag field. If the type of vehicle is normal and the value of the duty flag mentions it as not crashed, then the algorithm will classify the data as not priority; otherwise, if the type of vehicle is an ambulance, fire engine, or police car, the algorithm must check the direction of the vehicle either it is the same as the one of the RSU, then the SVM classifies the data as a high priority. Once classified, the data can follow the standard BIG data process described in the figure six.
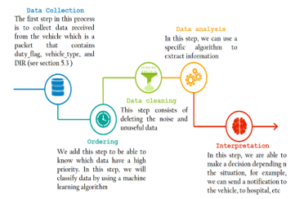
Figure 6: Proposed process
The urgent and priority data is a very challenging type of data in every domain, especially in the transportation system. If we do not treat them urgently, we can cause big damage and sometimes lose a life if the treatment was delayed. Our paper aims to handle this type of data. We propose an SVM algorithm that will read the packet sent to the vehicles or the RSUs and detect which packet has the priority to be treated first. Before starting the classification, we show in figure 7 the distribution of some vehicles based on their speed captured by the GPS sensor. We capture 100 packets sent from vehicles to RSU, and we use it to test our SVM algorithms. The SVM algorithm was applied to this database to classify the data into two types: priority and non-priority. We focused on three types of kernel poly, linear et RBF. The SVM algorithm uses two parameters to build the model, which are the gamma and the C value. In fact, the two variables, gamma, and C could change the classification model. So if the gamma value is very high, the algorithm will consider the closest points to build the limits and aims at it. We can fall into overfitting when C’s value is very high and into underfitting if it is small.For this purpose, we applied a function that takes several input values for the C and Gamma parameters to find the optimal values that give the best classification results and high accuracy. The result was resumed in Table 2, where we represent C and Gamma’s value that gives an accuracy that is equal to 0.90.
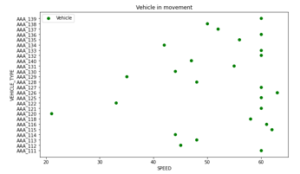
Figure 7: Distribution of vehicle based on speed

Figure 8 : SVM classifier with RBF kernel
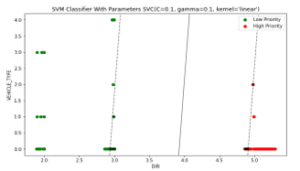
Figure 9: SVM classifier with Linear kernel
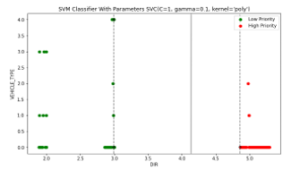
Figure 10: SVM classifier with polynomial kernel
Table 2: The best value of gamma and C
| Gamma | C | accuracy | kernel |
| 0.1 | 1 | 0.90 | poly |
| 0.1 | 0.1 | 0.9 | linear |
| 1 | 1 | 0.9 | RBF |
The figure 8,9 and 10 represents the classification results with each kernel. Figure 8 represents a two-dimensional classification problem. We plot the priority and the normal packet using two colors, red and green. There is a linear decision boundary for this dataset, but in figure 8, we can see how an RBF kernel can automatically decide a non-linear classification. In figure 9, we have three hyperplanes, and all of them separate the classes well. We can see that the margin between the continuous line and the data point is high compared to the dotted line. Therefore, we name the hyperplane that is represented by a continuous line as the good hyperplane. The reason for choosing the hyperplane with a higher margin is robustness, and if we choose the hyperplane with a low margin, then there is a high risk of wrong classification. The polynomial kernel is used with degree two, and he also gave a result close to the one with a linear kernel.
7. Conclusion
This paper proposes an SVM algorithm for classification problems in the context of the Vanet network. The contributions of this paper are as follows. First, we propose to add an additional step to the big data processing, which is the ordering step, and we have explained its role in identifying the data with high priority. This additional step can help to improve the cleaning step because by ordering data, we can remove the ones with low priority. It can also be employed to eliminate unused data namely the data of vehicle that is sent to the RSU and that possess a different direction from the latter. In the second part of this paper, we apply a machine learning algorithm to classify data. We select the SVM algorithm because of its high performance as a classifier, and we choose three kernels, which are the poly, linear, and the RBF. Since C and gamma’s value can make a big change in the construction of the classifier, we apply a function that takes a different value of C and gamma for each kernel and return the value that gives the best accuracy. The paper aims to propose a process that can handle priority and urgent data and treat them at the right time. We propose adding a classification step that will allow us to classify data into two types: normal data and priority data. By using SVM, we achieve a good result. However, In future work, we will use the same proposed process, and we will apply the neural network to find the priority data. We will compare the SVM results with the neural network results. we chose to compare the neural network with SVM because, based on the comparative study conducted in [3], the neural network also gives good results in handling outliers, and also it is a very fast algorithm and can also handle multidimensional data and does not need much memory.
- S. Ftaimi, T. Mazeri, “The role of big data in a connected environment Case study: smart city,” in 2019 International Conference of Computer Science and Renewable Energies (ICCSRE), IEEE, Agadir, Morocco: 1–7, 2019, doi:10.1109/ICCSRE.2019.8807501.
- J. Lloret Mauri, ed., Cognitive networks: applications and deployments, CRC Press/Taylor & Francis Group, Boca Raton, 2015.
- S. Ftaimi, T. Mazri, “A comparative study of Machine learning algorithms for VANET networks,” in Proceedings of the 3rd International Conference on Networking, Information Systems & Security, ACM, Marrakech Morocco: 1–8, 2020, doi:10.1145/3386723.3387829.
- R.G. Engoulou, M. Bellaïche, S. Pierre, A. Quintero, “VANET security surveys,” Computer Communications, 44, 1–13, 2014, doi:10.1016/j.comcom.2014.02.020.
- D. Dinesh, M. Deshmukh, “Challenges in Vehicle Ad Hoc Network (VANET),” International Journal of Engineering Technology, 2(7), 14, 2014.
- M.N. Mejri, J. Ben-Othman, M. Hamdi, “Survey on VANET security challenges and possible cryptographic solutions,” Vehicular Communications, 1(2), 53–66, 2014, doi:10.1016/j.vehcom.2014.05.001.
- S. Al-Sultan, M.M. Al-Doori, A.H. Al-Bayatti, H. Zedan, “A comprehensive survey on vehicular Ad Hoc network,” Journal of Network and Computer Applications, 37, 380–392, 2014, doi:10.1016/j.jnca.2013.02.036.
- IEEE P1609.0/D5, September 2012: IEEE Draft Guide for Wireless Access in Vehicular Environments (WAVE) – Architecture., IEEE, Place of publication not identified, 2012.
- M.S. Sheikh, J. Liang, “A Comprehensive Survey on VANET Security Services in Traffic Management System,” Wireless Communications and Mobile Computing, 2019, 1–23, 2019, doi:10.1155/2019/2423915.
- M.S. Sheikh, J. Liang, W. Wang, “Security and Privacy in Vehicular Ad Hoc Network and Vehicle Cloud Computing: A Survey,” Wireless Communications and Mobile Computing, 2020, 1–25, 2020, doi:10.1155/2020/5129620.
- L. Zhu, F.R. Yu, Y. Wang, B. Ning, T. Tang, “Big Data Analytics in Intelligent Transportation Systems: A Survey,” IEEE Transactions on Intelligent Transportation Systems, 20(1), 383–398, 2019, doi:10.1109/TITS.2018.2815678.
- S. Kaffash, A.T. Nguyen, J. Zhu, “Big data algorithms and applications in intelligent transportation system: A review and bibliometric analysis,” International Journal of Production Economics, 231, 107868, 2021, doi:10.1016/j.ijpe.2020.107868.
- X. Cheng, L. Fang, L. Yang, S. Cui, Mobile Big Data, Springer International Publishing, Cham, 2018, doi:10.1007/978-3-319-96116-3.
- M. Chen, S. Mao, Y. Liu, “Big Data: A Survey,” Mobile Networks and Applications, 19(2), 171–209, 2014, doi:10.1007/s11036-013-0489-0.
- W.-H. Lee, C.-Y. Chiu, “Design and Implementation of a Smart Traffic Signal Control System for Smart City Applications,” Sensors, 20(2), 508, 2020, doi:10.3390/s20020508.
- S. Al-Sultan, M.M. Al-Doori, A.H. Al-Bayatti, H. Zedan, “A comprehensive survey on vehicular Ad Hoc network,” Journal of Network and Computer Applications, 37, 380–392, 2014, doi:10.1016/j.jnca.2013.02.036.
- P. Walsh, “Support Vector Machine Learning for ECG Classification,” 10.
- M.A. Alsheikh, S. Lin, D. Niyato, H.-P. Tan, “Machine Learning in Wireless Sensor Networks: Algorithms, Strategies, and Applications,” IEEE Communications Surveys & Tutorials, 16(4), 1996–2018, 2014, doi:10.1109/COMST.2014.2320099.
- M. Ozay, I. Esnaola, F.T. Yarman Vural, S.R. Kulkarni, H.V. Poor, “Machine Learning Methods for Attack Detection in the Smart Grid,” IEEE Transactions on Neural Networks and Learning Systems, 27(8), 1773–1786, 2016, doi:10.1109/TNNLS.2015.2404803.
- S. So, P. Sharma, J. Petit, “Integrating Plausibility Checks and Machine Learning for Misbehavior Detection in VANET,” in 2018 17th IEEE International Conference on Machine Learning and Applications (ICMLA), IEEE, Orlando, FL: 564–571, 2018, doi:10.1109/ICMLA.2018.00091.
- K.M. Ali Alheeti, A. Gruebler, K.D. McDonald-Maier, “On the detection of grey hole and rushing attacks in self-driving vehicular networks,” in 2015 7th Computer Science and Electronic Engineering Conference (CEEC), IEEE, Colchester: 231–236, 2015, doi:10.1109/CEEC.2015.7332730.