Defeating Anti-Debugging Techniques for Malware Analysis Using a Debugger

Adv. Sci. Technol. Eng. Syst. J. 5(6), 1178–1189 (2020);
 DOI: 10.25046/aj0506142
Cyberattacks such as spear phishing and malspam pretending to be companies, institutes, and government officials are increasing and evolving. Malware has a variety of purposes, such as collecting personal information and illegal access to the system. New types of malware are increasing every day, and many malware programs spread all over the Internet, causing severe problems. To analyze such malware effectively, analysts first need to understand the inner structure of the malware. They can try to analyze malware manually and automatically. However, attackers who create malware use many different kinds of techniques, such as anti-reverse engineering, to hinder and delay analysis. They also extend malware life through a combination of different techniques, such as social engineering and anti-debugging. These techniques make the malware more sophisticated; thus, it is hard for an analyst to detect the malware. Anti-debugging, one way to protect malware, is a deadly poison to malware analysts because it makes the analysis more difficult by detecting a debugger or debugging environments. Therefore, this paper describes malware’s anti-debugging techniques and how to defeat them through anti-anti-debugging mechanisms. It applies its findings to analyze a sample program, packed files, and actual malware with anti-debugging modules and performs various experiments to verify the proposed techniques. After the experiments, it confirms whether its countermeasure is useful for malware analysis.
1. Introduction
In the past, the development of malware was mainly used for malware programmers to show off. However, malicious software(malware) such as virus and keylogger in recent years illegally accesses server systems in various ways to steal personal and financial information and computing power. Fatal damage, such as the theft of essential data of institutes, corporations, public institutions, and personal user information, occurs. The malware damage can take many forms, from stealing personal information such as a user’s financial information to destroying industrial facilities such as Stuxnet [1]. According to Symantect’s “Internet Security Threat Report 2019”, financial Trojans accounted for 16% of the many malware programs spread in 2018. In addition, Trend Micro’s “Unseen Threats, Imminent Losses” said that a vulnerability was found in the Supervisory Control And Data Acquisition (SCADA) system, one of the industrial systems’ components. Also, attackers can penetrate the system through malware that attacks this vulnerability and illegally controls the SCADA system.
New types of malware appear every day and spread over the Internet, causing serious problems frequently. The malware also uses anti-reverse engineering techniques such as Self-Modifying code, code compression, packing, and anti-debugging methods to hide internal code structures and interfere with the analysis. This paper is an extension of work initially presented in the International Conference on ICT Convergence [2] to solve these kinds of problems. It is challenging to analyze malware with these anti-reverse engineering techniques accurately and requires considerable time. Security experts reinforce security by using anti-virus software and various equipment types to minimize malware damage, while analysts scrutinize malware using various techniques, it is more likely that anti-virus software or an automated analysis tool fails to detect it. The workflow of malware analysis is as in Figure 1. Usually, when an analyst analyzes malware, an analyst gets information from automated and static tools [3]. For example, if malware has anti-reverse engineering analysis. After static analysis, the analyst analyzes malware behavior through dynamic analysis and investigates its behavior in more detail through advanced analysis. However, anti-debugging techniques are hinder all analysis steps especially advanced analysis. Most of the tools in the advanced analysis are insufficient to deal with anti-debugging techniques. The relevant APIs and structures such as PEB and HEAP could be modified to defeat anti-debugging techniques as soon as advanced analysis begins. This step makes it more convenient for analysts to analyze malware, and it could be analyzed more quickly because the malware interference is gone.
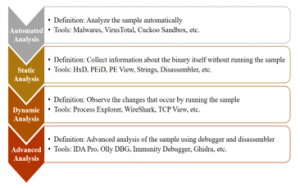
Figure 1: Workflow in safe and accurate analysis of malware
When analyzing malware in virtual environments such as QEMU, VMware, and VirtualBox, the virtual environments can be constructed similarly to the physical environments. The virtual environment analysis has advantages that are vastly similar to the actual execution, and does not have to worry about infecting a physical computer while performing malware analysis. However, there is a disadvantage in that analysis may be disrupted through the anti-VM (Virtual Machine) techniques. Anti-VM techniques disable malware analysis using CPU emulators or virtualization tools. The Dynamic Binary Instrumentation (DBI) tool can bypass anti-debugging by inserting or replacing code chunks into the operation command [4]. However, DBI has a disadvantage because it is not convenient, and it cannot execute huge or complex programs correctly.
The static analysis uses tools such as a decompiler and disassembler to analyze the binary or code of malware to infer the type of malware. However, this approach becomes more difficult and complicated by evasion techniques such as code obfuscation and packer [5]. A dynamic analysis examines the behavior of the target file. However, dynamic analysis tools cannot provide both accuracy and convenience when analyzing complex malware. The debugger, widely used to analyze malware dynamically, can examine changes in the machine’s state while executing each command. However, the disadvantage of using a debugger is that there are anti-debugging techniques that can detect and interfere with the debugging process. Thus, if analysts can defeat anti-debugging techniques that interfere with the debugger, it becomes one of the most powerful methods for analyzing malware. Therefore, this paper introduces anti-debugging techniques that attack a debugger’s vulnerabilities to interfere with analysis, and explains how to bypass analysis. In addition, it proposes anti-anti-debugging techniques that can defeat anti-debugging techniques, and verify the proposed method applying them to a sample program, packed files, and actual malware with anti-debugging modules. This paper aims to give direction for researchers who analyze malware or those who dream of being analysts to develop their methods or scripts that can defeat anti-debugging techniques when using a debugger.
This paper is organized as follows. Section 2 introduces research related to anti-debugging. Section 3 proposes anti-debugging techniques based on artifacts and time and describes correspondent anti-anti-debugging mechanisms. Section 4 presents the experiments performed and verifies anti-anti-debugging techniques with a sample program, packed files, and actual malware. Section 5 concludes the study.
2. Related Work
Analysts have continuously reviewed malware detection and binary code analysis. On the other hand, anti-reverse engineering research does not draw much attention from researchers except for some category topics [6], [7]. There are various topics in anti-reverse engineering such as anti-debugging, anti-VM, and code encryption. To understand anti-analysis, first, malware analysis must be briefly described. There are two different types of malware analyses, namely static analysis and dynamic analysis. Static analysis is a method of analyzing codes or binaries without executing them. Analysts can observe the file’s operation code with a decompiler or disassembler and analyze the program flow and internal structure. Dynamic analysis probes its behavior by executing them using a sandbox, debugger, or emulator. Debugging refers to the process of detecting and eliminating errors or bugs when a process operates unexpectedly or crashes. A debugger is a tool or software that helps with this, therefore, it is a useful tool for understanding malware’s inner workings. It likewise helps to observe changes in registry, memory, and stack closely while executing instructions in the target file (debuggee) line by line. Also, analysts use debuggers because they can manipulate elements such as code, environment, and memory. The sandbox case runs the file to record and analyze the process and network changes over a while [8].
However, malware developers use anti-analysis techniques against each analysis. Therefore, anti-debugging techniques delay malware detection and increase its life span by bypassing the anti-virus software. Anti-analysis is a series of techniques in which malware remains concealed, prevents detection, interferes with analysis, and makes analyzing it challenging. It is analyzed 6,222 samples of malware and studied how malicious behaviors differed in an environment with virtualization and a debugger [9]. As results, they found about 40 percent malware in an environment with a debugger performing less malicious behavior. Also, only two percent of the samples in a virtual environment showed malicious behavior when executed. This study shows malware with anti-VM and anti-debugging can bypass dynamic malware analysis tools such as a debugger, sandbox, and emulator.
Examples of anti-analysis techniques that interfere with static analysis include packer [10]-[12], code obfuscation [5], [13], [14], and opaque constants [15]. Packer is a technique that compresses the executable file and creates a new program entirely different from the original program. However, the new packed file has the same or similar behavior with various techniques such as Portable Executable (PE) relocation and anti-analysis. In the case of code obfuscation and opaque constants, these are the process of encrypting text, binary data, or code to make it difficult to understand. For these reasons, the malware detection method based on signature became ineffective. Thus, dynamic analysis emerged to solve these kinds of problems. Debugging, which analyzes malware, carefully examines details such as behaviors, registers, and stacks while executing malware instructions by line. However, dynamic analysis using the debugger suffers from anti-analysis, such as anti-debugging, anti-VM, code compression, Self-Modifying, and blocking input devices. Among the anti-analysis, anti-debugging is an attempt by the debuggee to find or detect evidence of an analysis environment or debugger’s presence. It is provided an overview of the analysis disruption techniques used by malware such as anti-debugging, anti-VM, and obfuscation [16]. Shang Gao and Qian Lin gave an overview of Windows’s debugging mechanism, categorized according to the debugging methods used by the debugger, and explained the debugging functions and anti-debugging through exceptions [17]. It is classified general malware, targeted malware to attack specific systems and investigate how many anti-debugging techniques applied to it [18]. Most malware had anti-debugging techniques, however, it is found that the general malware had more anti-debugging techniques than targeted malware.
To defeat anti-analysis techniques, analysts can defeat most anti-debugging techniques using many CPU emulator and virtualization tools. However, these tools are not suitable for analyzing malware because they can analyze only a specific process or program. Dynamic Binary Instrumentation (DBI) framework can insert, modify, and delete code at the arbitrary address during the program’s running [4], [19], [20], [21]. Therefore, the DBI can bypass the anti-debugging techniques by code insertion. However, analysis is inconvenient, and some DBIs cannot execute complex programs correctly [22]. Recently It is proposed the Apate framework to analyze malware [23]. Apate is a framework that hides the debugger from anti-debugging. The spectrum of powerful anti-debugging techniques is analyzed and classified into 79 attack vectors and six categories.
Apate is designed to defeat anti-debugging techniques by: (1) performing just-in-timed disassembling based on single-stepping and; (2) monitoring the execution flow of the debuggee and modifying the state of the debuggee to hide WinDbg. It is defined anti-debugging rule sets and proposed replacing the matching part of the binary with other instructions. The method proposed and modified the part that calls the anti-debugging functions in the debugger to other instructions [24], [25]. It is proposed a new framework for classifying, detecting and bypassing reverse engineering prevention techniques used by malware and protecting systems [9]. It is proposed UBER, a new system to neutralize anti-sandbox [26]. Sandbox has many artifacts of analysis environment. The anti-sandbox looks for various system artifacts expected to exist in the system for identifying the sandbox environment. UBER does not replicate artifacts or folders in use or directly simulate user behavior. Instead, it generalizes the user’s computer usage pattern with an abstract behavioral profile, adopts the profile to simulate user and artifact creation operations, and then replicates the system with the created artifacts into a sandbox. Through this, UBER can defeat the anti-sandbox (i.e., usage artifacts analysis), while malware in the Windows or macOS malware is increasing. Since the tools for analyzing macOS based on malware are very limited. It is proposed Mac-A-Mal, a framework for analyzing Mac based malware [27]. It is developed a kernel extension to monitor malware behavior and bypass several evasion prevention techniques used in the wild, which uncovered 74 unknown malware programs.
3. Defeating anti-debugging techniques
This section first finds out how anti-debugging techniques work in Windows. Afterward, it explains how to defeat them [28].
3.1. Process Environment Block (PEB) Structure
The Process Environment Block (PEB) structure is a data structure in the Windows NT operating system. Each process has this structure and it contains each process information. Malware can detect the presence of debugger without using a specific function such as IsDebuggerPresent(). If implemented manually, there is no way to detect this in a static analysis or initial analysis. The anti-debugging based on PEB structure protects programs not only by malware but also many by many packers such as PECompact, ASPack, and ASProtect [29].
It confirms the BeingDebugged, NtGlobalFlag, and HEAP structure to perform anti-debugging among many PEB structure members. BeingDebugged is set to 0x0 if not debugged, and 0x1 if debugged. NtGlobalFlag has a value of 0x0 if not debugged, and is set to a value of 0x70 if debugged. Table 1 shows the flags of NtGlobalFlag while debugging. Not only the PEB structure, but HEAP structure can also detect the presence of a debugger.
Table 1: Flag configurations of NtGlobalFlag member in the PEB structure
| Flag | Value |
| FLG_HEAP_ENABLE_TAIL_CHECK | 0x10 |
| FLG_HEAP_ENABLE_FREE_CHECK | 0x20 |
| FLG_HEAP_VALIDATE_PARAMETER | 0x40 |
Table 2: Flag configurations of Flags member in the HEAP structure
| Flag | Value |
| HEAP_GROWABLE | 0x2 |
| HEAP_TAIL_CHECKING_ENABLED | 0x20 |
| HEAP_FREE_CHECKING_ENABLED | 0x40 |
| HEAP_SKIP_VALIDATION_CHECKS (only in Windows XP or under) |
0x10000000 |
| HEAP_VALIDATE_PARAMETERS_ENABLED | 0x40000000 |
Table 3: Flag configurations of ForceFlags member in the HEAP structure
| Flag | Value |
| HEAP_TAIL_CHECKING_ENABLED | 0x20 |
| HEAP_FREE_CHECKING_ENABLED | 0x40 |
| HEAP_VALIDATE_PARAMETERS | 0x40000000 |
Anti-debugging can detect debuggers using the Flags and ForceFlags members of the HEAP structure. Flags has a value of 0x2 if not debugged. It has a value of 0x50000062 in Windows XP or 0x40000062 in Windows 7 or later versions, if debugged. ForceFlags has a value of 0x0 if not debugged, and 0x40000060 if debugged. Table 2 shows the configuration flags of Flags and Table 3 shows the configuration flags of ForceFlags. To bypass anti-debugging based on PEB structure, analysts can defeat anti-debugging by modifying each member to an appropriate value, such as 0x0 in BeingDebugged.
![]()
Figure 2: The original code (left) and modification code (right) of IsDebuggerPresent()
3.2. Is De bugger Present()
IsDebuggerPresent() is the function in which software can easily detect the presence of a debugger. Malware and general software use this function to protect itself from reverse engineering. This function is also one of the anti-debugging techniques that most packers such as UPX and PECompact can apply to the original program. This function returns the BeingDebugged member of the PEB structure. To defeat this function, one must modify the code to return 0x0 or change the value of BeingDebugged member of the PEB structure. This paper uses PUSH and POP instructions to store 0x0 in the EAX register, shown in Figure 2. The original code of IsDebuggerPresent() is the left side of Figure 2, and the modification code of IsDebuggerPresent() is the right side of Figure 2.

Figure 3: The original code (left) and modification code (right) of CheckRemoteDebuggerPresent()
3.3. CheckRemoteDebuggerPresent()
CheckRemoteDebuggerPrenset() function takes the Process Identifier (PID) of a particular process to detect whether it is debugged or not. It calls the NtQueryInformationProcess() function from inside to perform anti-debugging not only on malware but also on general software, and some packers use it to prevent debugging. The code on the left of Figure 3 is the original code of CheckRemoteDebuggerPrenset() and as shown on the left side of Figure 3, it calls NtQueryInformationProcess() from inside. There are two ways to defeat this function. Firstly, defeat the function called NtQueryInformationProcess() internally. Secondly, store 0x0 in the EAX register to make it always return 0x0.
This paper stores 0x0 in the stack using the PUSH instruction, as shown on the right side of Figure 3. It then stores 0x0 in the EAX register with POP instruction and terminates the function using RETN. There are three essential things to defeat this function. First, three existing instructions from the top of this code must be maintained. The second is to store 0x0 in the EAX register and return it. Last is to save the return address stored in the stack to the EBP register with POP instruction, then end with RETN. Otherwise, the flow of the debuggee gets tangled, and the analysis cannot proceed further.
3.4. ZwQueryInformationProcess()
The developer uses ZwQueryInformationProcess() functions for various reasons, such as finding a process path not only for anti-debugging. However, this section, only describes anti-debugging based on ZwQueryInformationProcess(). Figure 4 is a parameter for ZwQueryInformationProcess(). Among these parameters, ProcessInformationClass is the type of process information to be retrieved. It performs by set a specific value to the ProcessInformationClass parameter. If ProcessInformationClass is set to 0x7 which means ProcessDebugPort, it can determine whether it is debugged or not. In case of debugging, it returns 0xFFFFFFFF (-1). If not, it returns 0x0. Not only ProcessDebugPort, this function can executes anti-debugging bypassing 0x1E, which means ProcessDebugObjectHandle or 0x1F, which means ProcessDebugFlags to the parameter ProcessInformationClass. In the case of ProcessDebugObjectHandle, this function returns 0x000000B4 if debugged, and it returns 0x0 if not debugged. In the case of ProcessDebugFlags, this function returns 0x0 if debugged, and it returns 0x1 if not debugged. The code on the left of Figure 5 is the original code of ZwQueryInformationProcess().
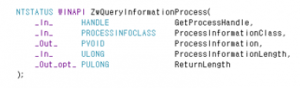
Figure 4: Parameter of ZwQueryInformationProcess()
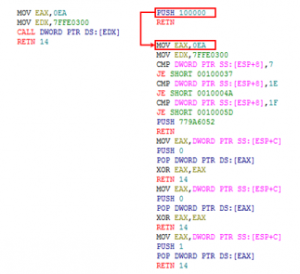
Figure 5: The original code (left) and modification code (right) of ZwQueryInformationProcess()
In order to bypass ZwQueryInformationProcess(), three things are crucial: (1) the first two instructions from the top of the original code must be executed; (2) it must return an appropriate value; (3) it should not interfere with the flow of the debuggee. It needs a new virtual memory that must be allocated to handle the number of cases and consider non-anti-debugging cases. Also, ZwQueryInformationProcess() enters the kernel area through KiFastSystemCall and SYSENTER instructions. Since the debugger cannot enter the kernel, one can bypass these powerful instructions by writing new instructions in allocated virtual memory, as shown on the right of Figure 5. It determines whether the received ProcessInformationClass parameter is 0x7 (ProcessDebugPort), 0x1E (ProcessDebugObjectHandle), or 0x1F (ProcessDebugFlags). In each case, it jumps to the address with the specific instructions. Otherwise, it returns to the original instruction with RETN. The reason for returning to the original function is not to disturb the flow of the debuggee.
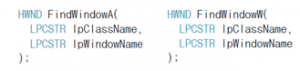
Figure 6: Parameters of FindWindowA() and FindWindowW()

Figure 7: The original code (left) and modification code (right) of FindWindowW()
3.5. FindWindow()
The family of FindWindow functions can find the name of the specific window. It consists of FindWindowW(), FindWindowA(), FindWindowExW(), and FindWindowExA(). These are anti-debugging techniques that confirm the debugger’s window name to see if the debuggers are running on the operating system. Figure 6 shows the parameters of FindWindowA() and FindWindowW(). The lpClassName gets a specific class name, and the lpWindowName gets a specific window name when calling these functions. If it finds the name of a specific window, it returns the handle of the window. If not, it returns 0x0. If malware calls these functions, it passes a particular debugger’s window name to the lpWindowName parameter for anti-debugging. However, the analysts can defeat it always to returns 0x0.
The code on the left of Figure 7 is the original code of FindWindowW(), and the code on the right of Figure 7 is the code to defeat it. This study allocates a virtual memory and writes new instructions to disable anti-debugging techniques. After moving to the allocated address through the PUSH and RETN instructions, one must execute the existing CALL instruction. Next, it needs to get the debugger’s window handle and compare it with the EAX register using CMP instruction. If it is the same, it jumps by JE instruction and stores 0x0 in the EAX register. Otherwise, it jumps by JMP instruction and restores the return address to the EBP register. The analysts can defeat this anti-debugging technique by writing new instructions in virtual memory. In Figure 7, the address of virtual memory is 0x00220000. However, this address must point to empty virtual memory.
3.6. GetCurrentProcessId(), BlockInput()
The commercial packer such as Yoda’s Protector uses the two functions described in this section. The malware packed with Yoda’s Protector, it calls CreateToolHelp32Snapshot() to obtain the PIDs and process all running processes’ information. Next, it uses the GetCurrentProcessId() to get its process information and then compares the two results. If the parent process is a debugger, it interrupts analysis by terminating the process. Therefore, to defeat this anti-debugging technique, GetCurrentProcessId() always returns the PID of a debugger or analysis tool by modifying the PID of the debugger and debuggee to be the same. Analysts can defeat this technique. The code on the left side of Figure 8 is the original code of GetCurrentProcessId(), and the code is modified the same as on the right side of Figure 8 to defeat this function. To match the PID of the debugger and debuggee, it stores the PID of the debugger (0x0EA0 in Figure 8) in the EAX register and returns it. At this point, NOP instruction fills the remaining space of memory.
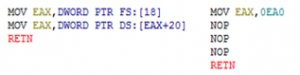
Figure 8: The original code (left) and modification code (right) of the GetCurrentProcessId()

Figure 9: The original code (left) and modification code (right) of BlockInput()
The BlockInput() blocks the input events such as keyboard and mouse. When software calls this function, the computer blocks all events from input devices. By blocking all input devices’ events, signals from devices do not affect the input queue’s synchronous key state and asynchronous key state. If the software calls this function while running, the computer blocks the input devices’ events, and there is no solution until the software calls again. The malware exploits this. If malware calls this function while debugging, the computer blocks all events from input devices, and analysis stops. The only solution is to reboot the computer and analyze the malware again from the beginning. This function has a BOOL value as a parameter. If the parameter is TRUE, the computer blocks the events. If FALSE, the computer unblocks the events. This function returns to non-zero if it ends with no errors. The corresponding code is the left code of Figure 9. The way to defeat this technique is more straightforward than others. As shown on right side of Figure 9, this is defeated by modification with NOP instruction, which does nothing.
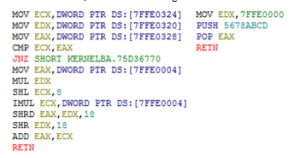
Figure 10: The original code (left) and modification code (right) of the GetTickCount()
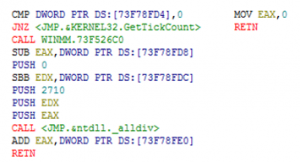
Figure 11: The original code (left) and modification code (right) of timeGetTime ()
3.7. GetTickCount(), timeGetTime()
The anti-debugging techniques described so far are anti-debugging based on artifacts. Those are techniques in which malware detect analysis signs, analysis environment, or debugger. The anti-debugging based on artifacts is the most common and useful technique for malware to evade analysis. If a debugger runs the program, there are differences from normal execution. The anti-debugging based on artifacts confirms the debugger through these differences.
However, the anti-debugging described in this section is slightly different from the previous ones. The anti-debugging described in this section uses time elements. The anti-debugging based on time measures the time between a particular routine. It compares the execution in the real system and the execution analysis environment and indirectly detects the debugger. It measures the time stamp counter cycle before and after starting a particular routine in a program to confirm a debugger’s presence because the analysis using a debugger takes a long time.
GetTickCount() starts counting after Windows boots. Through this function, malware or software can easily determine how long it has been since the computer booted up and got time value every time stamp counter cycle. The return value is the 32-bit form to keep the count for up to 49.7 days. Many developers use this function to measure elapsed time, and malware developers use it as well. The code on the left in Figure 10 is the original code of GetTickCount(). To defeat this, it must return the same value by hard coding. Hard coding is the way to develop software by embedding data directly into the source code or memory. In this way, it stores a meaningless value in the EAX register. Therefore, the return value of GetTickCount() is always meaningless value which hard coded. In other words, the measured time for a specific routine is always same.
timeGetTime() has less overhead than timeGetSystemTime(), because timeGetSystemTime() uses a MMTIME structure, which contains timing information for different multimedia data types. However, timeGetTime() uses a DWORD structure. Moreover, timeGetTime() reacts directly to timer interruptions and returns the time in milliseconds that have elapsed since the Windows booted, thus GetTickCount(). The debuggee can determine the presence of the debugger by using precise functions such as timeGetTime(). Disabling this is not much different with GetTickCount(). To defeat this function, one must to return the same value all the time. The code on the left of Figure 11 is the original code of timeGetTime(). However, if modified as the code on the right side of Figure 11, debuggee fails to detect the presence of debugger because it always returns the same value.
4. Experiments
This study implemented a sample program which includes anti-debugging techniques for the (i) Sample-ex experiment. The sample program has various anti-debugging techniques such as the PEB, and HEAP, among others. The sample program printed the return value to verify the results of the anti-anti-debugging intuitively. In the second experiment, (ii) Packed-ex, packed programs were used for packed malware or packed software. This study confirms the effectiveness of the proposed anti-anti-debugging mechanisms using these programs. Finally, real malware was employed in the in (iii) Malware-ex experiment. The anti-anti-debugging proposed in this paper works well with benign files, packed files, and actual malware through the step by step experiments.
Table 4: Anti-debugging techniques of each packer
| Packer | Anti-Debugging Techniques |
| PECompact | IsDebuggerPresent() |
| Armadillo | IsDebuggerPresent() |
| ACProtect | IsDebuggerPresent() |
| ZwQueryInformationProcess() | |
| Themida | IsDebuggerPresent() |
| ZwQueryInformationProcess() | |
| Yoda’s Protector | IsDebuggerPresent() |
| GetCurrentProcessId() | |
| BlockInput() |
Table 5: Information of real virus
| File Type | Win.32.EXE |
| Virus Type | Worm/Win32.Abuse |
| MD5 | 068c3b80106b3300548bv6vv673a3db5 |
| Anti-Debugging Techniques |
GetTickCount() |
| FindWindowExA() | |
| FindWindowA() |
4.1. Experimental Data
This paper implemented a sample program including various anti-debugging techniques for (i) Sample-ex experiment, as shown in Figure 12. This program prints different results depending on the presence of a debugger. Next, sample files used in the (ii) Packed-ex experiment, packed the calculator program provided by Windows 7 (32bit) into five packers or protectors. The common feature of used packers or protectors is that they protect the original software by applying one or more anti-debugging techniques. Five packers called Yoda’s Protector, Themida, ACProtect, Armadillo, and PECompact for (ii) Packed-ex experiment were used. These packers apply one or more anti-debugging techniques to protect original program against reverse engineering. Table 4 shows the anti-debugging techniques applied by each packer.
Among these, the most commonly used function is IsDebuggerPresent(), and the unusual cases are GetCurrentProcessId() and BlockInput() used by Yoda’s Protector. Table 5 shows information about one of the malware samples collected from VirusShare**, which is for the (iii) Malware-ex experiment. This malware sample uses GetTickCount(), FindWindowExA(), and FindWindowA() functions for anti-debugging. However, it is impossible to analyze some samples using different anti-debugging techniques such as RDTSC instruction and Self-Modifying technique.
RDTSC is an instruction that reads the current time-stamp counter variable. Unlike function such as timeGetTime(), RDTSC is executed as a single instruction. In order to bypass this instruction, it is necessary to modify the debuggee. However, modifying the debuggee requires careful attention. Self-Modifying is one of anti-analysis techniques. It is a technique to alter its own codes while the file is executing. Therefore, an analyst fails to identify the real instructions before executing Self-Modifying. Thus, RDTSC and Self-Modifying are out of our research scope and this paper does not handle these techniques.
4.2. Experimental Results
Figure 13 shows the results of analyzing sample data in the debugger in (i) Sample-ex. In the case of Figure 13 (a), all of the anti-debugging techniques used in the sample program detected a debugger. All of these anti-debugging techniques returned and printed artifact or evidence which indicates the presence of a debugger. However, an analysis was made again using anti-anti-debugging, and the results were confirmed, as shown in Figure 13 (b). It showed a completely different artifact or evidence and message against Figure 13 (a).
This research primarily confirmed that the anti-anti-debugging works successfully. Next, it conducted (ii) Packed-ex and analyzed using different data. The analysis from this point shows that the results of the analysis are limited. Therefore, the actual memory address and instructions were shown. Figure 14 (a) is the loaded file with Yoda’s Protector in the debugger. The number series on the left correspond to each address, and instructions on the right correspond to the original code. Figure 14 (b) shows the new code to defeat GetCurrentProcessId(). It stored the PID of the debugger, which is 0x0B5C in the EAX register, to make it the same as shown in Figure 14 (b). This study also confirmed the results of ZwQueryInformationProcess() used by ACProtect, as shown in Figure 15. Figure 15 (a) is the original code and address of ZwQueryInformationProcess(), and Figure 15 (b) is the new instructions to defeat it. At this time, 0x003E0000 is the address of the virtual memory. Through this, whether the anti-anti-debugging is effective even in packed samples was secondarily ascertained.
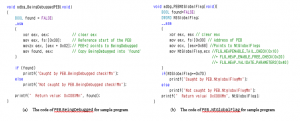

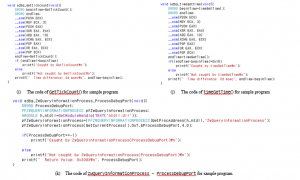
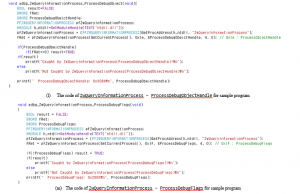
Figure 12: Anti-debugging functions for sample program
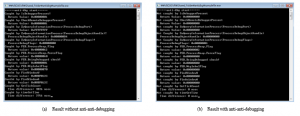
Figure 13: Results of (i) Sample-ex; (a) results without anti-anti-debugging; (b) results with anti-anti-debugging
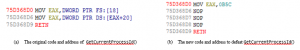
Figure 14: Results of (ii) Packed-ex in Yoda’s Protector; (a) the original code and address of GetCurrentProcessId(); (b) the new code and address to defeat GetCurrentProcessId()

Figure 15: Results of (ii) Packed-ex in ACProtect; (a) the original code and address of ZwQueryInformationProcess (); (b) the new code and address to defeat ZwQueryInformationProcess ()
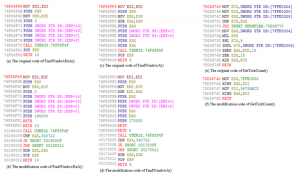
Figure 16: Results of (iii) Malware-ex; (a), (c) and (e) are the original code of each anti-debugging; (b), (d), and (f) are modification code to defeat each anti-debugging techniques
Table 6: Comparison results of anti-anti-debugging experiments with other works (O: successful, X: failed)
| Technique | Proposed Work | Pin | Apate | Binary Substitution |
| IsDebuggerPresent() | O | O | O | O |
| CheckRemoteDebuggerPresent() | O | O | X | O |
| FindWindow() | O | O | X | O |
| QueryInformationProcess()
(ProcessDebugPort) |
O | O | X | O |
| QueryInformationProcess()
(ProcessDebugFlags) |
O | X | X | O |
| QueryInformationProcess()
(ProcessDebugObjectHandle) |
O | O | O | O |
| GetTickCount() | O | O | O | X |
| timeGetTime() | O | O | O | X |
| GetCurrentProcessId() | O | X | X | X |
| BlockInput | O | X | O | X |
| PEB.BeingDebugged | O | O | O | O |
| PEB.NtGlobalFlag | O | O | O | O |
| HEAP.Flags | O | O | O | X |
| HEAP.ForceFlags | O | O | O | X |
| RDTSC Instruction | X | X | O | O |
| Self-Modifying | X | X | X | X |
| Success Rate | 87.5% | 68.8% | 62.5% | 56.3% |
Finally, this paper collected and experimented with malware, which has anti-debugging techniques for (iii) Malware-ex. As a result of the (ii) Packed-ex experiment, this paper listed the address and instructions in Figure 16, which shows the loaded malware sample results used in (iii) Malware-ex on the debugger and the results of defeating its anti-debugging techniques. Figure 16 (a) is the original code of FindWindowExA(), and Figure 16 (b) is the new code that defeats it. This study wrote a new code that was occupied in 0x00190000 virtual memory to defeat the function. Figure 16 (c) is the original code of FindWindowA(), and the code that defeats it is Figure 16 (d). This study occupied and wrote the new code on the memory address 0x00170000 to defeat this. As mentioned before, virtual memory addresses cannot always be the same and must occupy the memory with empty space. The last anti-debugging technique is GetTickCount(). Figure 16 (e) is the original code of this function, modified as in Figure 16 (f), in which malware failed to detect the presence of a debugger, and the malware analysis could proceed. Thus, this study experimented and confirmed step by step that the anti-anti-debugging proposed in this paper is effective.
Table 6 shows the experimental results for 16 anti-debugging techniques. The Binary Substitution [25], which shows the lowest success rate among each work, changes debuggee’s binary. It requires special attention. Pin [4] is an excellent analysis tool, but it cannot defeat the anti-debugging techniques used by Yoda’s Protector. Apate [23], which has a similar success rate to Pin, has also been unable to defeat the anti-debugging techniques used by Yoda’s Protector, and it can defeat fewer anti-debugging techniques than Pin. As shown in Table 6, most anti-debugging techniques are based on APIs, PEB, and HEAP structures. However, there are far more anti-debugging techniques, and their research is needed for future works.
Among the many samples, there were some that this paper failed to analyze. Because this work can defeat some APIs and PEB structure-based anti-debugging techniques, the anti-debugging using different artifacts could not be defeated, such as RDTSC instruction, Memory Breakpoint, Self-Modifying, and Single-Step Detection [22].
5. Conclusion
Malware as well as commercial packers use various anti-debugging techniques to protect themselves from the analysis by reverse engineering. Anti-debugging techniques can bypass or neutralize debugging analysis. An analyst needs an advanced debugger and related knowledge in order to analyze malware with anti-debugging techniques. Thus, this study proposed an anti-anti-debugging against the anti-debugging techniques. In order to explain the anti-anti-debugging, we expounded the anti-debugging techniques used by malware and packers. Also, it set up a step by step experiment for verification. It implemented, experimented, and analyzed sample files, and packed files with anti-debugging techniques. Finally, it experimented with the actual malware with many anti-debugging techniques. As a result of a step by step experiment, it found that proposed anti-anti-debugging can defeat the anti-debugging techniques and deal with actual malware. It did not interfere with program execution flow as less as possible by minimizing the debuggee’s direct modification. Of course, the method proposed in this paper cannot defeat all anti-debugging techniques. Nevertheless, the method serves an essential part in analyzing malware with a debugger. Furthermore, it improves the ability to handle sophisticated debugging evasion techniques.
Also, debuggees, such as Yoda’s Protector, can call the anti-debugging techniques more than once to interfere with the analysis. However, the anti-anti-debugging proposed in this paper has the advantage of being able to defeat the anti-debugging technique that is called multiple times by only modifying it once. There are several tools and methods to disable anti-debugging techniques, however, none elaborate on how to disable it or explain with assembly code. Thus, this paper aims to discover for analysts new ways to defeat anti-debugging techniques and help researchers develop their scripts for research and analyze malware.
Data Availability
The script file used in the experiments is available at https://github.com/goldbear564/antiantidebugging.
Conflict of Interest
The authors declare no conflict of interest.
Acknowledgment
This work was supported by the National Research Foundation of Korea (NRF) grant funded by the Korea Government (MSIT) (No. NRF-2020R1A2C1012117, Development of machine learning based intrusion detection platform to secure end device in edge computing environment) and Institute of Information & communications Technology Planning & Evaluation (IITP) grant by the Korea government (MSIT) (No.2017-0-00158, Development of Cyber Threat Intelligence (CTI) analysis and information sharing technology for national cyber incident).
- R. Goyda, S. Sharma, and S. Bevinakoppa, “Obfuscation of stuxnet and flame malware,” In. Proc. of the 3rd international conference on applied informatics and computing theory(AICT’12), 150–154, 2012.
- J. W. Kim, J. Bang, Y.S. Moon, and M. J. Choi, “Disabling anti-debugging techniques for unpacking system in user-level debugger,” in 2019 International Conference on Information and Communication Technology Convergence(ICTC), Jeju Island, South Korea, 2019, doi:10.1109/ICTC46691.2019.8939719.
- M. N. Gagnon, S. Taylor, and A. K. Ghosh, “Software protection through anti-debugging,” IEEE Security & Privacy, 5(3), 82–84, 2007, doi:10.1109/MSP.2007.71.
- C.K. Luk, R. Chon, R. Muth, H. Patil, and A. Klauser, “Pin: building customized program analysis tools with dynamic instrumentation, ” ACM SIGPLAN Notices, 40(6), 190–200, 2005, doi:10.1145/1064978.1065034.
- B. B. Rad, M. Masrom, and S. Ibrahim, “Camouflage in malware: From encryption to metamorphism, ” International Journal of Computer Science and Network Security, 12(8), 74–83, 2012.
- S. Bardin, R. David, and J. Y. Marion, “Backward-bounded DSE: targeting infeasibility questions on obfuscated codes,” 2017 IEEE Symposium on Security and Privacy, 633–651, 2017, doi:10.1109/SP.2017.36.
- T. Blazytko, M. Contag, and C. Aschermann, “Syntia: Synthesizing the Semantics of Obfuscated Code,” In Proc. of USENIX Security Symposium, 643–659, 2017.
- R. Vinayakumar, M. Alazab, K. P. Soman, P. Poornachandram, and S. Venkatran man, “Robust intelligent malware detection using deep learning,” IEEE Access, 7, 46717–46738, 2019, doi:10.1109/ACCESS.2019.2906934.
- X. Chen, J. Andersen, Z. M. Mao, and M. Bailey, “Towards an understanding of anti-virtualization and anti-debugging behavior in modern malware,” in 2008 IEEE international conference on dependable systems and networks with FTCS and DCC(DSN), 177–186, 2008, doi:10.1109/DSN.2008.4630086.
- M. J. Choi, J. Bang, J. W. Kim, H. Kim, and Y. S. Moon, “All-in-one framework for detection, unpacking, and verification for malware analysis,” Security and Communication Network 2019, 2019(5278137), 1–16, 2019, doi:10.1155/2019/5278137.
- S. Cesare, Y. Xiang, and W. Zhou, “Malwise – an effective and efficient classification system for packed and polymorphic malware,” IEEE Transaction on Computers, 62(6), 1193–1206, 2013, doi:10.1109/TC.2012.65.
- F. Guo, P. Ferrie, and T. C. Chiueh, “A study of the packer problem and its solutions,” in International Workshop on Recent Advances in Intrusion Detection, 98–115, 2008, doi:10.1007/978-3-540-87403-4_6.
- J. M. Borello, and L. Mé, “Code obfuscation techniques for metamorphic viruses,” Journal in Computer Virology, 4(3), 211–200, 2008, doi:10.1007/s11416-008-0084-2.
- I. You, and K. Yim, “Malware obfuscation techniques: a brief survey,” in 2010 International conference on broadband, wireless computing, communication and applications, 297–300, 2010, doi:10.1109/BWCCA.2010.85.
- A. Moser, C. Kruegel, and E. Kirda, “Limits of static analysis for malware detection,” in 23rd Annual Computer Security Applications Conference(ACSAC’07), 421–430, 2007, doi:10.1109/ACSAC.2007.21.
- R. R. Branco, G. N. Barbosa, and P. D. Neo, “Scientific but not academical overview of malware anti-debugging, anti-disassembly and anti-vm technologies,” in Blackhat, USA, 2012.
- S. Gao, and Q. Lin, “Debugging classification and anti-debugging strategies,” in 4th International Conference on Machine Vision(ICMV): Computer Vision and Image Analysis; Pattern Recognition and Basic Technologies, 729–734, 2012, doi:10.1117/12.924835.
- P. Chen, C. Huygens, L.Desmet, and W. Joosen, “Advanced or not? a comparative study of the use of anti-debugging and anti-vm techniques in generic and targeted malware,” in IFIP International Conference on ICT Systems Security and Privacy Protection, 323–336, 2016, doi:10.1007/978-3-319-33630-5_22.
- S. Bhansali, W. K. Chen, S. D. Jong, A. Edwards, “Framework for instruction-level tracing and analysis of program executions,” In Proc. of the 2nd International Conference on Virtual Execution Environments, 154–163, 2013, doi:10.1145/1134760.1220164.
- P. Feiner, A. D. Brown, and A. Goel, “Comprehensive kernel instrumentation via dynamic binary translation,” In Proc. of the 17th international conference on Architectural Support for Programming Languages and Operating Systems, 135–146, 2012, doi:10.1145/2150976.2150992.
- N. Nethercote, and J. Seward, “Valgrind: a framework for heavyweight dynamic binary instrumentation,” ACM SIGPLAN Notices, 42(6), 89–100, 2007, doi:10.1145/1273442.1250746.
- S. Choi, T. Chang, S. Yoon, and Y. Park, “Hybrid emulation for bypassing anti-reversing techniques and analyzing malware,” The Journal of Supercomputing, 1–27, 2020, doi:10.1007/s11227-020-03270-6
- H. Shi, and J. Mirkovic, “Hiding debuggers from malware with apate,” In Proc. of the Symposium on Applied Computing, 1703–1710, 2017, doi:10.1145/3019612.3019791.
- J. K. Lee, B. J. Kang, and E. G. Im, “Rule-based anti-anti-debugging system,” In Proc. of the 2013 Research in Adaptive and Convergent Systems, 353–354, 2013, doi:10.1145/2513228.2513301.
- J. K. Lee, B. J. Kang, and E. G. Im, “Evading anti-debugging techniques with binary substitution,” International Journal of Security and its Applications, 8(1), 183–192, 2014, doi:10.14257/ijsia.2014.8.1.17.
- P. Feng, J. Sun, S. Liu, and K. Sun, “UBER: combating sandbox evasion via user behavior emulators,” International Conference on Information and Communications Security, 34–50, 2020, doi:10.1007/978-3-030-41579-2_3
- D. P. Pham, D. L. Vu, and F. Massacci, “Mac-A-Mal: macOS malware analysis framework resistant to anti evasion techniques,” Journal of Computer Virology and Hacking Techniques, 15(4), 249–257, 2019, doi:10.1007/s11416-019-00335-w.
- O. Or-Meir, N. Nissim, Y. Elovici, and L. Rokach, “Dynamic malware analysis in the modern era- a state of the art survey,” ACM Computing Surveys (CSUR), 52(5), 1-48, 2019, doi: 10.1145/3329786.
- C. V. Liţă, D. Cosovan, and D. Gavriluţ. “Anti-emulation trends in modern packers: a survey on the evolution of anti-emulation techniques in UPA packers,” Journal of Computer Virology and Hacking Techniques, 14(2), 107–126, 2018, doi:10.1007/s11416-017-0291-9.