
A Novel Approach of Smart Logistics for the Health-Care Sector Using Genetic Algorithm
Volume 5, Issue 6, Page No 1143-1152, 2020
Author’s Name: Marouane EL Midaouia), Mohammed Qbadou, Khalifa Mansouri
View Affiliations
Signals, Distributed Systems and Artificial Intelligence ENSET Mohammedia, University Hassan II of Casablanca, 20000, Morocco
a)Author to whom correspondence should be addressed. E-mail: marouane.elmidaoui@gmail.com
Adv. Sci. Technol. Eng. Syst. J. 5(6), 1143-1152 (2020); ![]() DOI: 10.25046/aj0506138
DOI: 10.25046/aj0506138
Keywords: Health-Care Facilities Clustering, Genetic Algorithm, Vehicle Routing, Hospital Logistic, MDVRP

Export Citations
The heath-care sector has confronted significant difficulties in the past few years due to several issues such as insufficient human resources, budget cuts, and shortage of equipment and drugs. The logistics in the health-care sector take an extensive part of the budget, especially since it is the main axis to provide the hospital’s pharmacies with goods (drugs and materials).The delay in the delivery of drugs, inappropriate transport conditions, and quality are the main challenges for the health-care supply chain.
These issues will affect the user and hospital satisfaction and product quality during transportation/storage. The Geo-Distributed storages play a considerable role to provide equipment and drugs faster, thus, routing and scheduling method and also clustering method for geographic data is needed for defining regions and areas to be served by distributed storage. Having multiple storages to severe multiple health-care facilities it can be presented as Multiple Depot Vehicle Routing Problem (MDVRP) which can be solved using metaheuristics, however, the MDVRP cannot take into account the nature of the context (health-care), priority, and capacity of the facility to serve which is in this context the hospital bed capacity (HBC).
This paper presents a new smart logistic method for the health-care sector to provide a better drug pulling system, by using the clustering method to provide a suitable location for new pharmacies and using genetic algorithm to perform routing and scheduling for Multi-Depot Vehicle Routing Problem (MDVRP) in the health-care context to feed the hospital’s pharmacies with goods. This approach considers planned routes from the depot (central/regional pharmacy) to hospitals, as chromosomes, and groups the chromosome based on geographic distance and hospital bed capacity as a cluster. This method provides results with minimal computing power and resources and less calculation time.
Received: 26 September 2020, Accepted: 26 November 2020, Published Online: 14 December 2020
1. Introduction
Logistics play a major role in sustaining hospitals and health-care facilities as motioned in [1], from operating rooms to patient bed and health-care units, they are all supplied by hospital pharmacies with drugs and equipment. As shown in figure 1, those pharmacies are supplied by health-care warehouses or in other words central pharmacies, in the same case, the goods can be sent to another warehouse (regional pharmacy) to provide a more accessible warehouse to the hospital. Each regional pharmacy is responsible for serving hospitals and facilities in a region; those Hospitals vary greatly geographically and demographically. This has a significant impact on how health-care logistics practices can be applied in each region. As a result, the drug takes time to be delivered and low quality of transport, which causes the patient to be unsatisfied, and that affects the service quality. Also, the quality can be affected by other factors such as the drug needs and bed capacity in each hospital (HBC).
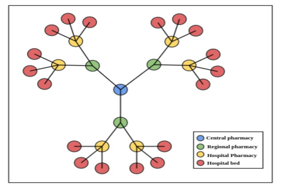
Figure 1: Drug’s supply chains in health-care
The regional pharmacy needs to store a specific number of drugs based on hospital needs. Therefore, a drug pulling system is needed. The idea to build regional pharmacies for each region is unrealistic, due to the limit of the construction budget, human resource, and infrastructural factor. That is why an alternative solution is building a regional pharmacy that can serve multi-region hospitals. In this case, the system needs to cluster health-care facilities based on each region’s needs to determine the suitable set or regions that can be served by the selected pharmacy, with the proposition of the nearby position for pharmacy construction. However, in many cases such as pandemic disease period and urgent situation, the region pharmacy has to serve multiple hospitals at once or even serve other hospitals in other nearby region’s hospitals, which can be presented as routing and scheduling issues of the drugs to hospitals from regional pharmacies. In this case, an intelligent transportation system (ITS) approach needs to be applied to provide routing and scheduling solutions.
Nowadays, researchers use clustering methods besides Artificial Intelligence to solve similar issues related to routing and scheduling problems. The genetic algorithm is an optimization technique based on a parallel search mechanism which makes it more efficient than other classical optimization techniques. It reflects the process of natural selection, using the genetic operation as crossover and mutation to escape the local optimum by selecting the fittest individuals to reproduce a new population.
This paper will discuss at first section Multiple Depot Vehicle Routing Problem and the mathematical formulation, in the second section will present the approach of clustering region by geographic distance and hospital bed capacity, with a comparison between three well-known clustering methods. The third section is dedicated to the routing and scheduling method using genetic algorithm for drug delivery between Regional pharmacies and hospitals based on drug demand
2. Literature Review
Multi-Depot Vehicle Routing Problem is considered one of the well-known problems in the research field currently for solving the delivery of goods in multi-depot instead of one depot as VRP, the goal is to optimize cost and exchange between multiple sources and destinations. As proposed in [2], the author presents an approach using a model MDGVRP (MD green VRP) based on an ant colony with a solution to route the optimal path while considering the capacity of the vehicle and fuel capacity.
An ordinary algorithm can resolve vehicle routing problems. However, Multi depot vehicle routing problems cannot be resolved without consuming high computing power and resources, and the precision is still questionable. To get better precision, the genetic algorithm (GA) can be used in this case, because of the stochastic properties and efficiency of GA, also MDVRP can be resolved by using those techniques. In [3] author measure the MDVRP efficiency with and without GA, the result can be concluded to good impact on MDVRP while using the GA in term of performance, Also in [4] the author described an approach to resolve the MDVRP based on clustering algorithms, the authors proposed two algorithms, first one is the ‘Minimum Distance‘, after sorting the distance from suppliers to depots, the supplier with the minimum distance is selected for the nearest depot without exceeding the depot capacity, and repeating the process until all supplier have been assigned. The second algorithm is ‘Minimum Distance with Balancing Depot ‘, the first supplier located nearest to the depot will be chosen to be assigned, after. each unassigned depot will be assigned to the closest supplier sequentially provided that their supply does not exceed the depot’s capacity. In [5] the author developed a new method based on machine learning with a combination of GA for solving problems related to VRP, this method learn to classify the coordinates into regions which drive to divide to routing calculations into regions, this method provides many benefits over previous research and traditional solutions used by companies by 25.68% of routing cost, and 8.1% over classical GA methods[4], also the ML side of this algorithm can predict of future customer regions which give new behavior to resolve the problem.
Clustering has been used to solve problems in diverse fields as bioinformatics, data mining, several methods, and clustering algorithms have been proposed to define hospital clusters. William Thomas has contributed several times for clustering and identifying hospitals with a methodology of clustering communities and hospitals simultaneously, which led to a geographically connected area of populations served by a common cluster of hospitals [1-6]. The State of Michigan has applied the Thomas methodology. In [7] the author explains an approach based on disease-specific hospital networks with considering similarity among disease symptoms, k-mean is among the most popular clustering algorithms [8], K-means is an unsupervised algorithm for non-hierarchical clustering, making it possible to group in K distinct clusters the observations of the data set. Thus, similar data will be in the same cluster. Moreover, an observation can only be found in one cluster at a time (exclusivity of belonging). The same observation, therefore, cannot belong to two different clusters. In [9] the author audited similarity in geographic location and patient utilization to create health-care facilities clus0ters by using two steps k-means clustering. In [10] the author uses cluster analysis to group health-care facilities based on the distribution of health-care spending across service categories with k-means as a clustering technique. On the other hand, by comparing centralized and decentralized pharmacies structure. In [11] author used the Weighted k-Means Algorithm to cluster Text, in [12] author showed that in the case of centralized pharmacies, the cost of transport is reduced, which makes the logistics chain less expensive. The transportation of goods — which, in this case, are drugs and equipment — are linked to the routing and scheduling, these two factors can give satisfaction for the consumer, in our cases, it is the hospitals and patients. Many studies have been proposed to solve the routing and scheduling problem, in 1995 [13] the author introduced the MDVRP. In [14] the author proposed two solutions for the MDVRP problem based on Genetic algorithms. Both authors in [15] and [16] tried to solve the problem with exact methods. However, the author of [17] demonstrated that both techniques are not effective. In [18] proposed an approach to solve for Priced MDVRP, which the vehicle visits customer only if it is profitable, they propose two methods: the heuristic method to solve the MDVRP and mixed-integer linear programming (MILP), and conclude that heuristics give better results. In [19] author solved the MDVRP with separate delivery by proposing a heuristic based on integer programming.
3. Positioning the Contribution
As mentioned above, transportation is a main part of health-care. Costs invested in logistics can exceed 50% [20] of the hospital budget. In addition to the coasts, there are infrastructural issues. Those kinds of issues can cause slow delivery and affect the patient’s satisfaction. The good’s quality can also be affected by several aspects, such as the delivery condition especially if the central pharmacy or regional pharmacies are located in another region or distant region, caused by the lack of structure and construction of pharmacy, or pharmacies that are not well distributed or centralized in some specific region based on a political decision. Besides infrastructural issues, the organization is also involved, especially for routing and scheduling, to distribute drugs, regional pharmacy needs to prepare and send a vehicle with the quantity or equipment of specific drug without exceeding the vehicle capacity, but also there are some cases when other regional pharmacies can serve other region’s hospitals. Especially if the vehicle capacity and the distance (the hospital in the same pharmacy region are near to other region’s hospitals) can afford the delivery or in urgent cases. This challenge can’t be resolved by the traditional VRP (Vehicle Routing Problem), because in this case, we are facing a multi-depot routing (Multi-regional pharmacies).
Our contribution/model allows solving the above issues and challenges, by proposing locations for the construction of future regional pharmacies, based on the number of newest pharmacies, geographic distance, and hospital bed capacity in each cluster (a group of hospitals). Also, the model improves the routing and scheduling for drug delivery, while allowing regional pharmacies to serve other regional hospitals in specific cases without overlap between pharmacies for serving the targeted hospital. The proposed contribution has been applied to solve a recent challenge pointed by the Ministry of the health of Morocco. In this paper, we propose a solution to improve the creation of new centralized pharmacies and determine the methodology of good’s (drugs and equipment) delivery to regions, by clustering regions who will be served by regional pharmacies as the first step based on Performance indicators shared by the same ministry [21]. The second step is to project the MDVRP problem to the logistic chain of health-care by making the hospital (or set of hospitals) as a customer and centralized pharmacies as a depot.
4. Vehicle Routing With Several Pharmacies
4.1. Background
The distribution of goods based on routing paths is one of the most important challenges of logistics currently. In general, the cost is associated with the distance. Costs invested in transportation exceed 50% of the total cost of a supply chain [20]. The objective then is to minimize the cost of combined routes on Multi-depot vehicle routing problems (MDVRP) by minimizing the distance traveled by a group of vehicles exposed to different requirements. However, MDVRP is a non-deterministic polynomial-time (NP-Hard) for deciding the courses of several vehicles of several depots to a group of customers simultaneously and return to the same deposit without surpassing the capacity limit of each vehicle.
The Vehicle Routing Problem (VRP) as illustrated in figure 2, is a class of operational search and combinatorial optimization problems. The aim is to determine the routes of a fleet of vehicles to deliver a list of customers or to carry out tours of interventions (maintenance, repairs, and checks) or visits (medical visits, commercial, etc.). The main idea is to minimize the cost of delivering goods. This problem is a classic extension of the traveling salesman problem. It is an employee who is responsible for distributing products (or services) on behalf of one or more employers.
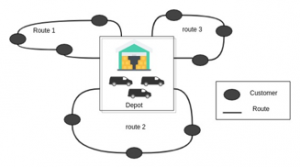
Figure 2: Illustration of Traditional VRP
MDVRP is a VRP with Multi depots from which the vehicle can serve its customers. If customers are grouped around repositories, then the distribution problem must be modeled as a set of independent VRPs. However, if clients and repositories are intertwined or for specific needs the delivery must be from another depot, the problem of multi-depot vehicle routing needs to be resolved. As shown in figure 3, the MDVRP processes several numbers of deposits. Each vehicle or set of vehicles is assigned to a single depot, which is usually both the origin and destination of the vehicle route
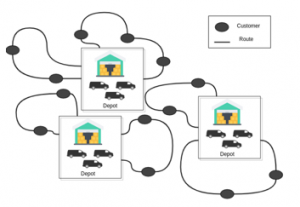
Figure 3: Illustration of MDVRP
We can group the approaches to solve the VRP into two doctrines: Exact algorithms and heuristics algorithms. Obviously, the MDVRP is more complex to solve than a simple VRP. Consequently, propose an optimal solution for an NP-hard problem takes a long time, and maybe impossible with an exact algorithm. Both authors in [15] and [16] tried to solve the problem with exact methods. However, the author in [17] demonstrated that both techniques are not effective. In [18], the author proposes an approach to solve for Priced MDVRP, which the vehicle visits the customer only if it is profitable, they propose two methods: heuristic method to solve the MDVRP, and mixed-integer linear programming (MILP), and conclude that heuristics give better results.
It is unrealistic to use Linear Programming (LP) to solve large instances of the problem [22]. The intelligent algorithm is more widely applied, so the proposition is GA as a heuristic algorithm and one of the most promising hybrid intelligent methods for optimization problems. Distribution logistics encompasses all activities related to the supply of finished products and goods to customers. The central point of distribution logistics is the transportation of goods from the manufacturer to the consumer.
In our case, the manufacturers are a set of centralized pharmacies, and consumers are presented as hospitals’ pharmacies. The idea of this contribution is to project the MDVRP model into the need for pharmacy logistics, representing centralized pharmacy as a single depot and hospitals as customers (or set of customers in cases of delegated hospitals to another hospital or health center). In some cases, one central pharmacy (CP) is not enough for some regions, also grouping/clustering phase is needed for our proposition, the grouping approach focuses on grouping hospitals and provides a suitable geographical place to consider building regional pharmacy while taking into account both distance and bed availability as a performance indicator in each region and hospitals which will be described in the next section.
4.2. Mathematical formulation
We can present our MDVRP mathematically as follows: is a graph where V is the set of vertices partitioned into two collections.
Represent the list of the hospitals.
represent the collection of centralized pharmacies, set of edges connecting two points.
Cost matrix is the length of arc (corresponding to distance) Expecting symmetry, and the distance between sets of three points satisfies the triangle inequality.
Each centralized pharmacy has the same model. (The number of vehicles at the CP) are identical in term of vehicle (model, capacity Q, shape).
We consider the following:
Each vehicle starts from a centralized pharmacy (CP), serving a set of hospitals, at the end of the route or when Q is not enough to serve the next Hospital, the vehicle must return to the starting CP to refill.
Every hospital is visited only once by one vehicle, we consider in this example that a route can be done only by one vehicle.
The total demand for each route does not exceed the vehicle capacity Q
The vehicle cannot exceed the vehicle capacity Q, and the number provided by each CP is limited.
Centralized Pharmacies cannot serve each other’s (CP cannot serve another CP).
The main objective for MDVRP, in this case, is to link hospitals into the proper CP with minimization of distance traveled by vehicle across the network.
hospitals are grouped to form m clusters. Each cluster consists of number of hospitals.
The number of vehicles based at a CP is .
is the group of hospital linked to a vehicle
Based on [23], MDVRP formulation for finding x which is the minimizes can be described as following:

The objective function according to Equation (1) minimizes the total delivery distance and cost of each vehicle within a CP. (2) limits capacity Q of the vehicle, (3) indicates the hospitals served by every vehicle must not overtake the number of the hospital a CP can deliver to. (4) shows the sum of the hospitals served by the whole route should be the sum of the hospitals served by CP m. (5) shows every hospital served by a CP. (6) guarantee that every hospital must be visited only once by vehicle. (7)(8) is the value bound of the decision variables.
5. Clustering Algorithms with Multiple Health-care Facilities
5.1. Clustering based on distance and HBC
Clustering is organizing objects (data) into homogeneous groups based on specific characteristics (data points) so that similar objects are kept in groups, while dissimilar objects belong to different groups or in other cases ignored.
Clustering algorithms are used in many fields such as image segmentation to group similar regions, insurance fraud detection, document clustering based on topics keywords, identifying crime-prone areas, customer segmentation for grouping customers based on behavior and needs, and public transport data analysis.
With 12 administrative divisions as regions, Morocco is the most north-western country in Africa. The construction of centralized pharmacies is for serving the hospitals pharmacies in defined regions, several approaches have been proposed to cluster hospitals [1, 6, 7, 9, 10]. We propose in our work clustering by Performance indicators of regions instead of hospitals. The data provided are grouped by regions.
The performance indicators in our case are Hospital Bed Capacity (HBC) by region. Table 1 shows the HBC in Morocco by region with latitude and longitude for each region. Table 1 presents the old territorial division based on 16 regions besides the HBC
Table 1: The HBC by Region in Morocco for 2015
| REGION | ID | HBC | Geo-Position |
| Oued Ed-Dahab-Lagouira | A | 53 | (22.733, -14,286) |
| Laâyoune-Boujdour-Sakia El Hamra | B | 313 | (25.443 -13,174) |
| Guelmim-EsSemara | C | 322 | (28.708 -9,545) |
| Souss-Massa-Draa | D | 2199 | (31.120, -6,067 |
| Marrakesh-Tensift-El Haouz | E | 2347 | (31.562, -7,959) |
| Meknes-Tafilalet | F | 663 | (31.905, -4,727) |
| Tadla-Azilal | G | 964 | (32.004, -6,578) |
| Doukkala-Abda | H | 2872 | (32.599, -8,660) |
| Chaouia-Ouardigha | I | 1343 | (33.047, -7,265) |
| Fes-Boulemane | J | 1474 | (33.187, -4,233) |
| Oriental | K | 1739 | (33.419, -2,145) |
| Grand Casablanca | L | 826 | (33.520, -7,568) |
| Rabat-Sale-Zemmour-Zaer | M | 2884 | (33.817, -6,237) |
| Taza-Al Hoceima-Taounate | N | 1506 | (34.258, -4,233) |
| Gharb-Chrarda-BeniHssen | O | 757 | (34.543, -5,898) |
| Tangier-Tetouan | P | 813 | (35.262, – 5,561) |
The above table contains different data about regions and bed capacity in each classified by region. The order in this table is random, there is no order by any indicator, and each region has a specific geographic and demographic diversity.
Morocco is bordering the Mediterranean Sea and the Atlantic Ocean each region in a vertical shape as shown in figure 4.
Each dot in the above figure shows the location of a region presented in the previous table with their id to simplify the graphical presentation of the clustering operations.
5.2. Clustering algorithms to determine construction regional pharmacies area
One of the major challenges is to determine the most appropriate place to install the central pharmacy to serve a region or a set of regions and ensure the connectivity between these latter. The cluster appears to be the remedy to similar issues in a larger area. We aim to find the location of CP by using a range of clustering algorithms as k-means, DBSCAN, and Weighted K-means. All clustering algorithms are implemented using Python with numpy to calculate distance and matplotlib to display results as shown in map figures. The simulation of the clustering algorithms is done in an Alienware 32Gb RAM and i7 CPU (the execution of the scripts was in CPU level and not the GPU).

Figure 4: Old Territorial Division Based On 16 Regions of Morocco.

Figure 5: Geographic result as clustering with k = 3 using k-means.
5.2.1. Clustering with K-means
K-means is an unsupervised algorithm for non-hierarchical clustering, making it possible to group in K distinct clusters the observations of the data set. Thus, similar data will be in the same cluster. Moreover, an observation can only be found in one cluster at a time (exclusivity of belonging). The same observation, therefore, cannot belong to two different clusters.
We present each center of the region characterized by latitude and longitude as points in the cluster. Figures 5 and 6 present the result of clustering with k-means with 3 and 4 clusters in map shape.
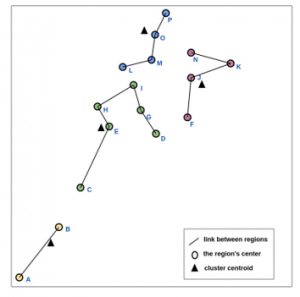
Figure 6: Geographic result as clustering with k = 4 using k-means.
The results of using k-means for 3 clusters show a favoring result for cluster 1 with a total of 15192 HBC and less than half for a cluster with 6195 HBC, for cluster 3 the HBC more minimal than the other clusters. Therefore, this method doesn’t present equality or equilibrium between clusters, it shows a considerable imbalance between all three clusters. We can also notice the same disproportion for clustering with 4 clusters with different variations of total in every 4 clusters
5.2.2. Clustering using DBSCAN
DBSCAN is less popular than the k-means algorithm, based on the concept of density: cluster is an area of space where the density of observations is important. At the output, the algorithm generates as many clusters as areas of the high-density space. Isolated points are considered noise. The DBSCAN algorithm uses 2 parameters: the distance and the minimum number of MinPts (minimum number of points required to form a dense region) points to be in a radius for these points to be considered as clusters. The input parameters are therefore an estimate of the density of points of the clusters. The basic idea of the algorithm is then, for a given point, to retrieve its radius-neighborhood and check that it contains MinPts points or more. This point is then considered part of a cluster. We then go through the radius-neighborhood closer to find all the points of the cluster. Using the same data presented for k-means (without giving the number of clusters), the result was as following (Figure.7):
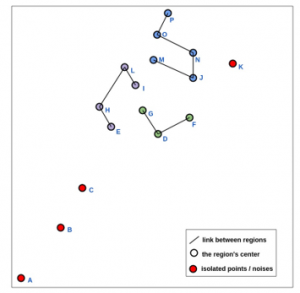
Figure 7: The result of clustering by using DBSCAN.
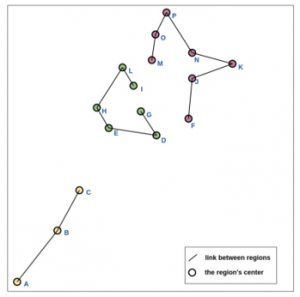
Figure 8: The result of weighted k-means for 3 clusters.
The result provided by this approach introduces the creation of 3 clusters where the density is outstanding. However, 4 regions are designed to be noise instead of points linked to a cluster, these are points that do not belong to any group/cluster. Noises or points that do not fit into any cluster are also significant at least in our case they present regions that need to be served, as they can represent a problem or rare event in data clustering, which we need to consider because it represents HBC in an isolated area, especially in epidemic cases, also this method cannot handle the number of clusters needed, the nature of DBSCAN consists on given number of clusters as a result which is not suitable in our case for decision making.
5.2.3. Clustering with weighted k-means
K-means algorithm groups data by assigning all points to the nearest clusters, and determining the cluster means. The algorithm repeats previous steps until points assemble. Weighted k-means automatically calculates the feature weights in a cluster, adopting the idea that features can have different degrees of relevance from other features. Figure 8 and 9 present the result of the current method for 3 and 4 clusters.

Figure 9: The result of weighted k-means fork = 4.
The result shows equilibrium between the two first clusters in the case of three clusters (first 11551, second 9836), and another equilibrium between the three first clusters in the case of four clusters (first 7623, second 5382, third 8704). Each cluster is unbiased in terms of HBC, south regions make an exception in this case because the points that represent the southern regions are far from the other points, which is tolerable since the integration of these regions with other regions will raise the costs of the transport.
Examination with k-means, DBSCAN, and weighted k-means shows progressively suitable results for weighted k-means. the method does not present an equilibrium between the clusters. However, clusters are unbiased, which the other clusters methods can’t afford.
6. Genetic Algorithm
The Genetic Algorithm is a stochastic optimization technique based on a parallel search mechanism which makes it more efficient than other classical optimization techniques such as branch and bound, Tabu search method and simulated annealing. The main idea of GA is to avoid getting trapped in local optimum by genetic operators, crossover, and mutation. GA maintains a population of possible random solutions representing chromosomes that can evolve through a generation. The chromosomes are evaluated for fitness in each generation. The best-fitting chromosomes have a high probability to be selected for genetic operations such as crossover and mutation for the creation of the next generation.
GA is the most widely class of heuristics methods used as an application to the MDVRP problem, that why GA has received great attention from many authors, In [24] the author present a comparative study of different types of GA’s applied to MDVRP, in [14] the author propose two solutions for the MDVRP. The first one is an implementation of the GA for solving the issues. The second one is a hybrid method with Clarke and Wright saving method and nearest neighbor, and he proved that the last method performs better than the first one.
Initial population: or the first chromosome is formed based on the routes, CP and hospitals according to the clustering method we use in the first section (grouping, routing, and scheduling). Consider an MDVRP instance with 5 hospitals and 0 represent CP. If the path representation for this instance is (0 2 4 1 0 3 5 0), then two routes are required by the vehicles to serve all the hospitals. The first route: departs from the CP at 0 and travels to hospitals (2 4 1) as soon as the vehicle has returned to the CP. Second route: leaves the CP 0, serves hospitals 3, 5, and returns to the CP.
Evaluation: evaluate each chromosome by measuring the fitness value, the main function in MDVRP is to optimize the delivery time and decrease spending cost in n CP. The operation starts in every CP simultaneously, that’s why it’s normal that some vehicles in the network can achieve the objective (finish the delivery to the set of hospitals) while others can achieve the same objective later. In our context we consider fitness score calculated based on a total of cost route of each vehicle ( in every CP ( . The cost formula will be mathematically presented as the following:
The cost for one vehicle of the CP is calculated as the following:
Selection: for each generation, the best chromosome (based on fitness value) is selected for the mating pool and reproduction for the next generation, to generate new individuals in the population approach used in [14] use roulette wheel selection operation, while others use tournament selection [23]. The selection strategy is based on fitness evaluation, chromosomes will be selected with generated probability measured by the fitness function, the fittest individual we are selected for the next step.
Genetic operation: the mutation and crossover used in GA as genetic operation, both mutation and crossover affect the selected chromosomes with genetic operations rate.
Crossover: consists on combine genetic information from two genomes to a new generation. In [25] the author developed a technique for crossover based on BCRC – Best Cost Route Crossover – oriented to the vehicle routing problem with time windows (VRPTW). The classical order crossover is used by [14] to perform crossover into MDVRP. The aim is to combine the genetic information of exactly two parents to create new information
Mutation: consists of swapping two distinct customers i and j randomly selected, there are many propositions of mutation methods, and we can group them into two classes, heuristic mutation and inversion mutation. The effect is to flip a chromosome substring to create an offspring, mutation works on only one chromosome. The creation of the initial population will be projected as a chromosome with hospitals and regional pharmacies, hospitals presented as numbers while , are CP.
| 1 | 2 | 3 | 4 | 5 | 6 | 7 | 8 | 9 | 10 |
Grouping: We used the weighted-k means to cluster regions into the hospital’s groups. Usually, in the same region, the geographical obstacle is not considerable. Also, the HBC for each hospital is not available. Therefore, in the grouping section, we use only Euclidean distance, however, if the space is large and can be affected by the shape of the globe, we can add haversine as distance instead of normal Euclidean one. The chromosome will be two sets of the group each group has its own pharmacy.
1, 2, 3, 4, 5. 6, 7, 8, 9, 10.
The figure below (Figure 10) presents a flowchart to describe the initialization of parameters and the iteration on GA algorithm:
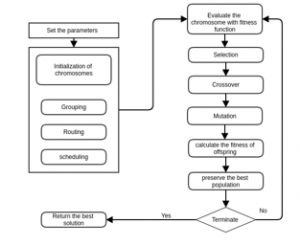
Figure 10: Flowchart of GA implementation.
7. Methods and Results
For the simulation, we used a list of hospitals by region from the Moroccan administration Open Data website, and we added demand for drugs to be served for the Casablanca region. Some of those health-care facilities use call for tender instead of begging to serve from CP based on category. For the purpose of this simulation, we consider all the facilities in table 2 are served by centralized pharmacies. Also, we consider three CP in the region only for the demonstration:
Table 2: The list of healthcare facilities in the grand Casablanca region.
| ID | HOSPITAL | COORDINATE | DRUGS UNIT |
| 1 | Sekkat (Salam) | 33.54631, -7.5884 | 30 |
| 2 | Centre de Léprologie | 33.55384, -7.59255 | 40 |
| 3 | Mohamed V | 33.58945, -7.55146 | 10 |
| 4 | Med Bouafi | 33.55874, -7.60972 | 15 |
| 5 | Ben M’sick | 33.55225, -7.5782 | 22 |
| 6 | IbnRochd | 33.58125, -7.61976 | 41 |
| 7 | My Youssef | 33.60274, -7.63226 | 13 |
| 8 | 20 Aout 1953 | 33.57474, -7.6199 | 8 |
| 9 | Hôpitald’enfants | 33.58088, -7.62111 | 21 |
| 10 | Al Hassani | 33.55849, -7.68736 | 26 |
| 11 | Tit Mellil | 33.54937, -7.48586 | 50 |
| 12 | My Abdellah | 33.69778, -7.38551 | 14 |
| 13 | SidiOthmane | 33.55804, -7.57312 | 7 |
| 14 | Prince My Hassan | 33.60457, -7.63394 | 13 |
| 15 | Al Mansour | 33.6078, -7.50362 | 30 |
Consider three CP with coordinate: CP1 {33.58212, -7.6594}, CP2 {33.57125, -7.5813}, CP3 {33.58200, -7.5289}
The capacity of each vehicle is 50 units, the population size is 10 chromosomes. In our demonstration we followed the standard GA for MDVRP mentioned by [23] after performing our clustering method mentioned above. The operation was simulated using C# as programming language on an Alienware aurora R2 CPU i7 and RAM 32 GB.
The grouping will give us three set CP1, CP2 and CP3:
CP1: [6-7-9-14-1-2-4] CP2: [5-8-10-11-13] CP3: [3-12-2015]
The bellow table (table 3) shows the simulation for weighted-k means by generations with their set of groups. The group here means the route that each vehicle needs to do to de starting from the source (CP in our case) which is presented as 0. Each 0 means a go back to CP to load drugs for the next route.
Table 3: Result of simulation for weighted-k means.
| Generation | Fitness | Group | Path |
| Initial Generation | 60000> | CP1 | 0-3-15-0-12-0 |
| CP2 | 0-1-13-0-11-0-10-5-0-8-2-0-4-0 | ||
| CP3 | 0-14-0-6-0-7-9-0 | ||
| Generation 1 | 55986 | CP1 | 0-3-15-0-12-0 |
| CP2 | 0-1-13-0-11-0-10-5-0-8-2-0-4-0 | ||
| CP3 | 0-6-0-14-7-9-0 | ||
| Generation 20 | 51848 | CP1 | 0-12-15-0-3-0 |
| CP2 | 0-8-10-0-1-0-11-0-4-5-13-0-2-0 | ||
| CP3 | 0-6-0-9-7-14-0 | ||
| Generation 100 | 49948 | CP1 | 0-12-15-0-3-0 |
| CP2 | 0-4-1-0-10-5-0-11-0-2-13-0-8-0 | ||
| CP3 | 0-14-7-9-0-6-0 |
Due to the mutation and crossover, each generation has its own fitness, a part of the above table presents an example of fitness by several generations (initial, 1, 20, 100). Figure 11 presents details of the evolution of fitness score by generation. The fitness is calculated based on several visits for the CP in each group, the figure also presents the comparison between k-means method used in [3] with the distance clustering and weighted k-means proposed in this paper. Both methods have the same initial data.
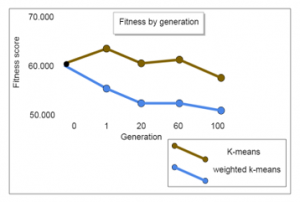
Figure 11: Fitness time for each generation.
Results show considerable regression in fitness score, which means acceptability of solution in newer generations in both clustering methods. Both methods have been improved over each generation, and the results shows that generation 100 is more fit in comparison with the others. However, the fitness score reached by weighted-k means is more acceptable than k-means.
The time simulation for each generation had shown a regression that can be presented in figure 12 as a chart for both methods. The time by minutes is calculated based on the distance crossed from each node of the set in each group with the visits of CP.

Figure 12. Consuming time for each generation.
In terms of time, the total consumption time from generation to generation is considerably changing in both methods. For the weighted k-means, the first generation shows better results in terms of time (less time-consuming means better results) in comparison with the initial random population (generation 0). At generation 40, the result is considered as the “better result”, before time rises again. However, results show better results at generation 80 to 100 which means an escape from local minima to new global minima due to the use of crossover and mutation in GA and that shows less time in comparison with the normal k-means method.
Thus the result shows a less distance traveling between nodes (figure 11) and a faster route for each group using the weighted k-means in comparison of k-means (figure 12). Note that k-means has been improved over generations but not more fit then weighted k-means, which can impact the traveled cost by distance, the figure 13 shows the comparison between our proposed GA and the GA proposed by [3].
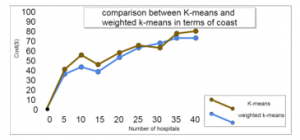
Figure 13: Comparison between K-means and weighted k-means in terms of cost.
The cost in weighted k-means is more efficient in comparison with traditional k-means, the figure 13 shows that the result using our proposed solution is competitive with k-means proposed by [3], however, the k-means solution can be more efficient if the hospitals’ area in large number, which in our case not realistic due to the nature of the problem that we are resolving, the hospitals cannot exceed a large number in comparison with the CP and population in a specific region.
8. Conclusion and Future Work
Health-care and hospitals suffer from drug delivery delay and distribution due to the lack of infrastructure and distributed central/regional pharmacies. Our contribution is the adoption of clustering methods to locate the appropriate placement to set new central/regional pharmacy and group hospitals to favorable pharmacy based on hospital bed capacity, and using an algorithm based on genetic algorithms to set routing and scheduling plans for drug distribution at the level of one region or a set of regions. The MDVRP besides clustering is rarely adopted in the resolution of similar matters. The most relevant algorithm to adopt is weighted k-means one that showed favorable results, at least in our case. Also, even if this solution appears to be specific to the health-care sector, this work can concern further fields like agriculture and food-processing.
As an additional feature/improvement to the current model, it can be helpful considering applying parallelization and prediction for the GA algorithm and taking into consideration the conditions of transportation and providing an access to the result beside the transportation process with transparency.
- J.W. Thomas, J.R. Griffith, P. Durance, “Defining hospital clusters and associated service communities in metropolitan areas,” Socio-Economic Planning Sciences, 15(2), 45–51, 1981, doi:10.1016/0038-0121(81)90048-3.
- S. Zhang, W. Zhang, Y. Gajpal, S. Appadoo, Ant Colony Algorithm for Routing Alternate Fuel Vehicles in Multi-depot Vehicle Routing Problem: Performance and Safety Management, 251–260, 2019, doi:10.1007/978-981-13-0860-4_19.
- N. Mahmud, M.M. Haque, “Solving Multiple Depot Vehicle Routing Problem (MDVRP) using Genetic Algorithm,” 2nd International Conference on Electrical, Computer and Communication Engineering, ECCE 2019, 1–6, 2019, doi:10.1109/ECACE.2019.8679429.
- K. Leungsubthawee, S. Saranwong, C. Likasiri, “Multiple depot vehicle routing problems on clustering algorithms,” Thai Journal of Mathematics, 2018(Special Issue AnnualMeetinginMathematics), 205–216, 2018.
- T. Phiboonbanakit, T. Horanont, T. Supnithi, V.-N. Huynh, “Knowledge-Based Learning for Solving Vehicle Routing Problem,” in Proceedings of the 2018 ACM International Joint Conference and 2018 International Symposium on Pervasive and Ubiquitous Computing and Wearable Computers, Association for Computing Machinery, New York, NY, USA: 1103–1111, 2018, doi:10.1145/3267305.3274166.
- J.R. Griffith, Quantitative techniques for hospital planning and control, Lexington, Mass., Lexington Books, Lexington, Mass., 1972.
- N. Albarakati, Z. Obradovic, “Disease-Based Clustering of Hospital Admission: Disease Network of Hospital Networks Approach,” in 2017 IEEE 30th International Symposium on Computer-Based Medical Systems (CBMS), 636–641, 2017, doi:10.1109/CBMS.2017.87.
- A.K. Jain, “Data clustering: 50 years beyond K-means,” Pattern Recognition Letters,31(8),651–666,2010, doi:https://doi.org/10.1016/j.patrec.2009.09.011.
- P. Delamater, A. Shortridge, J. Messina, “Regional health care planning: A methodology to cluster facilities using community utilization patterns,” BMC Health Services Research, 13, 333, 2013, doi:10.1186/1472-6963-13-333.
- M.R. Lavergne, “Identifying Distinct Geographic Health Service Environments in British Columbia, Canada: Cluster Analysis of Population-Based Administrative Data TT – Identifier les différents environnements de services de santé en Colombie-Britannique, au Canada: analyse typologique des données administratives en fonction de la population,” Healthcare Policy = Politiques de Sante, 12(1), 43–51, 2016.
- X. Chen, W. Yin, P. Tu, H. Zhang, “Weighted k-Means Algorithm Based Text Clustering,” in 2009 International Symposium on Information Engineering and Electronic Commerce, 51–55, 2009, doi:10.1109/IEEC.2009.17.
- D. Serrou, A. Abouabdellah, An organizational strategy in order to optimize costs of medications return, 2016, doi:10.1109/GOL.2016.7731677.
- R.T. Sumichras, I.S. Markham, “A heuristic and lower bound for a multi-depot routing problem,” Computers & Operations Research, 22(10), 1047–1056, 1995, doi:https://doi.org/10.1016/0305-0548(94)00083-K.
- W. Ho, G.T.S. Ho, P. Ji, H.C.W. Lau, “A hybrid genetic algorithm for the multi-depot vehicle routing problem,” Engineering Applications of Artificial Intelligence, 21(4), 548–557, 2008, doi:https://doi.org/10.1016/j.engappai.2007.06.001.
- G. LAPORTE, Y. NOBERT, S. TAILLEFER, “Solving a Family of Multi-Depot Vehicle Routing and Location-Routing Problems,” Transportation Science, 22(3), 161–172, 1988.
- J.K. Lenstra, A.H.G.R. Kan, Some Simple Applications of the Travelling Salesman Problem, Operational Research Quarterly (1970-1977), 26(4), 717, 1975, doi:10.2307/3008306.
- B. Crevier, J.-F. Cordeau, G. Laporte, “The multi-depot vehicle routing problem with inter-depot routes,” European Journal of Operational Research, 176(2), 756–773, 2007.
- N. Aras, D. Aksen, M. Tuğrul Tekin, “Selective multi-depot vehicle routing problem with pricing,” Transportation Research Part C: Emerging Technologies,19(5),866–884,2011, doi:https://doi.org/10.1016/j.trc.2010.08.003.
- D.J. Gulczynski, “Integer Programming-Based Heuristics for Vehicle Routing Problems,” 2010.
- A. Santoso, D.N. Prayogo, D.Y. Nugroho, “Model Fuzzy Multiobjective Vehicle Routing Problem untuk Produk Perishable dengan Pendekatan Algoritma Genetika,” in Seminar Nasional Teknik Industri BKSTI 2014, IV–99, 2014.
- M. Santé Maroc/DPRF/DPE/S.E.I.S., “Santé en Chiffres 2015/ Edition 2016,” 168, 2016.
- R. Hofman, “Why Linear Programming cannot solve large instances of NP-complete problems in polynomial time,” 2006.
- S. Paneerselvam, S. Sai, “Solution to multi-depot vehicle routing problem using genetic algorithms,” World Applied Programming, 1, 118–131, 2011.
- S. Karakatič, V. Podgorelec, “A survey of genetic algorithms for solving multi depot vehicle routing problem,” Applied Soft Computing, 27, 519–532, 2015, doi:https://doi.org/10.1016/j.asoc.2014.11.005.
- B. Ombuki-Berman, A. Runka, F. Hanshar, Waste collection vehicle routing problem with time windows using multi-objective genetic algorithms, 2007.