Experimental Analysis of Thin Layer Drying of Ginger Rhizome in Convective Environment
Experimental Analysis of Thin Layer Drying of Ginger Rhizome in Convective Environment
Volume 5, Issue 6, Page No 1132-1142, 2020
Author’s Name: Gbasouzor Austin Ikechukwu1,a), Sabuj Mallik2, Jude Ejikeme Ebem Njoku3, Joshua Depiver2
View Affiliations
1Department of Mechanical Engineering, Chukwuemeka Odumegwu Ojukwu University, P. M. B. 02 Uli.Anambra State, 234, Nigeria
2Mechanical and Manufacturing Engineering and Built Environment, School of Engineering University of Derby/Britannia Markeaton Street Derby, DE22 3AW, UK
3Faculty of Engineering and Science, Department of Engineering and Science, University of Greenwich Medway Campus, Central Avenue Chatham Maritime Kent ME4 4TB, UK
a)Author to whom correspondence should be addressed. E-mail: unconditionaldivineventure@yahoo.com
Adv. Sci. Technol. Eng. Syst. J. 5(6), 1132-1142 (2020); ![]() DOI: 10.25046/aj0506137
DOI: 10.25046/aj0506137
Keywords: Blanched, Moisture content, Peeled, Thermal conductivity, Unblanched, Unpeeled

Export Citations
This research presents the outcomes of thin layer convective drying of ginger rhizomes with different treatments using the ARS-0680 environmental chambers for the drying process. TD 1002A – Linear Heat Conduction Experimental equipment was used in measuring the thermal conductivity of the ginger samples at varied temperature levels ranging from 10oC – 60oC and drying time of 2 – 24 hours. The result of this experiment shows that the average moisture content for 2 hours drying at 60oC was 70.6% while at 24 hours drying was an average of 7.55% which is close to the range of 4 – 7%. The drying rate at drying times of 24 hours was 0.889/oC and 0.4437/oC for 2 hours drying, giving 50% by moisture reduction rate. While the lowest moisture content (5.98%) is obtained for unpeeled ginger and the highest (9.04%) at 24 hours drying at 60oC, the analysis shows the variation in the temperature varied as the ginger shrinks when subjected to heat.
Received: 17 July 2020, Accepted: 13 November 2020, Published Online: 14 December 2020
1. Introduction
Thin layer drying can be utilized in removing volatile liquid from porous materials such as foodstuffs, ceramic products, wood, and so on. Porous materials have microscopic capillaries and pores which allow for the simultaneous transfer of both moisture and air when subjected to heating or cooling. The drying of moist porous solids involves concurrent exchange of heat and mass. Moisture is eliminated simply by evaporation into an unsaturated gaseous phase. Drying is fundamentally essential for the preservation of crops for prospect usage. Crops are usually conserved by removing sufficient moisture from them to evade decay and deterioration. Reducing the moisture content of ginger rhizome to a very low level will discourage the growth and multiplication of microorganism which could decompose the rhizome. Nevertheless, the drying process could cause the enzymes present in ginger rhizomes to be destroyed.
Thin-layer drying studies provide the basis for understanding the unique drying characteristics of any particular food material. The results of such studies have been extensively employed in the simulation of dryers under deep-bed drying conditions and for quantifying parameters for the design of specialized drying equipment. In thin-layer drying, the moisture content of a bio-material exposed to a stream of drying air of known relative humidity, velocity, and the temperature is observed over a while. Several mathematical models have been developed to simulate moisture movement and mass transfer during the drying of many agricultural products [1]. The porous material that will be used for this study is ginger. The physicothermal properties of ginger will be obtained and used in the resulting mathematical equations.
Ginger rhizomes are popular in most countries throughout the world [2]. Ginger rhizomes are edible spices of tropical origin, though it can thrive in humid regions. It is harvested in different seasons depending on the region. In Nigeria, the harvesting period is usually in July, while in areas like Hawaii and the USA harvesting season is in December. Gingers grows up to 125cm high under conducive environments and it is an annual crop [3, 4].
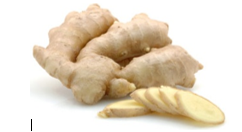
Figure 1: Raw materials for the experiments (Ginger Rhizomes) [1]
It is grown for its pungently aromatic underground stem or rhizome which is an important export crop valued for its powder, oil, and oleoresin, all of which have both food and medicinal value [5].
Ginger is an herbaceous perennial plant known as Zingiberofficinale, which belongs to the order scitamineae and the family zingriberaceae
Nigeria is presently the fifth top producer of ginger in the world and one of the principal exporters of ginger [6] The most important form in which ginger enters international trade is as a dried product; next in importance is as preserved product, and least important is as fresh product [7].
The quality of fresh ginger produced in Nigeria is the best in the world. However, it has been observed that the quality of its dried ginger has been declining due to the low level of mechanization of ginger production and processing [8]; with the attendant mold growth and loss of some important ginger qualities because of which Nigerian ginger attracts the cheapest price in the world market [9].
The aforementioned issues formed the basis for this work. Attention will be directed towards the use of a thin-layer drying process to determine the drying characteristics of thin layered ginger in a convective environment.
The drying of the porous material was conducted experimentally under free and forced convection environmental conditions. Ginger rhizomes used were peeled, unpeeled, split, and then cut into slices before drying at elevated temperatures in the environmental chamber [10]. The heat and mass transfers were studied using available correlations of boundary layer equations.
The economy of Nigeria had since the mid-1960s of oil boom deviated from agriculture to petroleum. This has placed undue pressure on the oil reserves in the volatile Niger Delta region and agriculture and its produce have been neglected. Therefore, any adverse influence on oil both locally and internationally affects the economy of Nigeria drastically. The present administration of President Muhammad Buhari has promised Nigerians better days, change in all sectors, and improved agricultural outputs. Nigeria needs to process its agriculture produce to derive the desired benefits available in the international markets. This research seeks to find solutions to the prevailing low quality of dried ginger in Nigeria.
Most researches done on ginger rhizomes were focused on the effects of cutting, solar-drying, and particle size of Ginger (Zingiber officinale Roscoe) pigment and powder [11]; configuration of volatile oil [9]; biochemical variations in ginger during storage [12]; and advances of ginger processing technologies [8, 13, 14, 15-17]. The goal of this work is to analyze experimentally the drying characteristics of thin layered ginger rhizome in a convective environment.
This study on the thin layer drying characteristics of ginger rhizomes produced in Nigeria will be experimental and analytical. It will not delve into production methods, harvesting techniques, and marketing strategies. For this study; four different treatments were carried out on the ginger. They are blanched, unblanched, peeled, and unpeeled treatments [18].
The ginger rhizomes obtained for the study required minimum duration of six to eight months of planting and will be dried to 7 – 15% moisture content. The ginger samples used in this study were obtained from one region. It is assumed that most ginger produced in Nigeria have similar quality and characteristics.
2. Materials and Method
The ginger samples utilized in this study were supplied from Kachia in Southern Kaduna in the Kaduna State of Nigeria and were preserved at room temperature before being used for the experimentations. The experiments were carried out at the Electronic Manufacturing Engineering Laboratory (ERMERG) Hawkes building, University of Greenwich, Maritime Kent, UK.
Variously treated ginger samples (peeled, blanched, unpeeled and unblanched) were used in the experiments. The variously treated ginger samples were cut into slices of 30mm diameter and 18mm thickness by scoopers designed for this purpose. ARS – 0680 Temperature and Humidity Chamber were used to dry the samples. The chamber houses the samples and temperature is controlled by an electric heater. The ginger drying experiment was conducted according to ASAE Standard S352.2. Before the commencement of the experiment, the whole apparatus was operated for at least 15-30 minutes to stabilize the humidity, air temperature, and velocity in the dryer.
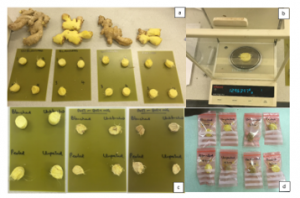
Figure 2: Schematic representation of ginger samples (a) Samples of fresh ginger (b) Sample in the electronic balances (c) Samples after drying; and (d) Bagged ginger samples after drying.
Drying started by 08:00 hours and lasted till the specimen attended the final moisture content. The weight loss of the sample in the environmental chamber was recorded during the drying period of 2 and 24 hours with an electronic balance (EK-200g, Max 200 0.01g) see figure 2c. At the end of drying, the thermal conductivity of the dried sample was measured with the aid of linear heat conduction equipment, TD1002A – Linear Heat Conduction Experiment Unit (LHTEU) [19].
3. Mathematical Modeling and Theoretical Principle
3.1. Determination of the most suitable model for drying
Thin-layer drying always requires a good understanding of the regression and correlation analysis. Linear and non-linear regression analysis are used to ascertain the relationship between variables MR and t in thin layer drying for selected drying models. The recommended models chosen for applications were further validated using correlation analysis, standard error of estimate and root means square error (RMSE) analysis respectively. The major indicator for selecting the best models is the determination coefficient (R2). The highest determination coefficient and lowest standard error of estimate and RMSE values are used to determine the goodness of fit [20, 21, 22]. The determination coefficient (R2); standard error of estimate and root mean square error (RMSE) calculations can be performed using the following equations [23]:
where is the number of observations, predicted moisture ratio values, experimental moisture ratio values, and df is the number of degree of freedom of the regression model.
3.2. Moisture Content (%) Calculation Formula
The moisture content of the materials can be calculated by using two methods: wet or dry basis
- The wet basis is calculated as follows:
where
The dry basis is calculated as follows:
Moisture content, dry basis is the amount of water per unit mass of dry solids (bone dry) existing in the sample
Where
Note that the two moisture contents are related by the following equation:
3.3. Determination of the effective diffusivity and activation energy
The effective diffusivity of agricultural products can be determined using Fick’s Second law for slab geometry [17, 18]. The common geometries were considered during the analytical solution of Fick’s Second law for the infinite slab is expressed as:
where is a positive integer, is the half-thickness of samples (m), Deff is the effective moisture diffusivity (m2/s), t is time (s), MR is the fractional moisture ratio.
Eq (7) can be modified in a logarithmic form as:
The effective moisture diffusivity can be obtained by plotting against drying time; this gives a straight line with a slope (K) expressed as:
The relationship between the effective diffusivity on temperature is described by the Arrhenius equation as [17-19]:
Eq. (10) can be expressed in the logarithmic form as:
where is the pre-exponential factor of Arrhenius equation ; is the activation energy in ; is the universal gas constant , and is absolute air temperature (K).
From equation (11), plotting of against (T)-1 would lead to the evaluation of activation energy for the diffusion of moisture during drying and isobtainedas: , where (–Ea/R) is the slope of equation (18).
The average drying rate of the ginger in terms of initial and final moisture content could be evaluated using following equation [24].
where dm/dt the average drying rate (kg/kg), t is the time (min), Mo is the initial moisture content ant and Mt is final moisture content [24].
The air velocity and temperature effect on the drying rate could be determined using appropriate statistical method. The overall drying rate of the ginger could be evaluated considering the total drying time as:
The evaluation of moisture content considering the dry basis could yield values more than 100% because the excessive moisture that could be present in some ginger rhizomes. The dry basis might be used to approximate the percentage moisture content as the moisture-free material. However, the wet basis moisture content is usually recommended for usage [25].
4. Results and Discussion
Tables 1 – 13 show the experimental results obtained during the whole experiment. This study considered two important features of thin-layer drying of ginger rhizomes:
- moisture content characteristics
- thermal conductivity of each sample at varying drying time and temperature with the aid of linear heat conduction’s experimental unit in a convective chamber [26].
Table 1 shows the results obtained for moisture ratios and thermal conductivities of the variously treated ginger at a drying temperature of 10°C. The moisture ratios of the variously treated ginger samples decrease as the drying time increases. This implies that moisture is eliminated from the samples over time. Blanched treated samples recorded the least moisture ratio of 41.13. Also, the thermal conductivities for the various treatments decrease with the drying time. As expected, a decrease in moisture will not encourage faster moisture reduction.
Tables 2-6 present the results obtained for moisture ratios and thermal conductivities of the variously treated ginger at drying temperatures of 20°C, 30°C, 40°C, 50°C, and 60°C respectively. Both moisture ratios and thermal conductivities decrease with drying time. The least values were recorded at a drying time of 24 hours. The results of the variation of moisture ratios with drying time were plotted in figures 3 to 8 for various drying chamber temperatures,
The drying behavior of variously treated ginger rhizomes were studied using experimental drying curves. Drying curves for drying period of 2 –24hours at drying temperatures of 10°C to 60°C with step of 10 were considered. The results were employed to investigate the thermal conductivity content for the various treatments. The effect of moisture ratio on thermal conductivity with time was examined
4.1. Experimental Results at Temperatures 10°C
Table 1 shows the results obtained for moisture ratios and thermal conductivity of the variously treated ginger samples at a drying temperature of 10°C
Table 1: Moisture ratio (%) and thermal conductivity (W/m.K) at drying temperature of 10°C
| Unblanched | Peeled | ||||||
|
Sample S/Nos. |
Time (Hour) |
Moisture Ratio (%) |
Thermal Conductivity |
Sample S/Nos. |
Time (Hour) |
Moisture Ratio (%) |
Thermal Conductivity |
| 1 | 2 | 88.64 | 0.4064 | 1 | 2 | 88.74 | 0.3768 |
| 2 | 4 | 84.75 | 0.3188 | 2 | 4 | 82.95 | 0.3004 |
| 3 | 8 | 78.28 | 0.2657 | 3 | 8 | 77.29 | 0.2623 |
| 4 | 10 | 73.67 | 0.2303 | 4 | 10 | 63.58 | 0.2115 |
| 5 | 14 | 65.22 | 0.1834 | 5 | 14 | 60.65 | 0.1919 |
| 6 | 16 | 51.1 | 0.1727 | 6 | 16 | 57.47 | 0.1658 |
| 7 | 24 | 49.55 | 0.1607 | 7 | 24 | 55.91 | 0.1449 |
| Blanched | Unpeeled | ||||||
|
Sample S/Nos. |
Time (Hour) |
Moisture Ratio (%) |
Thermal Conductivity |
Sample S/Nos. |
Time (Hour) |
Moisture Ratio (%) |
Thermal Conductivity |
| 1 | 2 | 84.58 | 0.3290 | 1 | 2 | 91.08 | 0.3397 |
| 2 | 4 | 78.58 | 0.2878 | 2 | 4 | 83.91 | 0.3093 |
| 3 | 8 | 63.21 | 0.1993 | 3 | 8 | 82.07 | 0.2657 |
| 4 | 10 | 62.45 | 0.1901 | 4 | 10 | 73.41 | 0.2329 |
| 5 | 14 | 53.42 | 0.1699 | 5 | 14 | 68.77 | 0.2205 |
| 6 | 16 | 47.02 | 0.1558 | 6 | 16 | 64.68 | 0.2093 |
| 7 | 24 | 41.13 | 0.1400 | 7 | 24 | 62.22 | 0.1713 |
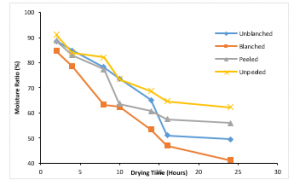
Figure 3: Variation of Moisture Ratio with Drying Time at 100C
Figure 3 shows the variation of moisture ratio with drying time at a temperature of 10°C for variously treated ginger samples. The unblanched ginger sample had a moisture ratio of about 88.64% before drying commenced, it lost moisture smoothly until 14hours where the moisture ratio reduced to 65.22%. It then drops abruptly to 51.1% within two hours and continued smoothly till 24hours. The blanched ginger sample had an initial moisture ratio of 84.58%; it lost moisture gradually till the end of the drying process with a final moisture ratio of 41.13%. It lost about 43.45% of moisture within twenty-four hours. Peeled and unpeeled treated samples lost 32.87% and 28.86% of moisture respectively within the twenty-four hours of drying. From figure 3, it could be deduced that the blanched ginger sample lost the highest amount of moisture with time while the unpeeled lost the least amount of moisture within the drying duration. Generally, the moisture ratio decreases with time for the variously treated ginger samples.
4.2. Experimental Results at Temperature of 20°C
Table 2 shows the results obtained for moisture ratios and thermal conductivity of the variously treated ginger samples at a drying temperature of 20°C
Table 2: Moisture ratio (%) and thermal conductivity (W/mK) at the drying temperature of 20°C
| Unblanched | Peeled | ||||||
|
Sample S/Nos. |
Time (Hour) |
Initial Moisture Ratio (%) |
Thermal Conductivity |
Sample S/Nos. |
Time (Hour) |
Initial Moisture Ratio (%) |
Thermal Conductivity |
| 1 | 2 | 86.35 | 0.4064 | 1 | 2 | 87.85 | 0.3768 |
| 2 | 4 | 77.07 | 0.3188 | 2 | 4 | 77.18 | 0.3238 |
| 3 | 8 | 71.67 | 0.2382 | 3 | 8 | 72.83 | 0.2839 |
| 4 | 10 | 70.92 | 0.1974 | 4 | 10 | 66.39 | 0.2115 |
| 5 | 14 | 55.60 | 0.1901 | 5 | 14 | 50.00 | 0.1818 |
| 6 | 16 | 49.87 | 0.1658 | 6 | 16 | 47.71 | 0.1594 |
| 7 | 24 | 47.81 | 0.1491 | 7 | 24 | 37.49 | 0.1391 |
| Blanched | Unpeeled | ||||||
|
Sample S/Nos. |
Time (Hour) |
Initial Moisture Ratio (%) |
Thermal Conductivity |
Sample S/Nos. |
Time (Hour) |
Initial Moisture Ratio (%) |
Thermal Conductivity |
| 1 | 2 | 86.29 | 0.2919 | 1 | 2 | 86.17 | 0.3454 |
| 2 | 4 | 77.81 | 0.2527 | 2 | 4 | 81.82 | 0.3343 |
| 3 | 8 | 67.75 | 0.2228 | 3 | 8 | 76.63 | 0.2839 |
| 4 | 10 | 65.19 | 0.1742 | 4 | 10 | 64.34 | 0.2329 |
| 5 | 14 | 43.29 | 0.1570 | 5 | 14 | 60.97 | 0.2205 |
| 6 | 16 | 38.58 | 0.1449 | 6 | 16 | 53.16 | 0.1802 |
| 7 | 24 | 34.26 | 0.1312 | 7 | 24 | 48.36 | 0.1713 |
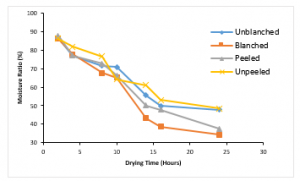
Figure 4: Variation of Moisture Ratio with Drying Time at 200C
Figure 4 presents the variation of the moisture ratio of the variously treated ginger sample with drying time at a temperature of 20°C. All the samples had almost the same initial moisture ratio of about 86%. The unblanched treated ginger sample lost about 38.54% of moisture, the blanched treated sample lost about 52.03%, the peeled treated sample lost about 50.36% and the unpeeled treated sample lost about 37.81%. As previously observed at drying temperature at 10°C, also at a drying temperature of 20°C blanched treated ginger sample lost the highest amount of moisture and the unpeeled treated ginger sample lost the least amount of moisture.
4.3. Experimental Results at Temperature of 30°C
Table 3 presented the results gotten for moisture ratios and thermal conductivity of variously treated ginger samples at a drying temperature of 30oC
Table 3: Moisture ratio (%) and thermal conductivity (W/mK) at the drying temperature of
| Unblanched | Peeled | ||||||
|
Sample S/Nos. |
Time (Hour) |
Initial Moisture Ratio (%) |
Thermal Conductivity |
Sample S/Nos. |
Time (Hour) |
Initial Moisture Ratio (%) |
Thermal Conductivity |
| 1 | 2 | 87.34 | 0.1074 | 1 | 2 | 87.95 | 0.1459 |
| 2 | 4 | 80.81 | 0.0996 | 2 | 4 | 80.12 | 0.1132 |
| 3 | 8 | 76.18 | 0.0987 | 3 | 8 | 74.83 | 0.0909 |
| 4 | 10 | 72.15 | 0.0955 | 4 | 10 | 66.33 | 0.0776 |
| 5 | 14 | 47.60 | 0.0809 | 5 | 14 | 45.73 | 0.0715 |
| 6 | 16 | 45.05 | 0.0785 | 6 | 16 | 38.35 | 0.0693 |
| 7 | 24 | 39.55 | 0.0677 | 7 | 24 | 27.76 | 0.0652 |
| Blanched | Unpeeled | ||||||
|
Sample S/Nos. |
Time (Hour) |
Initial Moisture Ratio (%) |
Thermal Conductivity |
Sample S/Nos. |
Time (Hour) |
Initial Moisture Ratio (%) |
Thermal Conductivity |
| 1 | 2 | 86.65 | 0.1006 | 1 | 2 | 87.71 | 0.1126 |
| 2 | 4 | 78.52 | 0.0913 | 2 | 4 | 81.89 | 0.1021 |
| 3 | 8 | 65.23 | 0.0810 | 3 | 8 | 74.17 | 0.0810 |
| 4 | 10 | 62.35 | 0.0800 | 4 | 10 | 68.97 | 0.0740 |
| 5 | 14 | 30.50 | 0.0761 | 5 | 14 | 48.42 | 0.0658 |
| 6 | 16 | 24.49 | 0.0732 | 6 | 16 | 43.42 | 0.0630 |
| 7 | 24 | 17.48 | 0.0689 | 7 | 24 | 31.15 | 0.0611 |

Figure 5: Variation of Moisture Ratio with Drying Time at 300C
Figure 5 presents the variation of the moisture ratio of the variously treated ginger sample with drying time at a temperature of 30°C. All the samples had almost the same initial moisture ratio of about 87%. The unblanched treated ginger sample lost about 47.79% of moisture, the blanched treated sample lost about 69.17%, the peeled treated sample lost about 60.16% and the unpeeled treated sample lost about 56.56%. The blanched treated ginger sample has the highest amount of loss while the unblanched treated ginger sample has the least amount of loss.
4.4. Experimental Results at Temperature of
Table 4 shows the results obtained for moisture ratios and thermal conductivity of the variously treated ginger samples at a drying temperature of 40oC
Table 4: Moisture ratio (%) and thermal conductivity (W/m. K) at a drying temperature of 40°C
| Unblanched | Peeled | ||||||
|
Sample S/Nos. |
Time (Hour) |
Initial Moisture Ratio (%) |
Thermal Conductivity |
Sample S/Nos. |
Time (Hour) |
Initial Moisture Ratio (%) |
Thermal Conductivity |
| 1 | 2 | 79.32 | 0.0756 | 1 | 2 | 75.93 | 0.0717 |
| 2 | 4 | 67.33 | 0.0691 | 2 | 4 | 60.47 | 0.0710 |
| 3 | 8 | 54.64 | 0.0660 | 3 | 8 | 49.39 | 0.0662 |
| 4 | 10 | 44.36 | 0.0638 | 4 | 10 | 47.08 | 0.0624 |
| 5 | 14 | 41.33 | 0.0608 | 5 | 14 | 30.59 | 0.0590 |
| 6 | 16 | 37.03 | 0.0581 | 6 | 16 | 27.01 | 0.0548 |
| 7 | 24 | 30.12 | 0.0557 | 7 | 24 | 23.92 | 0.0516 |
| Blanched | Unpeeled | ||||||
|
Sample S/Nos. |
Time (Hour) |
Initial Moisture Ratio (%) |
Thermal Conductivity |
Sample S/Nos. |
Time (Hour) |
Initial Moisture Ratio (%) |
Thermal Conductivity |
| 1 | 2 | 70.11 | 0.0707 | 1 | 2 | 81.46 | 0.0717 |
| 2 | 4 | 54.37 | 0.0662 | 2 | 4 | 70.55 | 0.0658 |
| 3 | 8 | 40.6 | 0.0648 | 3 | 8 | 57.36 | 0.0611 |
| 4 | 10 | 27.84 | 0.0636 | 4 | 10 | 38.15 | 0.0572 |
| 5 | 14 | 23.65 | 0.0606 | 5 | 14 | 35.26 | 0.0560 |
| 6 | 16 | 18.83 | 0.0574 | 6 | 16 | 32.5 | 0.0557 |
| 7 | 24 | 17 | 0.0562 | 7 | 24 | 26.3 | 0.0543 |

Figure 6: Variation of Moisture Ratio with Drying Time at 400C
Figure 6 presents the variation of the moisture ratio of the variously treated ginger sample with drying time at a temperature of 40°C. The unblanched treated ginger sample lost about 49.20% of moisture, the blanched treated sample lost about 53.11%, the peeled treated sample lost about 52.01% and the unpeeled treated sample lost about 55.16%. It can be observed that the unpeeled treated ginger sample experienced the highest moisture loss, but the blanched treated ginger sample attended the lowest moisture ratio of 17%.
4.5. Experimental Results at Temperature of
Table 5 shows the results obtained for moisture ratios and thermal conductivity of the variously treated ginger samples at a drying temperature of 50oC
Table 5: Moisture ratio (%) and thermal conductivity (W/M. K) at a drying temperature of 50°C
| Unblanched | Peeled | ||||||
|
Sample S/Nos. |
Time (Hour) |
Initial Moisture Ratio (%) |
Thermal Conductivity |
Sample S/Nos. |
Time (Hour) |
Initial Moisture Ratio (%) |
Thermal Conductivity |
| 1 | 2 | 71.65 | 0.0715 | 1 | 2 | 65.5 | 0.0759 |
| 2 | 4 | 58.38 | 0.0698 | 2 | 4 | 58.91 | 0.0695 |
| 3 | 8 | 42.51 | 0.0675 | 3 | 8 | 39.79 | 0.0634 |
| 4 | 10 | 37.55 | 0.0652 | 4 | 10 | 27.99 | 0.0571 |
| 5 | 14 | 28.44 | 0.0582 | 5 | 14 | 18.68 | 0.0555 |
| 6 | 16 | 25.53 | 0.0563 | 6 | 16 | 16.5 | 0.0543 |
| 7 | 24 | 17.95 | 0.0541 | 7 | 24 | 13.21 | 0.0519 |
| Blanched | Unpeeled | ||||||
|
Sample S/Nos. |
Time (Hour) |
Initial Moisture Ratio (%) |
Thermal Conductivity |
Sample S/Nos. |
Time (Hour) |
Initial Moisture Ratio (%) |
Thermal Conductivity |
| 1 | 2 | 66.64 | 0.0730 | 1 | 2 | 67.85 | 0.0776 |
| 2 | 4 | 51.57 | 0.0650 | 2 | 4 | 57.92 | 0.0710 |
| 3 | 8 | 44.89 | 0.0626 | 3 | 8 | 41 | 0.0622 |
| 4 | 10 | 31.78 | 0.0610 | 4 | 10 | 39.92 | 0.0596 |
| 5 | 14 | 14.42 | 0.0584 | 5 | 14 | 32.2 | 0.0540 |
| 6 | 16 | 12.79 | 0.0581 | 6 | 16 | 23.71 | 0.0465 |
| 7 | 24 | 10.25 | 0.0556 | 7 | 24 | 15.49 | 0.0460 |
Figure 7 presents the variation of the moisture ratio of the variously treated ginger sample with drying time at a temperature of 50°C. The unblanched treated ginger sample lost about 53.70% of moisture, the blanched treated sample lost about 56.39%, the peeled treated sample lost about 52.29% and the unpeeled treated sample lost about 52.36%. It can be observed that the blanched treated ginger sample experienced the highest moisture loss and also attended the lowest moisture ratio of 10.25%.
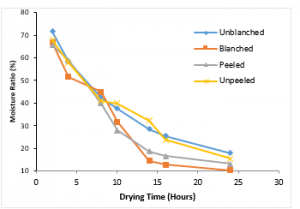
Figure 7: Variation of Moisture Ratio with Drying Time at 500C
4.6. Experimental Results at Temperature of
Table 6 shows the results obtained for moisture ratios and thermal conductivity of the variously treated ginger samples at a drying temperature of 60oC
Table 6: Moisture ratio (%) and thermal conductivity (W/mK) at the drying temperature of 60°C
| Unblanched | Peeled | ||||||
|
Sample S/Nos. |
Time (Hour) |
Initial Moisture Ratio (%) |
Thermal Conductivity |
Sample S/Nos. |
Time (Hour) |
Initial Moisture Ratio (%) |
Thermal Conductivity |
| 1 | 2 | 74.16 | 0.0762 | 1 | 2 | 70.75 | 0.0791 |
| 2 | 4 | 52.92 | 0.0720 | 2 | 4 | 46.68 | 0.0727 |
| 3 | 8 | 42.16 | 0.0695 | 3 | 8 | 29.89 | 0.0664 |
| 4 | 10 | 33.33 | 0.0691 | 4 | 10 | 24.17 | 0.0611 |
| 5 | 14 | 16.49 | 0.0652 | 5 | 14 | 13.82 | 0.0557 |
| 6 | 16 | 14.88 | 0.0644 | 6 | 16 | 11.54 | 0.0534 |
| 7 | 24 | 6.63 | 0.0553 | 7 | 24 | 8.56 | 0.0483 |
| Blanched | Unpeeled | ||||||
|
Sample S/Nos. |
Time (Hour) |
Initial Moisture Ratio (%) |
Thermal Conductivity |
Sample S/Nos. |
Time (Hour) |
Initial Moisture Ratio (%) |
Thermal Conductivity |
| 1 | 2 | 63.11 | 0.0836 | 1 | 2 | 74.36 | 0.0776 |
| 2 | 4 | 47.27 | 0.0762 | 2 | 4 | 59.27 | 0.0689 |
| 3 | 8 | 26.49 | 0.0732 | 3 | 8 | 46.56 | 0.0622 |
| 4 | 10 | 17.71 | 0.0576 | 4 | 10 | 31.13 | 0.0596 |
| 5 | 14 | 14.15 | 0.0566 | 5 | 14 | 24.49 | 0.0540 |
| 6 | 16 | 10.32 | 0.0536 | 6 | 16 | 13.69 | 0.0465 |
| 7 | 24 | 9.04 | 0.0516 | 7 | 24 | 5.98 | 0.0460 |
Figure 8 presents the variation of the moisture ratio of the variously treated ginger sample with drying time at a temperature of 60°C. The unblanched treated ginger sample lost about 67.53% of moisture, the blanched treated sample lost about 54.07%, the peeled treated sample lost about 62.19% and the unpeeled treated sample lost about 68.38%. It could be observed that the unpeeled treated ginger sample experienced the highest moisture loss.
The respective ginger rhizome samples were dried at temperatures of 10°C to 60°C, at step of 10. Figures 3-8 present the drying curve behavior of the variously treated ginger rhizomes at drying time of 2 – 24 hours and the effect of temperature on the different treatments. It could be observed that as the drying time increases, the moisture ratio decreases. Nevertheless, caution must be exercised to avoid excessive heating resulting from high temperature. Drying of ginger at excessive temperature could result in severe quality loss and shrinkages. Drying at above 60°C could result to quality loss and minor discoloration of the samples.
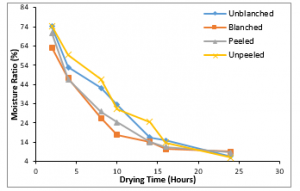
Figure 8: Variation of Moisture Ratio with Drying Time at 600C
The thermal conductivity decreases with the moisture ratio as the drying time progresses as shown in Tables 1-6. In Figures 3-8 the moisture ratio of the blanched ginger samples decreased the most when compared to other ginger samples while the unpeeled decreased the least. This could be as a result of the morphology of the ginger samples.
4.7. Drying Rate of Ginger Rhizome
Equation 12 shows that the average drying rate for ginger samples could deduct from Figures 3-8. The drying rate is the gradient of the graph of moisture ratio versus drying time. The values of the rate of drying for the various samples at different temperatures level were presented in Table 7; also, the averages for the various treatments of the samples were presented in Table 7. The negative value for the drying rate is a result of a loss of mass as the water content of the ginger escapes during drying. The blanched samples recorded the highest average drying rate indicating that it dries faster than the other samples, while the unblanched samples recorded the least average drying rate.
Table 7: Average Drying Rate for Variously Treated Ginger Samples
| Samples | dM/dt | ||||||
| 10⁰C | 20⁰C | 30⁰C | 40⁰C | 50⁰C | 60⁰C | Average | |
| Unblanched | -1.967 | -1.839 | -2.433 | -2.177 | -2.37 | -2.98 | -2.2943 |
| Blanched | -2.026 | -2.568 | -3.495 | -2.365 | -2.683 | -2.366 | -2.5838 |
| Peeled | -1.598 | -2.341 | -2.956 | -2.359 | -2.547 | -2.614 | -2.4025 |
| Unpeeled | -1.351 | -1.844 | -2.768 | -2.554 | -2.339 | -3.126 | -2.3303 |
The sliced treated sample exhibited the highest drying rate, which might be attributed to diffusion behavior of the surface. The moisture travelled faster to the surface and evaporated than other treatments. Similar research showed that blanching increases the drying rate [27]. The various treatments exhibited different drying behaviors at lower drying temperatures; but as the drying temperature increased to 50°C, the difference becomes minimal. These variances could arise since blanching moderately exposed the sample to hot water and some cells might be slackened; which could cause the moisture diffusion to be higher and as consequently, resulting to higher the drying rate. The effect of this becomes conspicuous at drying temperature of 40°C – 50°C. Similar results were presented for red chili [28] and pear fruit [29]. External and internal factor have been reported to be responsible for controlling drying mechanisms in agricultural products. [30, 31]. The results indicated that the use of environmental chamber for drying purposes has minimized the drying time when compared with available reports on drying of peeled and unpeeled ginger which hitherto took 11 days to attain a moisture content of 17% using the open sun drying and 7.8% with the solar dryer [32]. Although samples in the solar dryer dry faster than those in the open-air sun, the convective drying methodology is a better time-saving measure. This observation agrees with some published reports [33-35].
4.8. Effect of Drying Time on Thermal Conductivity
Drying time is an important factor in the agro-based industrial process. Most agriculture products come in wet conditions and need to be dried to required standard moisture content at a given time interval. Variations in thermal conductivity of the variously treated ginger samples at various drying temperatures for drying time are shown in tables 8 to 13. Figures 9 to 14 present the effect of drying time on the thermal conductivities of the variously treated ginger samples.
Table 8: Variations in Thermal Conductivity of the Variously Treated Ginger Samples at Drying Temperature of
|
Time (Hour) |
Thermal Conductivity (unblanched) |
Thermal Conductivity (blanched) | Thermal Conductivity (unpeeled) |
Thermal Conductivity (peeled) |
| 2 | 0.4064 | 0.329 | 0.3397 | 0.3768 |
| 4 | 0.3188 | 0.2878 | 0.3093 | 0.3004 |
| 8 | 0.2657 | 0.1993 | 0.2657 | 0.2623 |
| 10 | 0.2303 | 0.1901 | 0.2329 | 0.2115 |
| 14 | 0.1834 | 0.1699 | 0.2205 | 0.1919 |
| 16 | 0.1727 | 0.1558 | 0.2093 | 0.1658 |
| 24 | 0.1607 | 0.14 | 0.1713 | 0.1449 |
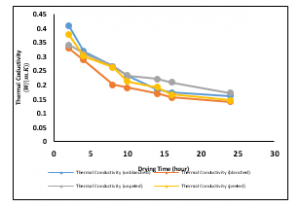
Figure 9: Variations of Thermal Conductivities of the Ginger samples at a drying temperature of 100C
Figure 9 presents the variation of thermal conductivity with drying time at a drying temperature of 10°C. The best fits to the data were logarithmic and polynomial of the second-order trend. The thermal conductivities for the variously treated samples decrease with time, which implies that as time progresses, less amount of moisture is lost. The thermal conductivity of the unblanched treated sample reduced from 0.4064W/mK to 0.1607W/mK within the twenty-four drying time. The thermal conductivity of the blanched treated sample reduced from 0.3397W/mK to 0.1713W/mK within the twenty-four drying time. The thermal conductivity of the unpeeled treated sample reduced from 0.329W/mK to 0.14W/mK within the twenty-four drying time. The thermal conductivity of the peeled treated sample reduced from 0.3768W/mK to 0.1449W/mK within the twenty-four drying time.
Table 9: Variations in Thermal Conductivity of the Ginger Samples at Drying Temperature of
|
Time (Hour) |
Thermal Conductivity (unblanched) | Thermal Conductivity (blanched) | Thermal Conductivity (unpeeled) | Thermal Conductivity (peeled) |
| 2 | 0.4064 | 0.2919 | 0.3454 | 0.3768 |
| 4 | 0.3188 | 0.2527 | 0.3343 | 0.3238 |
| 8 | 0.2382 | 0.2228 | 0.2839 | 0.2839 |
| 10 | 0.1974 | 0.1742 | 0.2329 | 0.2115 |
| 14 | 0.1901 | 0.157 | 0.2205 | 0.1818 |
| 16 | 0.1658 | 0.1449 | 0.1802 | 0.1594 |
| 24 | 0.1491 | 0.1312 | 0.1713 | 0.1391 |
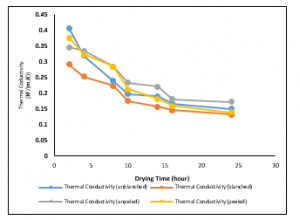
Figure 10: Variations of Thermal Conductivities of the Ginger samples at a drying temperature of 200C
Figure 10 presents the variation of thermal conductivity with drying time at a drying temperature of 20°C. Also, the best fits to the data were logarithmic and polynomial of a second-order trends. Also, the thermal conductivities for the variously treated samples decrease with time. It could be seen that as time increases, the thermal conductivity of the blanched treated sample is reduced as low as 0.1312W/mK.
The variation of thermal conductivity with drying time at a drying temperature of 30°C is shown in figure 11. Also, the best fits to the data were logarithmic and polynomial of a second-order trend. As expected the thermal conductivities for the variously treated samples decrease with time. It could be seen that as time increases, the thermal conductivity of the unpeeled treated sample is reduced as low as 0.0611W/mK.
Table 10: Variations in Thermal Conductivity of the Ginger Samples at Drying Temperature of 300C
|
Time (Hour) |
Thermal Conductivity (unblanched) | Thermal Conductivity (blanched) | Thermal Conductivity (unpeeled) | Thermal Conductivity (peeled) |
| 2 | 0.1074 | 0.1006 | 0.1126 | 0.1459 |
| 4 | 0.0996 | 0.0913 | 0.1021 | 0.1132 |
| 8 | 0.0987 | 0.081 | 0.081 | 0.0909 |
| 10 | 0.0955 | 0.08 | 0.074 | 0.0776 |
| 14 | 0.0809 | 0.0761 | 0.0658 | 0.0715 |
| 16 | 0.0785 | 0.0732 | 0.063 | 0.0693 |
| 24 | 0.0677 | 0.0689 | 0.0611 | 0.0652 |
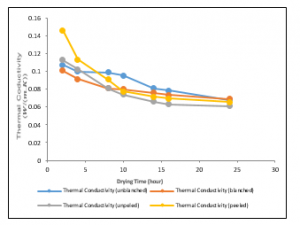
Figure 11: Variations of Thermal Conductivities of the Ginger samples at a drying temperature of 300C
Table 11: Variations in thermal conductivity of the ginger samples at drying temperature of 400C
| Time (Hour) | Thermal Conductivity (unblanched) | Thermal Conductivity (blanched) | Thermal Conductivity (unpeeled) | Thermal Conductivity (peeled) |
| 2 | 0.0756 | 0.0707 | 0.0717 | 0.0717 |
| 4 | 0.0691 | 0.0662 | 0.0658 | 0.071 |
| 8 | 0.066 | 0.0648 | 0.0611 | 0.0662 |
| 10 | 0.0638 | 0.0636 | 0.0572 | 0.0624 |
| 14 | 0.0608 | 0.0606 | 0.056 | 0.059 |
| 16 | 0.0581 | 0.0574 | 0.0557 | 0.0548 |
| 24 | 0.0557 | 0.0562 | 0.0543 | 0.0516 |
The variation of thermal conductivity with drying time at a drying temperature of 40⁰C is shown in figure 12. The best fits to the data were logarithmic and polynomial of a second-order trend. As expected the thermal conductivities for the variously treated samples decrease with time. It shows that as time increases to twenty fours, the thermal conductivity of the peeled treated sample reduces to 0.0516W/mK.
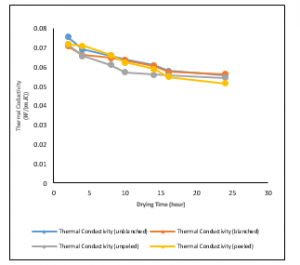
Figure 12: Variations of Thermal Conductivities of the Ginger samples at a drying temperature of 400C
Table 12: variations in thermal conductivity of the ginger samples at the drying temperature of 500C
| Time (Hour) | Thermal Conductivity (unblanched) | Thermal Conductivity (blanched) | Thermal Conductivity (unpeeled) | Thermal Conductivity (peeled) |
| 2 | 0.0715 | 0.073 | 0.0776 | 0.0759 |
| 4 | 0.0698 | 0.065 | 0.071 | 0.0695 |
| 8 | 0.0675 | 0.0626 | 0.0622 | 0.0634 |
| 10 | 0.0652 | 0.061 | 0.0596 | 0.0571 |
| 14 | 0.0582 | 0.0584 | 0.054 | 0.0555 |
| 16 | 0.0563 | 0.0581 | 0.0465 | 0.0543 |
| 24 | 0.0541 | 0.0556 | 0.046 | 0.0519 |

Figure 13: Variations of Thermal Conductivities of the Ginger samples at a drying temperature of 500C
Figure 13 present the variations of thermal conductivity with drying time at a drying temperature of 50°C. The best fit to the data was found to be logarithmic and polynomial of a second-order trend. The thermal conductivities for the variously treated samples decrease with time, while the unpeeled treated sample exhibited the least value of thermal conductivity.
Table 13: variations in thermal conductivity of the ginger samples at the drying temperature of 600C
| Time (Hour) | Thermal Conductivity (unblanched) | Thermal Conductivity (blanched) | Thermal Conductivity (unpeeled) | Thermal Conductivity (peeled) |
| 2 | 0.0762 | 0.0836 | 0.0776 | 0.0791 |
| 4 | 0.072 | 0.0762 | 0.0689 | 0.0727 |
| 8 | 0.0695 | 0.0732 | 0.0622 | 0.0664 |
| 10 | 0.0691 | 0.0576 | 0.0596 | 0.0611 |
| 14 | 0.0652 | 0.0566 | 0.054 | 0.0557 |
| 16 | 0.0644 | 0.0536 | 0.0465 | 0.0534 |
| 24 | 0.0553 | 0.0516 | 0.046 | 0.0483 |
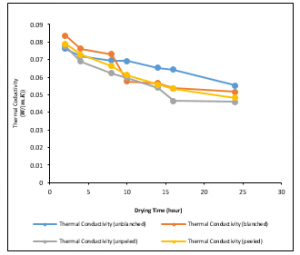
Figure 14: Variations of Thermal Conductivities of the Ginger samples at a drying temperature of 600C
Figure 14 presents the variation of thermal conductivity with drying time at a drying temperature of 60°C. The best fits to the data were found to be logarithmic and polynomial of a second-order trend. The thermal conductivities for the variously treated samples decrease with time. Also, the initial thermal conductivities for the various treatments decrease with temperature. The thermal conductivity value recorded was highest at drying time of 2 hours and then drops meaningfully until it reaches a drying time of 24 hours. This trend was prominent at drying temperatures of 10°C – 20°C and became insignificantly at drying temperatures of 30°C – 60°C for the variously treated samples.
The drying characteristics of Nigerian ginger rhizomes investigated shown that the drying route employed might be hastened only during the initial stages of the drying process where the movement of mass and air and are external factors that influence the rate of drying. The unpeeled and blanched treated ginger rhizomes are similarly influenced by the presence of moisture barriers like the unpeeled skins. As the studies reveal, drying of ginger rhizomes at low temperatures of 10°C-20°C does not have much significance on drying behavior as it maintains high initial moisture content and high thermal conductivity. However, as the temperature increases above 60°C ginger rhizomes becomes sensitive to temperature both in texture and color. The author opines that the drying of ginger rhizomes could be accomplished at temperatures between 50°C to 60°C to maintain the desired drying criteria.
5. Conclusion
The following conclusions were drawn from this study:
- It was gathered that ginger rhizomes might be dried at various temperatures. But ginger rhizomes dried at lower temperature might not reduce the effects of pest and bacterial infections, while drying at high temperatures say 60°C will considerably reduce the effects of pest and bacterial infecting connected with moist ginger rhizomes.
- The drying rate at drying time of 24 hours was 0.889/°C and 0.4437/°C for 2 hours drying time, giving about 50% reduction in moisture content. The interception which theoretically gives the initial moisture content of 0°C is lower at 24 hours drying (59.33%) compared to 95.12% on dry bases at 2 hours drying time, as expected. The average drying time for the variously treated ginger sample is about 2.4hours.
- The result of this study shows that the lowest moisture content of 5.98% was obtained for unpeeled ginger while the highest value of 9.04% was gotten for blanched sample for drying time of 24 hours and drying temperature of 60°C.
- The average moisture contents were 70.6% and 7.55% for 2 hours drying time at 60°C and 24hours drying time at 60°C respectively. The moisture content of 7.55% is close to the range of 4-7% desired for this research. This is an improvement to the result of 22.54% obtained at 50°C under blanched condition drying for 32 hours. [36, 37] as reported earlier the principal processing of ginger rhizomes involve sorting, washing, soaking, splitting, or peeling and drying to moisture content of 7-12%.
- The importance of drying ginger for a long time at temperatures close to 60°C has been shown in this work. At higher temperatures, ginger shrinkage and surface discoloration may occur. As can be seen, good results are attainable at a temperature of 60°C to maintain the quality of the products.
- The average effective moisture diffusivity and the average activation energy for the variously treated ginger rhizome samples are 5.49×10⁻¹⁰m2/s and 22.63kJ/mol respectively.
- A. I. Gbasouzor, M. Sabuj, and J. E. Dara, “Determination of thin layer drying characteristics of ginger rhizome slices at varied temperatures,” in October 2019 World Congress on Engineering and Computer Science, 468-476, 2019.
- E.K. Akpinar and S. Toraman ” Determination of drying kinetics and convective heat transfer coefficients of ginger slices,” Heat and Mass Transfer, 51(10), 1-11, 2015, doi:10.1007/s00231-015-1729-6.
- M. Nishina, D. Sato, W. Nishijima, R. Mau, “Ginger root production in Hawaii”, Hawaii Cooperative Extension Service, 6(92), 3-6, 2013.
- A.I Gbasouzor, Joshua Depiver and J E.Njoku, “A Temperature distribution and boundary condition on heat transfer from discretized element of dried ginger rhizome using Matlab PDES for optimal preservation” World Congress on Engineering and Computer Science, 712-718, 2018, doi:10.1007/978-981-15-6848-0_8.
- NEPC, “Product Profile of Ginger” Nigerian Export Promotion Council b/k 312, Kumba St. Wuse, Zone-II, Abuja, 1- 6, 1999.
- FAO, The state of food and agriculture, Food and Agricultural Organization of the United Nations, 2008.
- Edwards David, Market for Dried, Preserved and Fresh Ginger, Natural Resource Institute, U. K., 1975.
- L. I. Onu, G. I.Okafor, “Effect of physical and chemical factor variations on the efficiency of mechanical slicing of Nigerian ginger (Zingiber Officinale Rose)”, Journal of Food Engineering, 56(1), 43–47, 2003, doi: 10.1016/S0260-8774(02)00146-2.
- O. Ekundayo, I. Laakso, R. Hiltumen, “Composition of ginger (Zingiber officinale roscoe) volatile oils from Nigeria”, Flavour and Fragrance Journal, 3(2), 85-90, 1988, doi.org/10.1002/ffj.2730030207.
- A. I. Gbasouzor, S. N. Omenyi “Convective Drying of Ginger Rhizomes” in Transactions in Engineering Technologies, Springer Nature Singapore Netherlands, 2019.
- G.I. Okafor and J.N. Okafor, “Effects of pricking, sun-drying and sieving on Ginger (Zingiber officinale Roscoe) colour and powder,” Nigerian Food Journal, 25(1), 155-160, 2007, doi: 10.4314/nifoj.v25i1.33664.
- E. Oti, P. Okwuowulu, Ohiori V. and G. Chijioke “Biochemical changes in ginger (Zinginger officinale roscoe) rhizomes stored under river sand and under dry grasses in pits in the humid tropics,” Trorical Science, 28(2), 87-94, 1988.
- C. G. Arocha and K. J. Simonyan, “Development of a motorized ginger rhizomes peeling machine,” Nigerian Journal of Technology, 38(3), 769 – 776, 2019, doi.org/10.4314/njt.v38i3.32.
- G. Nwandikom and B. Njoku, “Design-related physical properties of Nigerian ginger,” Proceedings of First National Ginger Workshop, 101-107, 1988.
- G. Akomas and E. Oti, “Developing a technology for the processing of Nigerian ginger (Zingiber Officinale Roscoe),” Proceedings of the First National Ginger Workshop, 93-100, 1988
- L. Onu, “Design and fabrication of manual ginger slicing machine,” Annual Research Report, Federal Institute of Industrial Research, Oshodi, Lagos, Nigeria, 34(1), 1997.
- C.N. Egbuchua and E.C. Enujeke, “Growth and yield responses of ginger (Zingiber officinale) to three sources of organic manures in a typical rainforest zone, Nigeria,” Journal of Horticulture and Forestry, 5(7), 109-114, 2013, doi.10.5897/JHF2013.0302.
- A.I. Gbasouzor, Prediction of Thin Layer Drying Characteristics of Ginger Rhizome Slices in Convective Environment. Ph.D. Thesis Department of Mechanical Engineering, Nnamdi Azikiwe University, Awka, Nigeria, 2019.
- A.I. Gbasouzor, S.N. Omenyi and S. Mallik, “Simulation and discretized element of ginger on thin layer Drying using MATLAB PDEs for optimal programming,” Journal of Engineering and Applied Sciences, 16(1), 2020.
- E.K. Akpinar, “Mathematical modelling of thin layer drying process under open sun of some aromatic plants,” Journal of Food Engineering, 77(4), 864–870, 2006, doi.org/10.1016/j.jfoodeng.2005.08.014.
- Z. Erbay and F. Icier, “A review of thin layer drying of foods: theory, modeling, and experimental results,” Critical reviews in food science and nutrition, 50(5), 441–464, 2010, DOI: 10.1080/10408390802437063.
- L.R, Verma, R.A. Bucklin, J.B. Endan and F.T. Wratten, “Effects of Drying Air Parameters on Rice Drying Models,”Transactions of the American Society of Agricultural Engineers, 28(1), 0296–0301, 1985, doi: 10.13031/2013.32245.
- A.I. Gbasouzor and S.N. Omenyi, “Modelling and Prediction of Thin Layer Drying Characteristics of Ginger Rhizome Slices in Convective Environment,” Proceedings of the World Congress on Engineering and Computer Science, 477-486, 2019.
- R. Hasibuan and M. Bairuni, “Mathematical modeling of drying kinetics of ginger slices,” AIP Conference Proceedings 1977, 020047, doi.org/10.1063/1.5042903.
- O.A. Aregbesola, B. Ogunsina, A.E. Sofolahan and N.N. Chime, “Mathematical modeling of thin layer drying characteristics of dika (Irvingia gabonensis) nuts and kernels,” Nigerian Food Journal, 33(1), 83–89, 2015, doi: 10.1016/j.nifoj.2015.04.012.
- M.M. Alam, M.Z. Hossain, M. Aktar, M.S. Islam and Z. Hasan, “Drying and Dehydration Kinetics of Ginger,” International Journal of Innovation and Applied Studies, 9(2), 956-967, 2014 .
- K.A. Bala, Drying and Storage of Cereal Grains, second edition, Wiley Blackwell, 2016.
- M.A. Hossain and B.K. Bala, “Drying of hot chilli using solar tunnel drier,” Solar Energy, 81(1), 85-92, 2007, doi.org/10.1016/j.solener.2006.06.008.
- S. Lahsasni, M. Kouhila, M. Mahrouz and J.T. Jaouhari, “Drying kinetics of prickly pear fruit (Opuntia ficus indica),” Journal of Food Engineering, 61(2), 173-179, 2004, doi.org/10.1016/S0260-8774(03)00084-0.
- J.K.Gigler, W.K.P.van Loon, I.Seres, G.Meerdink and W.J.Coumans, “PH – Postharvest Technology: Drying Characteristics of Willow Chips and Stems,” Journal of Agricultural Engineering Research, 77(4), 391-400, 2000, doi.org/10.1006/jaer.2000.0590.
- O.V. Ekechukwu, “Review of solar-energy drying systems I: an overview of drying principles and theory,” Energy Conversion and Management, 40(6), 593-613, 1999, doi.org/10.1016/S0196-8904(98)00092-2.
- J. I. Eze and K.Agbo, “Comparative studies of sun and solar drying of peeled and unpeeled ginger,” American Journal of Scientific and Industrial Research, 2(2), 136-143, 2011, doi:10.5251/ajsir.2011.2.2.136.143.
- N.W. Desrosier and J.N. Desrosier, The Technology of Food Preservation, AVI Publishing Company, 1977.
- Y. Wang, M. Zhang and A.S. Mujumdar, “Convective Drying Kinetics and Physical Properties of Silver Carp (Hypophthalmichthys molitrix) Fillets,” Journal of Aquatic Food Product Technology, 20($), 361-378, 2011, doi:10.1080/10498850.2011.575536.
- T. Koyuncu, Y.Pinar and F. Lüle, “Convective drying characteristics of azarole red (Crataegus monogyna Jacq.) and yellow (Crataegus aronia Bosc.) fruits,” Journal of Food Engineering, 78(4), 1471–1475, 2007, doi: 10.1016/j.jfoodeng.2005.09.036.
- R. Shalini, A. Ranjan and N. Kumar, “Studies on the Drying Characteristics of Apple pomace on tray drier,” 16th International Drying Symposium (IDS 2008), 1636-1640, 2008.
- C.A. Biju, Drying characteristics of New Zealand chestnuts, Thesis, Master of Science MSc, University of Waikato, Hamilton, New Zealand, 2007.