
The Impact Assessment of the Errors in Determining the Mass and Zero Lift-Drag Coefficient on the Aircraft’s Performance Data
Volume 5, Issue 6, Page No 118-126, 2020
Author’s Name: Klyagin Viktor Anatolievich, Laushin Dmitry Andreevicha)
View Affiliations
Department Aircraft Design and Certification, Moscow Aviation Institute (National Research University), Moscow, 125993, Russia
a)Author to whom correspondence should be addressed. E-mail: maksmai33@gmail.com
Adv. Sci. Technol. Eng. Syst. J. 5(6), 118-126 (2020); ![]() DOI: 10.25046/aj050613
DOI: 10.25046/aj050613
Keywords: Uncertainties, Risks, Flying qualities and performances, Influence coefficients

Export Citations
The adoption of technical decisions in the development of a new aircraft is carried out under the condition of insufficient information on the mass – dimensional and aerodynamic characteristics that will be achieved during the project. Insufficient information on the input parameters (weight and aerodynamic characteristics) leads to uncertainties in the values of the flying qualities and performances. When creating a new aircraft, the chief designer and specialists of the design bureaus establish certain reserves (limits) for mass and aerodynamic characteristics. The allocation of reserves for the characteristics of aircraft elements is carried out, as a rule, on the basis of experience gained from previous projects, and to a certain extent subjective. At the same time, it is not possible to quantify the risk of non-fulfillment of the tactical and technical task in terms of performance characteristics. Knowing the contribution of the uncertainties of the input parameters (for the values of which a margin is allocated) to the uncertainty of the final values of the flight characteristics will allow the person who makes the decision to reasonably establish reserves in the design of the aircraft and take a more reasonable risk. In this paper, the authors describe an approach that allows for a quantitative assessment of the impact assessment of the errors in determining the aircraft’s characteristics on the tactical and technical task in terms of the aircraft’s performance data. Using the example of the mass and zero lift-drag coefficient, analytical dependencies are derived that allow a quantitative assessment of the effect. To verify the obtained analytical dependencies, the calculation of weight coefficients was made for several aviation complexes of operational-tactical aviation. The analysis of the sensitivity of the aircraft’s performance data to the parameters under consideration is carried out.
Received: 30 July 2020, Accepted: 01 October 2020, Published Online: 08 November 2020
1. Introduction
When developing new aircraft, the most important decisions that determine the future fate of the project are made at the initial stages of work in conditions of uncertainty about the impact of these decisions on the performance of the – tactical and technical task (TTT). Mistakes in the early stages of design tend to cost more money and time for their elimination at the subsequent stages of the aircraft, and sometimes on the correctness of decisions depends on the feasibility of the project as a whole.
The uncertainty of the performance of the tactical and technical assignment in terms of flight characteristics at the stage of internal and external design is associated with many factors. For example, a delay in the receipt from related enterprises of reliable data on the characteristics of aircraft systems (such as engine, target equipment, etc.), insufficient knowledge of some physical laws, which is most pronounced when new technical solutions are introduced, and others.
When predicting the level of performance characteristics of a new aircraft, they rely on indicators of its technical perfection, which will be achieved as a result of the project. These include the relative mass of the structure and systems, specific engine thrust, specific fuel consumption, aerodynamic quality, and others. With the development of aviation, these indicators are constantly improving.
The choice of a reasonable level of technical excellence, and therefore TTT in the design of a new aircraft, is an important task. Excessive overestimation of the requirements for its weight and aerodynamic characteristics can lead not only to non-fulfillment of the promising requirements for flight performance, but also deterioration of the flight characteristics of the designed aircraft relative to the current level already achieved due to the mismatch of the characteristics of its elements. At the same time, the use of previously developed technical solutions and technologies, in which there is no risk, does not make it possible to ensure the required increase in flight performance and, as a consequence, efficiency in the development of new generation aircraft. Therefore, at the initial design stage, when applying certain technical solutions, it is necessary to have a clear idea of the real possibilities of performing the performance characteristics specified in the TTT.
In accordance with the existing design methodology, when creating a new aircraft, the chief designer and specialists of the design bureaus establish certain reserves (limits) for mass and aerodynamic characteristics. The reason for the allocation of such reserves is that at the initial design stage there is no exact idea of the final value of mass and aerodynamic characteristics, which will be obtained upon completion of the development stage. Each aircraft has its own targets. Therefore, the characteristic for which the reserve is allocated depends on the specific type of aircraft. For example, the characteristics of a commercially available engine are known values. If the power plant is at the development stage, there is a risk of non-implementation of the TTT of the engine, which may affect the non-implementation of the TTT of the aircraft. The use of insufficiently mastered materials or technologies in the aircraft structure can lead to a significant deviation in the mass characteristics of the airframe units, etc. Therefore, the identification of the main elements that introduce uncertainty in the level of aircraft performance should be made in each case specifically.
The allocation of reserves for the characteristics of aircraft elements is carried out, as a rule, on the basis of experience gained from previous projects, and to a certain extent subjective. At the same time, it is not possible to quantify the risk of non-fulfillment of TTT in terms of performance characteristics. Knowing the contribution of the uncertainties of the input parameters (for the values of which a margin is allocated) to the uncertainty of the final values of the flight characteristics will allow the person who makes the decision to reasonably establish reserves in the design of the aircraft and take a more reasonable risk.
Approaches to the formation of the appearance of an aircraft with inaccurate determination of the initial data are reflected in many scientific works, for example [1-10]. The relevance of this issue is also confirmed by scientific works [11-15].
To assess the technical solutions adopted in the design, it is necessary to associate particular changes in various parameters (weight, aerodynamic characteristics) with a change in the aircraft flight characteristics.
2. Materials and Methods
Let’s introduce the concept of the influence coefficient (IC) – a dimensionless coefficient showing the ratio of the change in function (f) to the change in input parameters (xi) in the relative form:
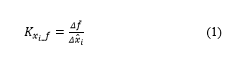
where , , – uncertainty of the function and the input parameters, f1 and – expected value of the function and the input parameters.
In the absence of a relationship between the initial parameters, ICs are the coefficients of linear decomposition of the inaccuracy of determining the function from the errors in determining the parameters (in the relative form):
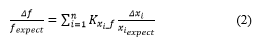
The numerical value of the IC is equal to the percentage change of flying qualities and performances (FQP) when the parameter changes to 1%.
This paper assesses the influence of such parameters as mass (m) and zero lift-drag coefficient (Сх0) on:
– maximum flying speed – Vmax;
– service ceiling – Hmax;
– specific excess power (max) – ;
– sustained load factor – ny;
– acceleration time – tp.
For a comprehensive study of the considered IC, the research is carried out in two directions:
- Analytically, by deriving IC from the formula dependencies of the FQP;
- Numerical calculations of the IC by calculating the changes in FQP with varying mass and zero lift-drag coefficient.
The analytical method makes it possible to establish the dependence of IC on specific aircraft parameters. These dependencies are derived from the flight dynamics formulas and can be applied to absolutely any aircraft with a similar flight principle. However, to represent the dependencies in a relatively simple and easy-to-use form, it is necessary to introduce some assumptions that can be used to perform the required mathematical transformations. The formulas obtained require verification, since one and the same introduced assumption can give different errors in magnitude, depending on the type of aircraft and its purpose.
The verification of the derived formulas for IC can be carried out by the calculation method. The computational method, in contrast to the analytical one, allows one to obtain the exact value of IC (without assumptions), but does not allow one to establish the dependence of IC on the aircraft parameters. The IC is calculated using the FQP calculation program detailed in section 2.
Thus, comparison of the analytical findings with numerical calculations allows to prove the accuracy of the first.
3. Calculation of the influence coefficient by analytically method
For various parameters, the degree of their uncertainty can differ significantly depending on the level of elaboration of certain elements of the aircraft. The accuracy of calculating the mass of aircraft at the stage of the preliminary project is 6-10%, outline design 3-5%, working draft 1-2% [5].
The influence coefficient, as described above, is indicated . According to the IC mass for sustained load factor is indicated , IC to specific excess power – , etc. We use the following notation:
– relative changes in mass and zero lift-drag coefficient.
3.1. The influence of parameters on maximum flying speed
The maximum flying speed can be expressed from the equality of thrust and drag:

where – inductive reactance coefficient, – thrust at which maximum speed is reached, S – wing area, – air density.
The inductive component of resistance when flying at maximum speed is small. In this case Схi≈0 and the maximum flight speed can be calculated by the formula:

Let , and the coefficient will show the characteristics’ flow of the altitude-speed performance (ASP) (with a change in Vmax, the engine thrust will change). Then the influence coefficient Сх0 to Vmax will be equal to:
The coefficient corresponds to a specific aircraft because its value is influenced by both the engine’s ASP and the intake losses ( and nozzle ( :
![]()
The maximum flying speed is not always determined by the required and available thrusts. Limitations may include temperature, structural strength, stability and control of the aircraft.
As described above, it may be concluded that the biding of the coefficient to the parameters of the aircraft is impractical, because it will not give a true picture of understanding the impact of the change to Vmax.
3.2. The influence of parameters on service ceiling
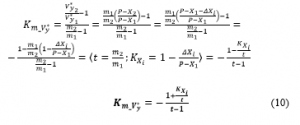
The effect changes on the ceiling can be estimated by the formula [16]:
The value of the coefficient is related to the initial ceiling of the aircraft and does not depend on the percentage change in mass (Table 1).
Table 1: The dependence of on the service ceiling.
| Initial ceiling Hmax, km | Δ | Δ Hmax., % | Δ Hmax., m | |
| 20 | -0.315 | 0.01 (1%) | 0.315 | 63 |
| 0.05 (5%) | 1.575 | 315 | ||
| 18 | -0.35 | 0.01 (1%) | 0.315 | 63 |
| 0.05 (5%) | 1.575 | 315 | ||
| 16 | -0.394 | 0.01 (1%) | 0.315 | 63 |
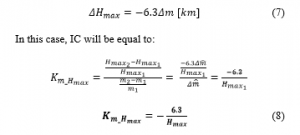
In order not to become attached to the initial ceiling, it makes sense to speak not about a relative change in Hmax, but about the absolute. Therefore, with an increase in mass by 5% the ceiling decreases by 315 meters, 10% – 630 meters. An increase in the mass of 1% leads to a decrease in the ceiling of about 63 meters.
3.3. The influence of parameters on specific express power
In order not to become attached to the initial ceiling, it makes sense to speak not about a relative change in Hmax, but about the absolute. Therefore, with an increase in mass by 5% the ceiling decreases by 315 meters, 10% – 630 meters. An increase in the mass of 1% leads to a decrease in the ceiling of about 63 meters. We write the specific excess power as follows [16]:
![]()
where – engine thrust, Х – aircraft drag, G – aircraft weight, V – flight speed.
We assume that the flying speed at which the specific excess power is calculated is constant ( ), then will be equal to:
where , – increase in inductive component due to mass increase, – abundance of power.
Note that the higher , the smaller contribution to the value of the IC makes . With small changes in mass (in this case ) and a relativity high value of we can assume that . Then at Δm=10% , and the coefficient value without the assumptions described above will be even less.
We similarly take out :
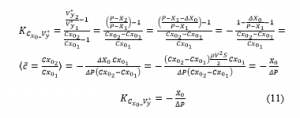
If we neglect the inductive component of the resistance, then the formula takes the form:
![]()
The value of the coefficient does not depend on the percentage change and is associated with a specific aircraft.
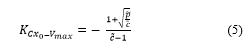
The max value of the specific excess power for fighters is achieved as a rule at M=0.8-0.9 near the ground. We calculate the IC value according to the formula (11) and (12) for several aircraft. At M=0.85 ram airflow is q=51250 H/m2, the IC excluding and taking into account the inductance is presented in Table 2.
Table 2: The values are calculated by the formula (4) and (5)
| Air-craft | M | S, m2 | P, Н | excluding | taking into account | ||
| Mig-29 | 0.9 | 0.025 | 0.0005 | 38 | 200000 | -0.398 | -0.401 |
| Su-24 (69°) | 0.8 | 0.0263 | 0.0029 | 51 | 230000 | -0.367 | -0.383 |
| Mig-23 (72°) | 0.9 | 0.0225 | 0.0026 | 34.2 | 150000 | -0.438 | -0.460 |
From Table 2 it is seen that the inductive component of the resistance makes an insignificant contribution to the value of the IC. When Cx0 is changed by 10% the differences in the scatter of Vy* excluding and taking into account Cxi are about 0.2%, which can be considered a negligible value at the preliminary design stage. Therefore, to simplify, you can use the formula (5).
3.4. The influence of parameters on sustained load factor
The sustained load factor can be expressed through the formula [16]:
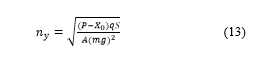
where – engine thrust, – non-inductive resistance, – velocity head, – drag-due-to-lift factor, g – acceleration of gravity, then:
The value of the coefficient depends on the percentage change in mass (Table 3).
Table 3: Dependence of on Δm
| Mass change Δm, % | Change of the sustained load factor Δny, % | |
| 5 | -0.952 | 4.8 |
| 10 | -0.909 | 9.1 |
| 15 | -0.869 | 13 |
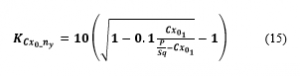
Similarly, we get :
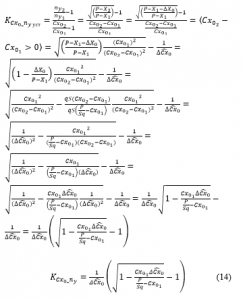
The coefficient value slightly depends on the percentage change (differences – in thousandths). When changes by 10%, the formula takes the form:
For example, we calculate the IC for several AK. At M=0.8 at a higher Н=1000m ram-air flow is equal q=41200 H/m2, (Table 4).
Table 4: The values
| Aircraft | S, m2 | P (Н=1000, М=0.8), Н | ||
| Mig-29 | 0.024 | 38 | 170000 | -0.16 |
| Su-24 (69°) | 0.026 | 51 | 206000 | -0.21 |
| Mig-23 (72°) | 0.022 | 34.16 | 130000 | -0.18 |
3.5. The influence of parameters on acceleration time
Acceleration time in horizontal flight in within speed range is [17]:
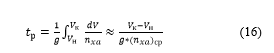
Where Vн and Vк – initial and final speed, (nxa)ср – averaged longitudinal g load for within speed range.
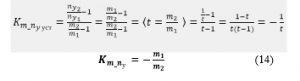
Let’s get the formula for :

where and – the average engine thrust margin and the average increase of the induced drag for the speed range acceleration.
The value of the coefficient slightly depends on the percentage change in the mass. Assuming 0 ( is significantly less than the average available thrust ) =1, and taking into account the influence of increased inductance (due to the increase in mass) the coefficient value will be slightly larger. For example, for Mig-29 during acceleration 600 – 1100 km/hour near the ground (Table 5).
Table 5: The values for Mig-29 (600 – 1100 km/hour on the deck)
| m1, kg | Δm, % | ΔCy | ΔCxi | Pср, kgf | Xср, kgf | ΔXi, kgf | |
| 15000 | 10 | 0.011 | 0.001 | 16000 | 4000 | 130 | 1.12 |
If accept and , takes the following form:

The coefficient value slightly depends on the percentage change and is associated with a specific aircraft. For Mig-29 = 0.27 (Table 6).
Table 6: The values for Mig-29 (600 – 1100 km/hour near the ground)
| Cx0 | Δ Cx0, % | Pср, kgf | , kgf | |
| 0.025 | 10 | 16000 | 3300 | 0.27 |
4. Calculation of the influent coefficients by numerical method
To confirm the derived dependencies (8), (10), (12), (14), (15), (17), (18), we calculate the IC using the “Program for preparing the initial data and calculating the FQP”. This software product was developed by Sukhoi Design Bureau and verified by many years of the application practice. The program uses weight, aerodynamic characteristics (Сх0(М), Cxi (Cy, M), Сymax(М), Cya)
and propulsive characteristics P (H, M, Dr) Qс(H, M, Dr), as well as some limitations (qmax, nymax) and constants. The graphs Сх0(М), Cxi (Cy, M), Сymax(М) Cya, P (H, M), Qс(H, M) are digitized from books of practical aerodynamics [18-21]. ICs are calculated according to the algorithm shown in the Figure 1.
We calculate IC for the following aircraft of the class of operational – tactical aviation: fighter 4th generation Su-27; frontline bomber Su-24; strike-fighter Su-25; fighter 4th generation Mig-29; fighter 3rd generation Mig-23; interceptor jet 3rd generation Mig-25.

Figure 1: IC calculation scheme
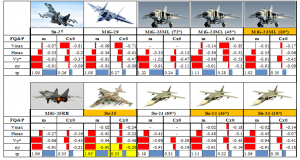
Table 9 and Figures 2-11 show the results of calculating the IC programmatically. ICs were obtained when the mass changed by 10%, Сх0 changed for М<1 by 10% and for М>1 by 18%. Such differences in the spread of Сх0 are taken on the assumption that the inaccuracy of determining this parameter for the supersonic domain of flight is higher. Aircraft characteristics are taken in the calculations are presented in Table 7.
The effect on the service ceiling is shown in Figures 2 and 3, on the specific excess power – in Figures 4 and 5, on the sustained load factor – in Figures 6 and 7, for the acceleration time – in Figures 8 and 9. Figures 2-9 also show the values obtained from the above formulas.

Figure 2: values
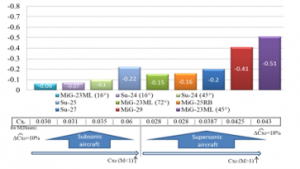
Figure 3: values
Table 7: Aircraft characteristics, used in the calculations
| Aircraft | MiG-29 | MiG-25RB | MiG-23ML (72 ) | MiG-23ML (45 ) | MiG-23ML (16 ) | Su-27 | Su-25 | Su-24 (69 ) | Su-24 (45 ) | Su-24 (16 ) |
| Weight | ||||||||||
| Mass in calculations, kg | 15000 | 24000 | 18000 | 18000 | 18000 | 21200 | 13000 | 25000 | 25000 | 25000 |
| Wing parameters | ||||||||||
| Wing area, m2 | 38 | 61.5 | 34.16 | 35.3 | 37.27 | 62 | 30.1 | 51 | 53 | 55.18 |
| Wing extension | 3.39 | 2.94 | 1.77 | 3.43 | 5.26 | 3.5 | 6 | 2.11 | 3.9 | 5.64 |
| Leading edge a sweep angle, deg. | 42 | 41 | 74 | 47 | 18 | 42 | 20 | 69 | 45 | 16 |
| Power plant specifications | ||||||||||
| Jet engine | 2xRD-33 | 2xR-15-300 | R-35 | R-35 | R-35 | 2xA1-31F | 2xR-95 SH | 2xA1-21 F-3 | 2xA1-21 F-3 | 2xA1-21 F-3 |
| Thrust (H=0, M=0), kgf | 16000 | 22400 | 12500 | 12500 | 12500 | 25000 | 8200 | 22400 | 22400 | 22400 |
| Aircraft design parameters | ||||||||||
| Starting thrust-to weight ratio | 1.07 | 0.93 | 0.69 | 0.69 | 0.69 | 1.18 | 0.63 | 0.90 | 0.90 | 0.90 |
| Wing load, kg/m2 | 395 | 390 | 527 | 510 | 483 | 342 | 432 | 490 | 472 | 453 |
Table 8: IC for the studied aircrafts – subsonic aircraft
Sustained load factor on high 1000 m M=0.8 ( for Su-25 M=0.6)
Acceleration time on the deck 600-1100 km/hour ( for Su-25 500-800 km/hour)
Aircrafts images courtesy of Google images
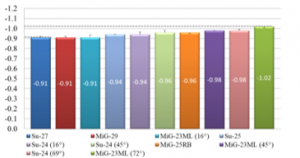
Figure 4: values

Figure 5: values
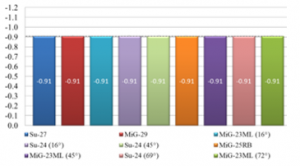
Figure 6: values (Н=1000m, M=0.8)
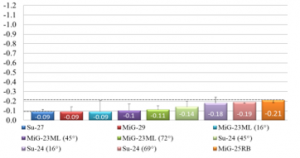
Figure 7: values (Н=1000m, M=0.8)
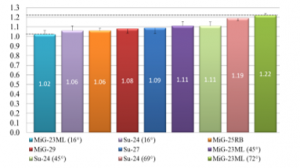
Figure 8: values
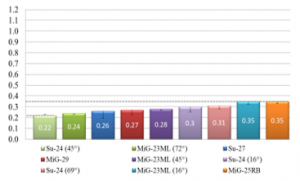
Figure 9: values
5. Results and Discussions
As can be seen from Figures 2-10, the analytically obtained ICs are confirmed by numerical calculations. The absolute error when using the derived formulas is less than 0.1 of the IC value, which in terms of FQP values gives an error of less than 10%. At the initial stage of aircraft design (when the error of other constituent elements is comparable in magnitude), this is an acceptable indicator.
Summarize the calculated IC in Table 9, the percentage change in FQP is presented in Table 10.
Table 9: IC ranges for the considered OTA aircrafts
| FQP | |||
| Мmax<1 | Мmax>1 | ||
| Vmax | -0.1 | -0.1…-0.25 | -0.7…-0.85 |
| Hmax | 0.25…0.6 | -0.05…-0.2 | -0.15…-0.5 |
| -0.9….-1.05 | -0.35…-0.55 | – | |
| (H=1000m, М=0.8) | -0.91 | -0.05…-0.2 | – |
|
tр (600-1100 km/h, H=200m) |
1…1.25 | -0.2…-0.35 | – |
Table 10: Percent change in the FQP
| FQP | With an increase in mass by 10%, the FQP deteriorates by: | With an increase in Cx0 in the subsonic area by 10% and by 18% in supersonic the FQP deteriorate by: | |
| Мmax<1 | Мmax>1 | ||
| Vmax | 1% | 1…2.5% | 12…15.5% |
| Hmax | decreases by 630 m | 0.5…2% | 3…8% |
| 9….10.5% | 3.5…5.5% | – | |
| (H=1000m, М=0.8) | 9.1% | 0.5…2% | – |
|
tр (600-1100 km/h, H=200m) |
10…12.5% | 2…3.5% | – |
From Tables 9 and 10 we can conclude that the considered FQP, such as the maximum specific excess power, sustained load factor, and acceleration time, are most sensitive to a change in mass. The inaccuracy in determining the mass in 1% gives a spread of these FQP in about 1% (more accurate values are given earlier). The IC of the mass on the practical ceiling depends on the absolute value of the ceiling, so it makes sense to talk about its absolute change. With an inaccuracy of mass of 1%, the ceiling is determined with an accuracy of about 60-70 meters.
To inaccuracy is most sensitive to the maximum flying speed (for M>1). The numerical value of the IC on Vmax is determined by the curve crossing nature of the required and available thrust (Figure 11). Graphs Cx0 (M) for the studied aircrafts are shown in Figure 10.

Figure 10: Graphs Сх0 for the studied aircrafts.
Figure 10 shows that in the area of maximum flight speed, the slope of the curves Cx0 (M) is different for different aircraft.
The power-available curve depends on the engine unit’s altitude speed performances, the required one on the drag run, therefore, the IC depends strongly on the specific aircraft (on the flow pattern of Сх0 and altitude-speed performances), therefore, linking this coefficient to the aircraft parameters is impractical. However, as the research showed, the IC value for subsonic aircraft is approximately 0.1…0.2 (Table 9), for supersonic: 0.7…0.9.
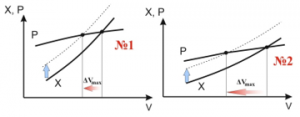
Figure 11. The different nature of Zhukovsky curve crossing. P – engine thrust curve, X – airplane drag curve.
6. Conclusions
The results of this work allow us to estimate the contribution of mass uncertainties and drag coefficient at zero lifting force to the range of variation of the FQP values.
The formulas obtained make it possible to determine the quantitative influence of the parameter on the value of the FQP. Verification of the formulas for some aircraft from the class of operational-tactical aviation showed that the error in determining the spread of flight characteristics according to the formulas obtained is within 10%.
The research showed that the mass influence coefficients Сх0 on maximum specific excess power, sustained load factor and acceleration time practically do not depend on the parameters of the considered aircrafts of the same class. The IC of mass and Сх0 on the maximum speed and practical ceiling associated with specific aircraft parameters. The sensitivity of the maximum speed to the zero lift-drag coefficient is determined by the curve crossing nature of the required and available thrust.
The inaccuracy in determining the mass in 1% gives a spread of maximum specific excess power, sustained load factor and acceleration time in about 0.9…1.3%. For the studied aircrafts the inaccuracy in determining the zero lift-drag coefficient of 1% gives a spread in the maximum speed within 0.7 … 0.9% for supersonic aircraft and 0.1 … 0.2% for subsonic aircraft.
- V.E. Denisov, V.K. Isaev, A.M. Ryabov, L.M. Shkadov, “Statisticheskaya ocenka harakteristik proektiruemogo samoleta s pomoschyu metoda Monte_Karlo” [Statistical evaluation of the characteristics of the designed aircraft using the Monte Carlo method], Uchenie zapiski CAGI [Scientific notes of TsAGI], 4(2), 137–142, 1973.
- O.K. Yugov, O.D. Selivanov, Osnovi integracii samoleta i dvigatelya [Fundamentals of the integration of the aircraft and engine], Mashinostroenie [Mechanical Engineering], 1989.
- G.?. Skopec, “Vneshnee proektirovanie aviacionnih kompleksov: Metodologicheskie aspekti” [External design of aviation complexes: Methodological aspects], LENAND, 2017.
- M. Ravachol, Y. Deremeaux, Q.V. Dinh, E. Herbin, “Uncertainties at the conceptual stage: multilevel multidisciplinary design and optimization approach”, ICAS 2008 26TH International Congress of the Aeronautical Sciences, Anchorage, Alaska; September 14-19, 2008.
- L.V. Myshkin, Prognozirovanie razvitiya aviacionnoi tehniki [Forecasting the development of aviation technology], Izdatelskii Dom Nauka [Publishing House Science], 2017.
- T. Pfeiffer, E. Moerland, D. Böhnke, B. Nagel, V. Gollnick, «Aircraft configuration analysis using low-fidelity, physics based aerospace framework under uncertainty considerations», ICAS 2014 29TH Congress of the International Council of the Aeronautical Sciences, St. Peterburg, Russia; September 7-12, 2014.
- D. Neufeld , J. Chung, K. Behdinan, “Aircraft Conceptual Design Optimization with Uncertain Contributing Analyses”, AIAA Modeling and Simulation Technologies Conference, Chicago, Illinois; August 10–13, 2009. doi: 10.2514/6.2009-6237
- M.R. Kirby, D.N. Mavris, “Forecasting Technology Uncertainty in Preliminary Aircraft Design”, AIAA, World Aviation Conference, San Francisco, CA; October 19-21, 1999.
- L.L. Green, H.Z. Lin, M.R. Khalessi, “Probabilistic methods for uncertainty propagation applied to aircraft design”, AIAA, PredictionProbe, Inc. Newport Beach, CA 92660, 2002. doi:10.2514/6.2002-3140
- M. Hosseini, M. Nosratollahi, H. Sadati, “Multidisciplinary Design Optimization of UAV under Uncertainty”, J. Aerosp. Technol. Manag., São José dos Campos, 9(2), 169–178, 2017. doi: 10.5028/jatm.v9i2.725
- D.N. Mavris, D.A. DeLaurentis , D.S. Soban, “Probabilistic Assessment of Handling Qualities Characteristics in Preliminary Aircraft Design”, AIAA 98-0492, 36th Aerospace Sciences Meeting & Exhibit Copyright, 1998.
- D.N. Mavris, D.A. DeLaurentis, D.P.Schrage, “System Synthesis in Preliminary Aircraft Design Using Statistical Methods”, the 20th International Council of the Aeronautical Sciences (ICAS) Congress, Sorrento, Italy, September 8-13, 1996.
- G.S. Veresnikova, L.A. Pankova, V.A. Pronina, O.V. Ogorodnicov, I.I. Ikryanov, “Determining maneuverable aircraft parameters in preliminary design under conditions of uncertainty”, International Conference on Knowledge Based and Intelligent Information and Engineering Systems, Marseille, France; September 6–8, 2017. doi: 10.1016/j.procs.2017.08.143
- D.A. Laushin, V.A. Klyagin, “K voprosu o vliyanii faktorov neopredelennosti na oblik samoleta” [To the question of the influence of uncertainty factors on the appearance of the aircraft], v sbornike tezisov XLIV Mejdunarodnoi molodejnoi nauchnoi konferencii Gagarinskie chteniya [In the collection of theses of the XLIV International Youth Scientific Conference Gagarin Readings], Moscow Aviation Institute, 2018.
- D.A. Laushin, V.A. Klyagin, “Uchet riskov, svyazannih s dostijeniem zadannih letno_tehnicheskih harakteristik samoleta” [Accounting for the risks associated with achieving the specified flight performance of the aircraft], Obscherossiiskii nauchno_tehnicheskii jurnal POLET [All-Russian scientific and technical journal POLET], 1, 28–32, 2019.
- A.M. Tarasenkov, V.G. Braga, V.T. Taranenko, Dinamika poleta i boevogo manevrirovaniya letatelnih apparatov [Dynamics of flight and combat maneuvering of aircraft, VVIA im. prof. N.E. Jukovskogo [Zhukovsky VVIA], 1984.
- G.S. Busgens, Aerodinamika, ustoichivost i upravlyaemost sverhzvukovih samoletov [Aerodynamics, stability and controllability of supersonic aircraft], Fizmatlit, 1998.
- “Prakticheskaya aerodinamika samoleta MiG-29” [Practical aerodynamics of the MiG-29], Moskva, slujebnoe izdanie VVS [Moscow, official publication of the Air Force], 1987. Available Online at: http://bookre.org/reader?file=543564
- “Prakticheskaya aerodinamika samoleta MiG-23ML i MiG-23UB” [Practical aerodynamics of the MiG-23ML and MiG-23UB], VVIA im. Jukovskogo [Zhukovsky VVIA], 1978. Available Online at: http://bookre.org/reader?file=543565
- “Prakticheskaya aerodinamika samoleta MiG-25RB” [Practical aerodynamics of the MiG-25RB], Voennoe izdatelstvo Ministerstva oboroni SSSR [Military Publishing House of the Ministry of Defense of the USSR], 1978. Available Online at: http://bookre.org/reader?file=543563
- “Prakticheskaya aerodinamika Su-24” [Practical aerodynamics of the Su-24]. Available Online at: http://bookre.org/reader?file=540492